XRP holds above $1.40 as ETF inflows return: Check forecast

Key Takeaways

  • XRP holds above $1.40 with modest ETF inflows and improving sentiment.
  • The weak derivatives activity and strong resistance levels keep the short-term outlook cautious.

Ripple (XRP) is trading just above $1.40 on Tuesday, showing gradual momentum despite lingering macro uncertainty.

The token, alongside the broader crypto market, has remained resilient even as tensions in the Middle East persist and the US–Iran ceasefire faces renewed pressure.

Risk appetite has stabilized in recent weeks, with the Crypto Fear & Greed Index rising to 50 from 40 a day earlier, reflecting a shift toward more neutral sentiment.

ETF inflows signal cautious optimism

Investor interest in XRP spot ETFs remains mixed but constructive. US-listed products recorded modest inflows of $3.87 million on Monday following subdued activity at the end of last week, suggesting a cautiously bullish short- to medium-term outlook.

Cumulative inflows have now reached $1.29 billion, with total assets under management at $1.07 billion. Continued ETF demand remains a key pillar for sustaining positive sentiment and supporting the case for a broader uptrend.

In the derivatives market, momentum remains muted. Open Interest (OI) in XRP perpetual futures edged up slightly to $2.60 billion from $2.50 billion the previous day.

However, this is still well below the $10.94 billion peak seen in July, when XRP reached its all-time high of $3.66. The divergence highlights the importance of stronger retail participation to drive a more meaningful rally.

Technical outlook: XRP faces a key resistance zone

The XRP/USD 4-hour chart remains bearish and efficient. XRP is trading just below the 50-day EMA at $1.41 and remains under the 100-day and 200-day EMAs at $1.51 and $1.74, indicating that upside attempts are still being capped.

Momentum indicators show mixed signals. The Relative Strength Index (RSI) sits at 60, pointing to mild bullish pressure but largely consistent with consolidation.

Meanwhile, a contracting negative MACD histogram suggests bearish momentum is fading.

XRP/USD 4H Chart

A decisive daily close above the $1.51 resistance zone—aligned with the 100-day EMA and broader downtrend—would be needed to shift sentiment and open the path toward $1.74.

On the downside, immediate support lies at $1.39, followed by the monthly open near $1.37.

The post XRP holds above $1.40 as ETF inflows return: Check forecast appeared first on CoinJournal.

XLM stall near key levels as mixed signals keep traders on edge

Key takeaways

  • Stellar price steadies at $0.159, signaling consolidation after recent correction.
  • On-chain and derivatives data for XLM reflect mixed sentiment and lack a clear directional bias.

Stellar’s native token XLM remains under pressure on Tuesday, with muted price action reflecting a broader lack of conviction across altcoins. XLM has stabilized around $0.158 as traders weigh conflicting on-chain and derivatives signals.

On-chain data hints at mild bullish bias

Data from CryptoQuant points to a neutral-to-slightly bullish backdrop for XLM. XLM presents a bullish picture, with buy-side dominance emerging but broader indicators staying largely flat. This combination points to mild bullish pressure, though not strong enough to confirm a clear trend reversal.

Data obtained from CoinGlass highlights a divided market. The long-to-short ratio sits below 1 (0.77 for XLM), indicating that a larger share of traders are positioned for downside. This typically reflects a bearish tilt in sentiment.

However, funding rate data tells a different story. XLM has flipped into positive territory, meaning long traders are paying shorts—often a sign of improving bullish sentiment and growing demand for long exposure.

The divergence between bearish positioning (long/short ratios) and improving funding rates underscores a market stuck in indecision.

Until either bullish momentum strengthens or bearish pressure intensifies, both XRP and XLM are likely to remain range-bound. A confirmed breakout above XRP’s $1.40 resistance or stronger follow-through in XLM could provide the first real directional signal for traders.

Stellar price forecast: XLM remains in consolidation mode

The XLM/USD 4-hour chart is bearish and efficient as XLM is trading at $0.159 on Tuesday, maintaining a bearish near-term bias as it holds beneath the key EMAs.

The 50-day EMA at roughly $0.165, the 100-day EMA near $0.176, and the 200-day EMA around $0.208 all sit overhead as layered resistance, suggesting rallies are likely to be capped while the pair remains below this stack.

The RSI on the daily chart hovers around 43, suggesting subdued demand, while the MACD remains in negative territory, indicating that downside momentum persists despite recent stabilization.

If the rally persists, initial resistance is seen at the 50-day EMA around $0.165, followed by the 100-day EMA near $0.176.

A daily candle close above these levels could see XLM extend its rally towards the 23.6% Fibonacci retracement at $0.201, ahead of the 200-day EMA close to $0.208.

XLM/USD 4H Chart

On the downside, immediate support sits on the nearby intraday pivot around the current price, with stronger support emerging toward the prior trendline break area near $0.139.

A break below this level could see XLM retest the $0.136 support zone in the near to medium term.

The post XLM stall near key levels as mixed signals keep traders on edge appeared first on CoinJournal.

Bitcoin tops $81K as ETF inflows and sentiment recovery signal potential push toward $90K

Key takeaways

  • Bitcoin briefly topped the $81,000 mark on Tuesday, the highest level in three months.
  • Crypto sentiment improves, with inflows into US-listed spot ETFs totaling $154 million last week.

Bitcoin (BTC) is hovering just below the $81,000 mark on Tuesday after adding 1% to its value in the last 24 hours. 

The broader crypto market remains constructive, with Ethereum (ETH) and XRP (Ripple) posting mild gains, reflecting a steady improvement in overall sentiment.

Sentiment improves as capital flows return

Market confidence is gradually recovering, supported by rising inflows into digital asset investment products. The Crypto Fear & Greed Index has climbed to 47 from 29 a day earlier — a sharp rebound, though still within the “fear” zone. Notably, this marks a significant improvement from last month’s average of 11, which signaled extreme fear.

If this upward trend continues, it could reinforce expectations for Bitcoin to reclaim $80,000 as support and potentially grind higher toward the $90,000 level.

Spot Bitcoin ETFs recorded their fifth consecutive week of inflows, adding $154 million through Friday. While this is down from the prior week’s $824 million, the data still highlights sustained investor appetite for crypto exposure — even amid geopolitical tensions such as the ongoing US–Iran situation.

Cumulative ETF inflows now stand at $58.72 billion, with assets under management averaging $103.78 billion, underscoring persistent institutional demand.

Bitcoin’s recent move above $81,000 triggered notable liquidations. Short positions took the largest hit, with approximately $138 million wiped out, compared to around $46 million in long liquidations.

Bitcoin eyes the $90k psychological level

The BTC/USD 4-hour chart is bullish and efficient as Bitcoin is trading above $80,800. While the price has reclaimed this long-term support, it remains capped below the 100-week EMA at $82,352, and the 50-week EMA at $85,777These levels continue to act as key resistance zones, limiting a full bullish breakout for now.

Momentum indicators suggest a market in recovery mode. The RSI on the daily chart sits near 48, close to neutral territory, while the MACD remains positive, signaling improving — but not dominant — bullish momentum.

BTC/USD 4H Chart

If the rally persists, key resistance levels to watch include $82,352 (100-week EMA) and $85,777 (50-week EMA). 

However, if the bears regain control, key support levels would be seen at  $68,061 (200-week EMA) and $65,981 (trendline level). 

A sustained weekly close above the upper resistance band would be needed to confirm a stronger medium-term bullish shift.

The post Bitcoin tops $81K as ETF inflows and sentiment recovery signal potential push toward $90K appeared first on CoinJournal.

AAVE could reclaim $100 as focus shifts to rebuilding rsETH collateral

  • AAVE price consolidates as market awaits recovery clarity.
  • rsETH recovery plan addresses $246M bad debt from the Kelp DAO exploit.
  • The immediate resistance sits at $100 as governance execution drives the outlook.

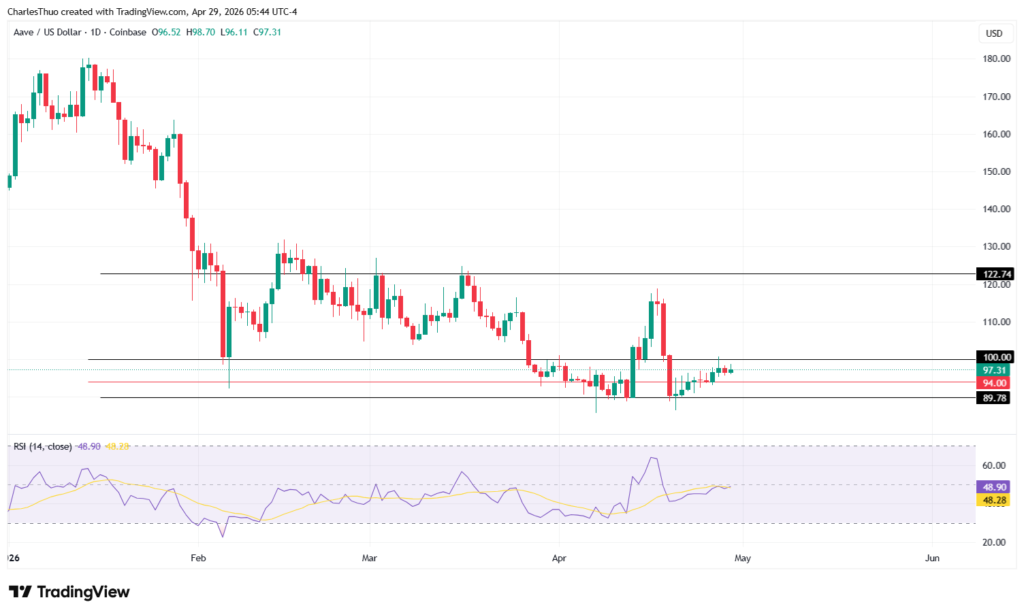
AAVE token is currently priced at $97.13, down 0.3% over the past 24 hours, while the broader market has remained slightly positive.

That difference has kept AAVE in focus, not because of broad weakness, but because traders are waiting to see whether the proposed recovery plan designed to restore rsETH collateral after the Kelp DAO exploit can be executed cleanly.

The key question is whether the recovery effort can remove uncertainty fast enough to allow the token to reclaim the $100 mark and hold above it.

rsETH collateral recovery plan takes centre stage

The main driver behind AAVE’s current setup is the technical plan proposed to rebuild rsETH collateral after the exploit linked to Kelp DAO.

The exploit left about $246 million in bad debt across Aave and Compound, creating pressure for a coordinated solution rather than a simple market fix.

The proposed plan is designed to restore backing for rsETH and reduce the fallout without spreading the losses across users.

At the centre of the proposal is a governance-led process across Ethereum and Arbitrum.

The plan calls for temporary oracle adjustments and the liquidation of the attacker’s positions in a controlled way. That makes the recovery effort more structured, but also more dependent on execution.

Traders are now watching the proposal as a practical test of whether Aave Protocol can repair collateral damage without introducing more risk.

In the short term, that uncertainty has kept sentiment measured, even though the plan itself is aimed at stabilising the system.

AAVE price outlook

AAVE’s near-term outlook now depends heavily on how the recovery plan unfolds.

On a technical standpoint, the immediate support is near $96. The token has already spent time close to that area, and a failure to hold it could shift the market tone back toward caution.

A drop below $94 would be more concerning because it would suggest the market is no longer treating the recovery effort as a near-term stabilising force.

AAVE price analysis
AAVE price chart

The broader technical picture also shows that AAVE is consolidating rather than trending aggressively.

Its current level is close to the 30-day simple moving average of $96.95, which supports the idea that the market is waiting for confirmation before committing to a stronger directional move.

What matters next

Market participants will be looking for approval of the temporary changes needed to support the recovery, as well as signs that collateral restoration is progressing without delays.

If those milestones are reached, AAVE could gain enough confidence to challenge the $100 level again.

Trading volume also shows that the market is engaged but not yet convinced.

The latest 24-hour volume of $254.39 million reflects active participation, but not a broad rush into the token. That usually means the market is waiting for a clearer signal before taking stronger positions.

The post AAVE could reclaim $100 as focus shifts to rebuilding rsETH collateral appeared first on CoinJournal.

Hyperliquid price forecast: HYPE holds above $40 as leverage builds

TL;DR

  • Hyperliquid (HYPE) holds near $42 with a bullish structure above $40.
  • The bullish structure is supported by rising futures Open Interest and positive funding rates. 

Hyperliquid (HYPE) trades above $42 on Monday, sustaining its upward trajectory from an ascending trendline. 

While the broader trend remains constructive, signs of cooling retail interest contrast with a steady buildup in leveraged positions, creating a mixed near-term outlook for the decentralized exchange token.

Retail momentum fades as social dominance drops

Retail-driven momentum appears to be weakening. Data from Santiment shows Hyperliquid’s social dominance has declined sharply to 0.137%, down from 0.688% at the height of the US-Iran conflict in late March. 

The drop suggests reduced retail attention as geopolitical tensions ease, removing a key narrative driver that previously fueled speculative interest in the DEX.

In contrast, derivatives activity is heating up. According to CoinGlass, HYPE futures Open Interest (OI) has climbed roughly 3% over the past 24 hours to $1.65 billion, signaling an increase in outstanding leveraged positions.

Funding rates remain positive at 0.0077%, indicating that long positions continue to dominate. This persistent positive funding over the past month reflects growing bullish conviction among leveraged traders, even as spot-driven retail enthusiasm cools.

HYPE price outlook: Rising wedge puts $40 support in focus

The HYPE/USD 4-hour chart is bullish and efficient as HYPE is consolidating within a rising wedge.

The token remains supported above both its 50-day EMA at $38.98 and 200-day EMA at $34.90, reinforcing the underlying bullish structure.

Momentum indicators suggest steady but controlled upside. The Relative Strength Index (RSI) sits at 56, pointing to positive but not overbought conditions, while the MACD is trending higher toward a bullish crossover, hinting at fading downside pressure.

If the bulls push higher, they would encounter immediate resistance at the $43.71 level, which caps the current recovery and aligns with the upper wedge boundary near $46.80. A decisive break above this zone could trigger a stronger bullish continuation.

However, if the market undergoes a correction, the ascending trendline support near $41.21 remains critical. 

HYPE/USD 4H Chart

A breakdown below this level would likely expose the 50-day EMA at $38.98, with the 200-day EMA at $34.90 acting as a deeper demand zone if selling pressure intensifies.

While Hyperliquid’s structure remains bullish above $40, the divergence between fading retail interest and rising leverage suggests the next move could be determined by whether momentum expands or reduces.

The post Hyperliquid price forecast: HYPE holds above $40 as leverage builds appeared first on CoinJournal.