Waves (WAVES/USD) is down 81% from all-time highs ($42.7), currently trading at $9.13

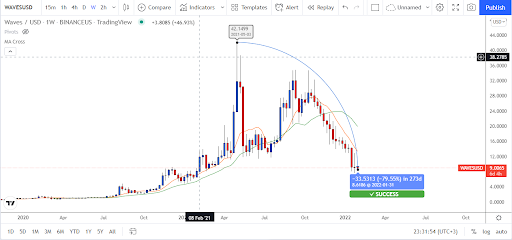
  • The price of WAVES has been spiraling down without a halt.

  • WAVES is seeing slight resistance at $10.3.

  • WAVES/USD is currently trading at $9.13. 

Source – TradingView

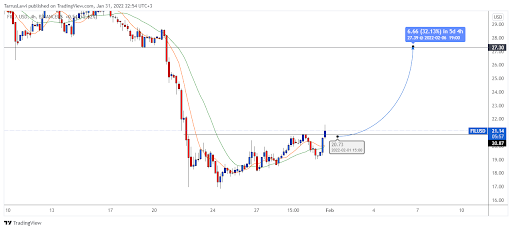
The Waves pricing shows a strong bearish trend, with bears dominating the price charts for the majority of the months since October. After being rejected at $10.3 on January 27th, the price levels have sharply plummeted, and the coin value has dropped to the $9 zone. The collapse had an effect, and the bearish trend has persisted today.

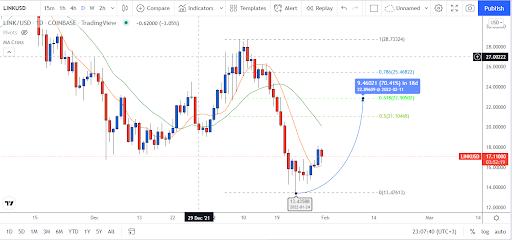
WAVES/USD one-day price chart: bulls advanced to $12.8 resistance level

Over the weekend Waves price evaluation indicated a negative trend, and the price has dropped to $8.55 today. The previous week’s price chart was characterized by red candlesticks, indicating that bears were continually pushing the price to fall; however, bulls also made strong gains on January 26th, taking the price point to $12.8. Since then, bears have been impeding upward price trends, but today, the bears have gained a little profit as the price is currently locked in the $9.15region.

The MA is trading at $9.55, barely under the price point, while also remaining below the SMA50 curve, indicating a negative trend. Conversely, if we look at the 9 days Simple Moving Average signals, the resistance is at $16, indicating the highest volume pressure is at that level.

The four-hour Waves pricing assessment reveals that the bulls dominated the price component for most of today’s trading period, but bears triggered a sharp price drop today, following a continuous bullish lead. Despite the negative momentum being low, it has outperformed the bullish momentum and made the daily candlestick bearish. Yet, the value has been seen to be rising during the previous eight hours.

The post Waves (WAVES/USD) is down 81% from all-time highs ($42.7), currently trading at $9.13 appeared first on Coin Journal.

Decentraland (MANA) vs The Sandbox (SAND) – Which one is a better investment?

 If you are looking for the two biggest metaverse and play-to-earn platforms, then it’s got to be Decentraland and The Sandbox. But which one is a better investment? Both are created on the Ethereum network.

 Decentraland was developed in 2017 by Esteban Ordano and Ariel Meilich as a virtual platform for creating and monetizing applications and content. It is powered by three assets- MANA, LAND, and WEAR. It is the first blockchain metaverse that is run by a DAO. CoinFund, FBG Capital, and Digital Currency Group are some of with notable investors asides from the partnerships they have with Samsung, Polygon, and Cyberpunk among others.

 The Sandbox metaverse was released to the public in November 2021 under Arthur Madrid and Sebastien Borgat. It has four tokens- SAND, LAND, ASSET, and GAMES. It is backed by one of the largest investment companies, SoftBank. It aims to make blockchain gaming popular.

 While MANA is an ERC-20 token that must be burnt to purchase LAND on Decentraland, SAND is a utility token used to perform transactions on The Sandbox. Both work on the proof-of-stake consensus method. Although The Sandbox has plans to establish a DAO where SAND serves as a governance token, it is yet to be implemented.

 Decentraland has 90,601 plots of land, while The Sandbox has over 160,000 parcels of land. While LANDs are ERC-721 standard, The Sandbox also uses ERC-1155. LANDs can form individual plots, estates, and districts in both metaverses except for plazas which only exist on Decentraland.

 SAND is selling for $4.07 right now with a market cap of $3.7 billion, while MANA costs $2.55 now with a market cap of $3.86 billion. Although this implies that people are investing in MANA over SAND, Decentraland is less of a gaming platform than The Sandbox. This might push people to The Sandbox in the long run. Also, Decentraland is decentralized but this will change when The Sandbox implements its DAO.

 In November 2021, both tokens peaked at $8.40 and $5.85, respectively before settling at their present prices. While they are both similar in almost every respect, SAND is the better investment in the long run. If you are invested in metaverses and play-to-earn, then get yourself some SAND. However, if you are an investor, do proper research and deal wisely.

The post Decentraland (MANA) vs The Sandbox (SAND) – Which one is a better investment? appeared first on Coin Journal.

TerraUSD (UST) vs Dai (DAI) – Which one is a better investment?

 UST and DAI are two stablecoins backed by other cryptocurrencies. Unlike other stablecoins, they are decentralized. Stablecoins are cryptocurrencies that maintain a stable price by being tied to another asset; crypto or fiat. They are less volatile than other cryptocurrencies.

 DAI was launched in 2017 by MakerDAO and was built on the Ethereum blockchain. It has the stability of a stablecoin and is as secure as the Ethereum platform. Its stability is maintained by collateralizing it with ETH in a smart contract algorithm. It helps secure and power the Maker network on which it is generated and traded.

 UST was launched in September 2020 by Terraform Labs. It is stabilized with the aid of a smart contract algorithm and an elastic money supply mechanism. New USTs are minted through a process called seigniorage. It is collateralized by LUNA- Terra’s native coin.

 Both stablecoins are decentralized as they have no central authority like the other popular stablecoins. Similarly, they are pegged to cryptocurrencies rather than fiat currencies. They use smart contract algorithms to maintain stable prices.

 In minting DAI, the collateral (ETH) must be way more than the amount of DAI to be minted. UST, on the other hand, needs an equivalent of LUNA in USD to mint the same amount. In doing this, a percentage of the LUNA is burnt, and another is reserved for the community treasury. The more UST is demanded, the more the appropriate amount of LUNA is burnt.

 The smart contract algorithm used for stabilizing UST can generate UST and maintain itself. However, high volatility with ETH can affect the stability of DAI. Also, the market caps and trading volumes of these assets indicate that UST is adopted over DAI.

 This might be due to UST’s arbitrage system that helps it automatically maintain supply when it is below peg. Right now, the Anchor protocol has made it possible to earn an APY of about 20% when UST is lent out. If you are looking to invest in a decentralized stablecoin, UST is the better investment.

 In the crypto space, everything is volatile no matter how stable it seems. Thus, deal wisely and do your research. Don’t invest beyond what you can’t afford to lose.

The post TerraUSD (UST) vs Dai (DAI) – Which one is a better investment? appeared first on Coin Journal.

LINK/USD value rose to a high of $18.05, as the recent bullish trend persists

  • At $18.05, there was resistance.

  • At $15.5, the LINK/USD pair found strong support.

The Chainlink price research shows that bulls have been ready to withstand the negative wave, which is good for cryptocurrencies. The currency had tremendous depreciation over the current month, but prices are steadily increasing, and they are predicted to reach beyond their current price level of $17 in the near term. 

However, the next barrier is still at $18.6, which explains why the price oscillation is moderate today. However, if the bullish trend continues in the following 24 hours, the resistance level may be exceeded, and LINK may have a smooth rally to $20, which is the next key level. 

The bulls maintain their advantage, overcoming the bearish impediment

According to the most recent updates, the one-day price chart for the Chainlink price review reveals that cryptocurrency prices have grown today, with negative pressure also visible. The price had hit $18.053, up 10.36 percent on Sunday. The chart also illustrates that the bulls attempted to make a comeback in recent days and have now regained control as bulls today have held prices above prior low. 

Source – TradingView

The four-hour Chainlink price analysis shows that the bullish trend is regaining control. The last few hours have been quite advantageous for the bulls, with the short-term moving line displaying more green candlesticks, surpassing the impediment created by the bears in earlier hours of the day.

The post LINK/USD value rose to a high of $18.05, as the recent bullish trend persists appeared first on Coin Journal.

FIL/USD has a potential to gain 30% if bullish momentum is sustained

  • Filecoin price analysis turns optimistic.

  • At $19.2, there is support for FIL.

  • At $21.9, there is some resistance.

The most recent Filecoin price analysis indicates a positive trend, as the price has increased significantly today. Yesterday, the value of FIL peaked at $19.6 after breaking over the barrier of $19.3, and today, the bullish upswing has led to a further gain in the price, with its value increasing to $20.3, hitting a weekly high. At the start of today’s trading session, the price breakout was higher, as bulls managed to maintain their advantage. Prices are projected to rise much more in the following hours.

The upward trend in the FIL/USD 1-day price chart continues over $20

The one-day Filecoin value analysis reveals that today’s price function is still moving higher. The price has risen, and the coin is now worth $20.3. Although these price fluctuations are minor, the cryptocurrency has acquired a valuation of 5.60 percent in the previous 24 hours. The crypto combination has earned a value of 8.80 percent in the last week; perhaps, the price will rise more during the day. 

The FIL/USD has been able to hold the price level during this week, as the persistent downward trajectory appears to be drawing to a halt.

Source – TradingView

Even though the bulls had previously dominated the market movements, the bears hampered the price function, and a reversal was also witnessed four hours ago. However, the price is presently filling the range again, as it trades around the upper threshold of the volatility indicator.

As a consequence of the recent positive movement, the price is presently at $20.3.

The current moving average value is $19.7. Volatility is minimal, suggesting that an upswing is imminent. The Bollinger Bands Indicator’s upper limit is $20.55, signaling resistance for FIL’s price, while its lower limit is $18.1.

The post FIL/USD has a potential to gain 30% if bullish momentum is sustained appeared first on Coin Journal.