Watch $0.2 support as Fantom retraces amid consolidation

  • Fantom has dipped 4.71% in the past day and 23.51% in the past week

  • The token is currently retracing within a consolidation 

  • A dip below the support could open more sell trades

Fantom FTM/USD has been adversely affected by the bearish correction in cryptos. The token is down 4.71% in the past day, with weekly losses at 23.51%. Currently, FTM is trading at $0.2905. Despite the negative trend, Fantom is one of Ethereum’s rivals with strong fundamentals.

Fantom is a highly scalable independent decentralized project. The blockchain is suitable for decentralized applications and cryptocurrencies. With its lower transaction fees and Fantom Opera’s high throughput, it is one of the fast-paced blockchains.

DeFi users, enterprise apps, and Ethereum virtual Machine developers are currently flocking the network. FTM, which powers staking and governance functions, is yet to reap the gains of the network’s growth. The token has remained at the center of crypto volatility. 

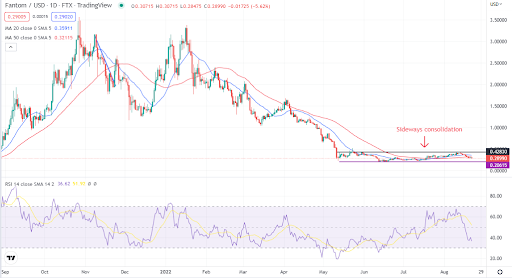
FTM has lost a whopping 91% from its highest point year to date. The short-term technical outlook shows consolidation amid a weak momentum.

FTM consolidates sideways in a bearish market
Source: TradingView

According to the daily chart, FTM has been locked in a consolidation pattern. The token has been trading between $0.2 and $0.42 price levels. The pattern has been maintained for about four months.

Currently, FTM is on a retracement amid a bearish momentum. The 20-day and 50-day moving averages offer resistance to the upside. The two averages are possible points of consolidation or resistance in the case of a trend reversal.

The RSI is currently at 36, the lowest level since June. Despite the indicator approaching the oversold zone, FTM should overcome the $0.42 resistance level to become bullish. If the reverse happens, the token could retest lower levels.

Concluding thoughts

FTM faces a strong bearish momentum, with more than 23% weekly losses. The token has remained in consolidation for longer. The token could trade lower if the $0.2 support level fails to hold.

The post Watch $0.2 support as Fantom retraces amid consolidation appeared first on CoinJournal.

Is Ethereum Classic losing the technical battle at $34?

  • Ethereum Classic is trading slightly below key support of $34

  • The token is expected to benefit from the Ethereum merge; however, disputed

  • Ethereum Classic could head to $26 next if it loses the $34 technical battle

Ethereum merge euphorbia seems to be now fading. As the September 15 date fast approaches, Ethereum and hard fork Ethereum Classic ETC/USD are falling. That, of course, is not to mean that the hard fork will not have a bullish impact on price. If speculations are to be believed, Ethereum’s price will hit $5,000 after a successful merge. Its hard fork, Ethereum Classic, is expected to surge too on the influx of PoW to the protocol. The idea is still disputed if, indeed, Ethereum Classic will benefit. ETC gains have been direct as a result of expectations. 

It is too early to speculate that ETC will benefit from Ethereum Merge. However, speculations will remain as cryptocurrencies are known to benefit from them, if positive. Thus, we cannot underestimate how much ETC could surge in the 3 weeks to the merge. We still urge caution as the technical indicators are currently not pricing to a potential merge rally.

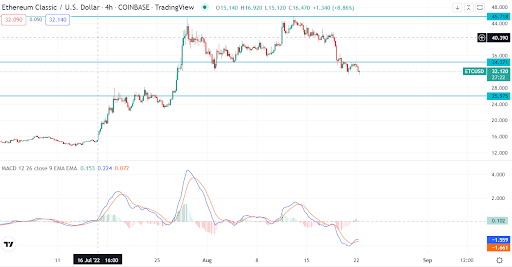
Ethereum Classic could retest $26 as the price remain bearish

Source – TradingView

Ethereum Classic trades at $32. The price below key support at $34 indicates bear momentum. Using a short time frame of 4 hours, we can see that the MACD line has moved above the moving average. That suggests a short-term price appreciation. The momentum indicator still remains in bear territory. 

Concluding thoughts

Potential price discovery is expected to push Ethereum Classic to $34. However, the token will remain bearish if the price fails to break past $34. A price rejection will see bears take control, with ETC potentially crashing to $26.

The post Is Ethereum Classic losing the technical battle at $34? appeared first on CoinJournal.

Cardano retests key support amid bearish sentiment and testnet concerns

  • ADA has dipped 3% in the past day.

  • Reports of a bug in one of Cardano’s testnets likely to delay Vasil upgrade.

  • Technical indicators are looking bearish below the $0.56 resistance level.

Cardano’s ADA/USD has dropped 3% in the past day, increasing weekly losses to 19%. Its market capitalization is down to $15,218,450,837 with lower trading volumes. ADA trading volumes reduced by 8% to slightly above $650 million in the past day.

The bearish momentum in Cardano is partly linked to the ongoing crypto market correction. Aside from the correction, an important fundamental aspect has shaken the smart contract blockchain. A bug reported in its testnet could delay the anticipated Vasil hard fork.

Cardano’s founder Charles Hoskinson has refuted the claims, which termed the testnet ‘catastrophically broken’. Hoskinson said that the bug had already been solved in a previous update and was not a major issue. He maintains that the concerns could unnecessarily delay the hard fork.

Vasil upgrade is expected to introduce major updates on Cardano. Some benefits include enhanced throughput speed and reduced latency of block transmission. However, there have been multiple delays, with the latest being in July. The delays are causing a subdued performance in ADA, as shown in the daily chart below.

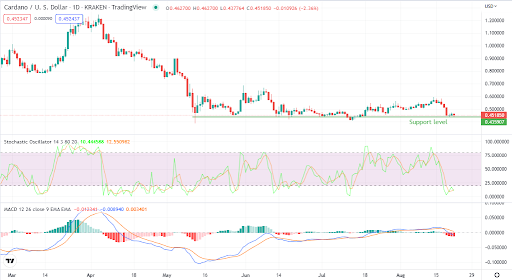
ADA retests $0.4 support

Source: TradingView

According to the technical chart above, ADA has retested the $0.43 support level. The level has been retested several times since mid-May. Overall, the token has remained subdued at under $0.56 for the past three months.

The technical indicators are not looking bullish either. MACD histograms are red, with the trend following lines crossing close to the neutral point. The Stochastic Oscillator is at the lowest point since July 13.

At 11, the momentum indicator is at the oversold zone and could be due for a bounce back. However, with the momentum being bearish, the token must flip $0.56 to welcome any bullish sentiment.

Concluding thoughts

ADA has retested a key support level. The technical and fundamentals are pointing to more bearish pressure. A bullish momentum can only be possible past the $0.56 resistance.

The post Cardano retests key support amid bearish sentiment and testnet concerns appeared first on CoinJournal.

Should you buy Sandbox SAND at the $1.03 support?

  • Sandbox failed a break out at $1.3 and has retraced to a support

  • Price weakness emanates from the general crypto mood and lack of Sandbox developments

  • SAND remains vulnerable unless potential price catalysts come up

Sandbox token SAND/USD looked likely to take new heights as the price hovered around $1.3. Price consolidated at the resistance level for weeks, but neither bulls nor bears seemed to win the battle. Since most other cryptocurrencies were surging, that gave hope that bulls would eventually triumph. Bears seem to have taken control as the price has dipped to $1.03. That is a potential demand zone but will buyers push the token higher?

Sandbox does not look promising at the current level. First, Sandbox has depended on the momentum of the crypto sector lately. The momentum is currently weak. Before the sentiment improves, SAND could weaken further. Secondly, projects building on the metaverse has slowed lately. Although a great opportunity exists for the metaverse sector, investors are interested in current developments. The lack of clear fundamentals from the metaverse sector could be a blow to the short-term recoveries of SAND.

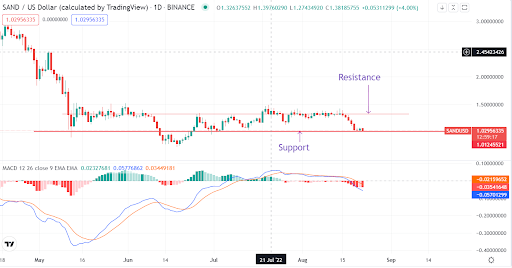
Sandbox token slides to $1.03 support in a bear market

Source – TradingView

Technically, Sandbox is bearish. The momentum indicator shows that the price is extremely bearish at the key support of $1.03. No price action to show that the price is about to recover at the support. Consequently, SAND is vulnerable if momentum fails to improve quickly. Investors should not buy the token at the support but should watch price action and general sector mood. If SAND loses the $1.03 support, the token could slide to $0.85.

Summary

Sandbox token remains vulnerable at the $1.03 support. The lack of clear fundamentals and momentum is a catalyst for further bear weakness.

The post Should you buy Sandbox SAND at the $1.03 support? appeared first on CoinJournal.

Shiba Inu retraces back to breakout support – Will price rebound?

  • Shiba Inu token rallied to $0.000017 as risk-on sentiment entered markets

  • The token trades at support after losing grip of previous gains 

  • Crypto sentiment remains weak, but Shiba Inu could take a u-turn to the upside 

Whether Shiba Inu SHIB/USD has returned to the bear market is a question hard to answer. However, one sure thing is that Shiba Inu maintains key technical levels. Buyers could be about to take it higher after the latest slowdown. 

Shiba Inu is one of the cryptocurrencies that returned massively recently at the height of meme-rally. However, the token is back to the drawing board, with losses in the last seven days climbing to 17%. Most other cryptocurrencies are already in the red indicating widespread corrections. 

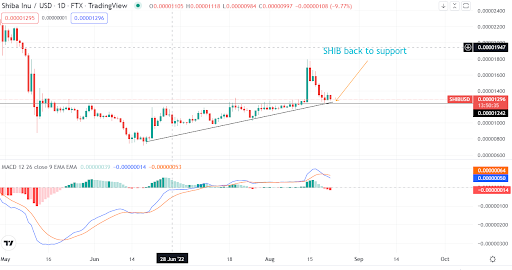
Shiba Inu falls back to support zone as meme rally ends

Source – TradingView

The current SHIB price coincides with support at $0.00001242. That is the level at the price broke and became bullish at the back of the renewed meme-token rally. We can see that the price shows some indecision after the latest losses. Bulls are rejecting the downward pressure, a major indicator that demand is strong for the meme token. 

The momentum indicator is showing a bearish price move. We remain optimistic that if SHIB maintains the support zone, the MACD indicator could turn bullish.

Concluding thoughts

While crypto sentiment remains weak, SHIB has maintained key support. The bear pressure is weakening as the price shows indecision at $0.00001242. A potential recovery is possible if the price maintains its level. Investors should watch price action and consider trades if sentiment improves.

If SHIB loses grip of the support, bears will take control. That could see the price trade back to $0.000010. The next days’ price action will dictate the potential direction for SHIB.

The post Shiba Inu retraces back to breakout support – Will price rebound? appeared first on CoinJournal.