Litecoin (LTC) price sell-off to continue until this happens

Litecoin price is in a consolidation phase as investors wait for the next key catalyst. It is trading at $51.87, which is about 28% above the lowest level in June. Its market cap currently stands at $3.67 billion, making it the 21st biggest cryptocurrency in the world. At its peak, LTC was among the biggest coins globally.

Why has LTC crashed?

Litecoin is a leading cryptocurrency that was created to address the challenges that bitcoin has as a medium of exchange. For example, Litecoin has a bigger supply cap than BTC. It is also significantly faster and its transactions are much cheaper.

LTC has a close correlation to bitcoin. Therefore, the factors that have pushed BTC to $20,000 are the same ones that have caused litecoin to plummet. 

First, there is the issue of the Federal Reserve. In a bid to cushion the American economy from the pandemic, the Fed decided to lower interest rates to a record low. It also implemented quantitative easing (QE), which involved printing trillions of dollars in cash.

Learn more on how to invest in cryptocurrencies.

As a result, these actins pushed bond yields at record low and riskier assets at record highs. Stocks and cryptocurrencies surged. Now, the Fed is doing the opposite. The bank has started hiking interest rates and implementing quantitative tightening (QT). Therefore, investors are abandoning riskier assets like litecoin and bitcoin.

Second, on-chain data shows that activity in litecoin’s ecosystem has declined sharply in the past few months. This means that very few people are holding and using litecoin for transactions. 

Finally, the recent happenings in the crypto industry has led to weaker demand for LTC. Some of the most important events are the collapse of Voyager Digital, Celsius, Vauld, and BlockFi. Most investors have exited their crypto investments as they avoid being caught in such a situation.

Litecoin price prediction

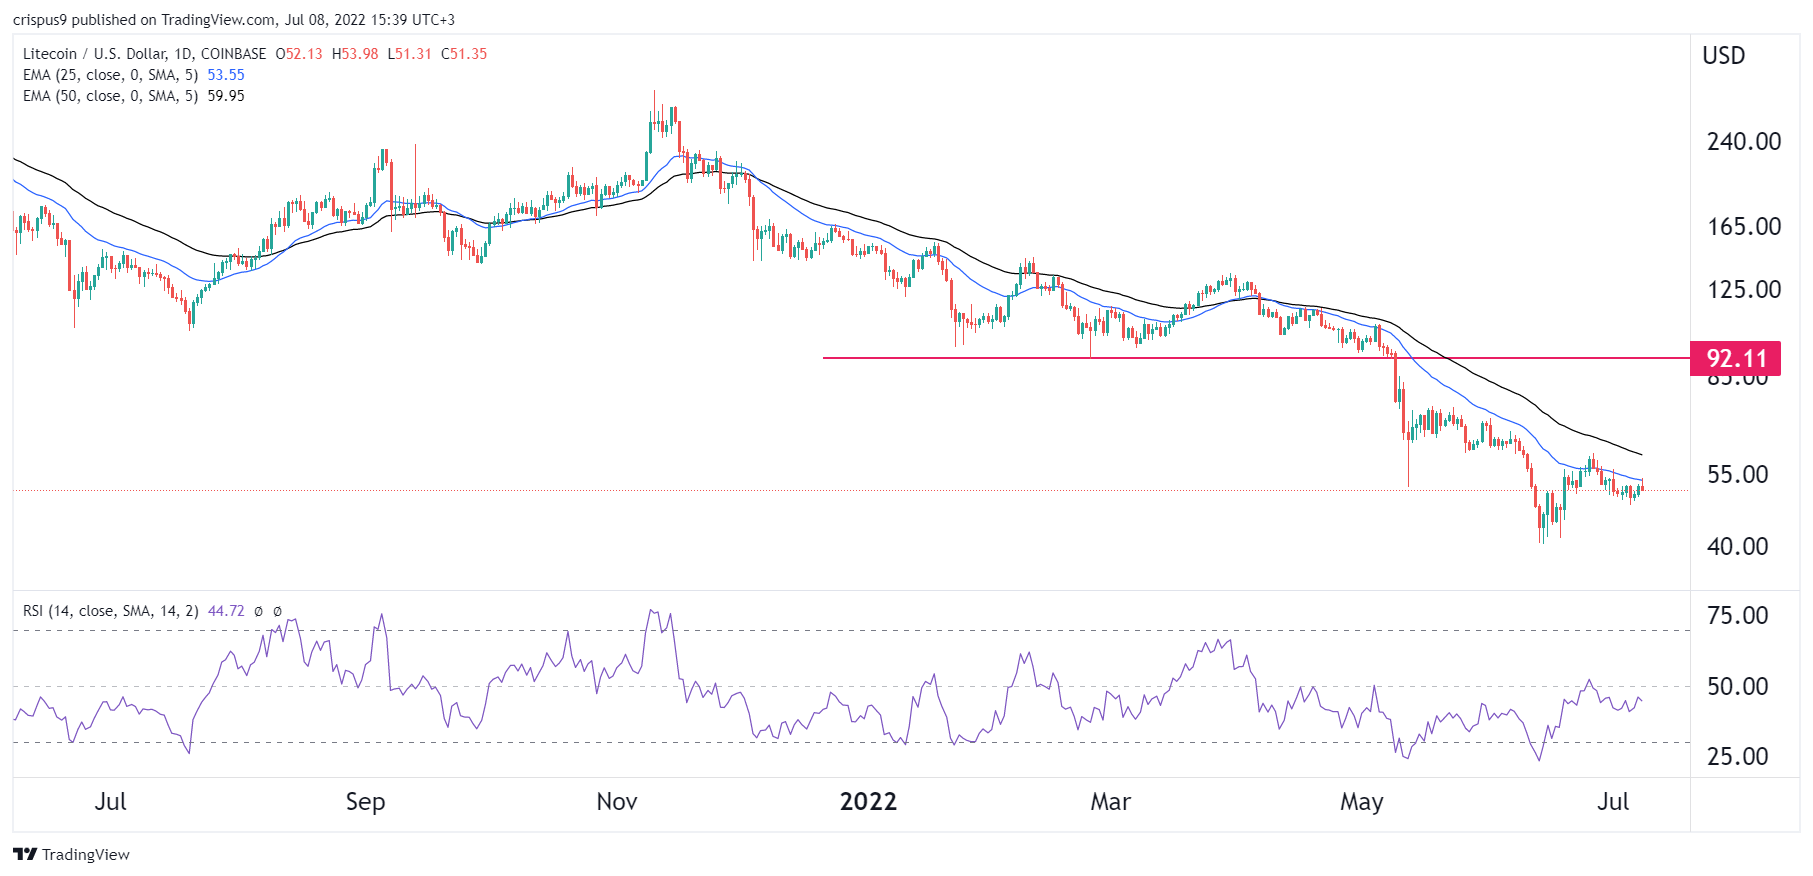
The daily chart shows that the LTC price has been in a strong bearish trend in the past few months. The coin managed to cross several important support levels like $92.11 and $100 during this sell-off. It remains below the 25-day and 50-day moving averages while the Relative Strength Index (RSI) is at the neutral point at 50.

Therefore, litecoin will continue in the downward trend as long as it is below the two moving averages. Until this happens, the LTC will likely retest the support at $40.

The post Litecoin (LTC) price sell-off to continue until this happens appeared first on CoinJournal.
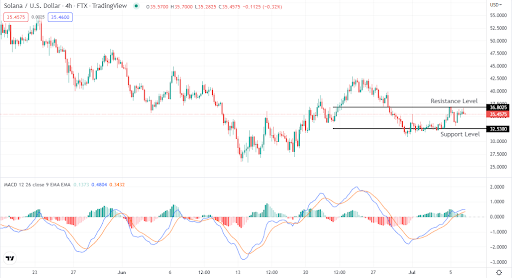
Why is AAVE rallying by more than 15% today?

It has been a positive week for the cryptocurrency market so far, with the prices of most coins up by over 10% in the last seven days 

The cryptocurrency market has been performing well since the start of the week. Over the past 24 hours, the total market cap has increased by more than 5%, pushing the total market cap close to the $1 trillion mark. 

Bitcoin is trading above $22k once again after adding more than 7% to its value in the last 24 hours. Ether, the second-largest cryptocurrency by market cap looks poised to surge past the $1,300 resistance level after adding 6.8% to its value during the same period.

However, AAVE is one of the best performers amongst the top 50 cryptocurrencies by market cap. AAVE has added more than 15% to its value in the last 24 hours, outperforming the other major coins in the process. 

The rally comes as the Aave team proposed the launch of a new stablecoin pegged to the US Dollar to its community. 

Aave Companies is proposing to the DAO the introduction of a native decentralized, collateral-backed stablecoin, GHO, pegged to USD. GHO can be launched on the Aave Protocol, allowing users to mint GHO against their supplied collaterals.

Key levels to watch

The AAVE/USD 4-hour chart is bullish as Aave has been performing well over the past few hours.

The MACD line is above the neutral zone, indicating bullish momentum for the cryptocurrency. The 14-day RSI of 70 shows that AAVE could soon enter the overbought region if the rally is sustained.

At press time, AAVE is trading at $71.63. The token could move past the $79 resistance level over the coming hours. AAVE could target the $98 resistance level for the first time this month if the market momentum is maintained over the next few days.

The post Why is AAVE rallying by more than 15% today? appeared first on CoinJournal.

Here is why MATIC is soaring by more than 13% today

Polygon Logo on a mobile phone screen

The broader cryptocurrency market has had an excellent week so far and could record further gains in the coming hours and days.

The cryptocurrency market has been performing well since the start of the week. Over the past 24 hours, the total market cap has increased by more than 5% and currently stands at $970 billion.

If the market momentum is maintained, the total market cap could soon reach the $1 trillion mark for the first time in nearly a month.

Bitcoin is trading above $22k once again after adding more than 7% to its value in the last 24 hours. Ether looks poised to surge past the $1,300 resistance level after adding 6.8% to its value during the same period.

However, MATIC, the native token of the Polygon blockchain, is the best performer amongst the top 20 cryptocurrencies by market cap. MATIC is up by more than 13% in the last 24 hours and 22% in the past seven days.

MATIC’s rally can be attributed to Reddit’s announcement that it would launch an NFT avatar marketplace on the Polygon blockchain. The new NFT-based avatar marketplace will allow Reddit users to purchase blockchain-based profile pictures for a fixed rate, the company added.

Key levels to watch

The MATIC/USD 4-hour chart is bullish as Polygon has been performing well over the past few days.

The MACD line crossed into the positive zone a few days ago and has remained there are MATIC outperformed the broader cryptocurrency market. The 14-day RSI of 76 shows that MATIC could soon enter the overbought region if the coin maintains its current momentum.

At press time, MATIC is trading at $0.6095. If the rally continues, MATIC could surge past the $0.64 resistance level for the first time since June. 

The weekend will be an interesting one for the market as a sustained positive performance could see MATIC rally towards the $0.70 psychological level. 

The post Here is why MATIC is soaring by more than 13% today appeared first on CoinJournal.

Bitcoin cash (BCH) price has plummeted by 97% from ATH. Buy the dip?

The bitcoin cash price collapsed to the lowest level since February 2019 as demand for the coin crashed. BCH is trading at $108.47, which is about 97% below the highest level in 2021. As a result, the coin’s market cap has crashed to about $2 billion, making it the 32nd biggest cryptocurrency in the world.

BCH and BTC correlation

Bitcoin cash is a leading cryptocurrency that was born from a hard fork of the main Bitcoin. As such, the two coins have a similar role in that they are widely used to make online transactions. 

For a long time, BCH and BTC had a close correlation because of their wide spread. At the time, Bitcoin Cash used to rise whenever BTC jumped and vice versa. In most cases, investors used to buy the cheaper BCH when Bitcoin rose. 

In the past few months, however, this correlation has eased a bit. For example, in November when Bitcoin soared to an all-time high of almost $70,000, Bitcoin was about 62% below its all-time high. Today, while BCH is approaching its all-time low, Bitcoin is still substantially higher than its record low.

The disconnect between BCH and BTC is mostly because the number of people using bitcoin cash on a regular basis has collapsed. A quick look at on-chain data shows that the amount of BCH transacted every day started falling in 2021. 

Learn more about how to buy bitcoin with PayPal.

The bitcoin cash price has also collapsed because of macro factors. For example, there is the lingering fear of a recession in the United States as the Fed hikes interest rates. Recent data shows that key sectors of the economy are falling. For example, retail sales, services, and manufacturing have all declined.

At the same time, the Federal Reserve has started hiking interest rates. It has hiked by 150 basis points and hinted that it will deliver more increases in the coming months.

Bitcoin Cash price prediction

The daily chart shows that the BCH price has been in a strong bearish trend in the past few months. It has crashed 13 days straight and is approaching its lowest level on record. The coin has fallen below the 25-day and 50-day moving averages while the Relative Strength Index (RSI) has moved to the oversold level of 26.

Therefore, at this stage, there are no signs that bitcoin cash price is close to its bottom. As such, the coin could continue falling as bears target the all-time low of $53.

The post Bitcoin cash (BCH) price has plummeted by 97% from ATH. Buy the dip? appeared first on CoinJournal.

SOL price outlook following bearish sentiment in cryptos

  • Solana’s SOL token plunges 79% YTD

  • Token affected by network outages and overall bearish market

  • SOL faces resistance at $36

Solana is an open-source blockchain project aimed at supporting decentralized applications. The network uses a hybrid consensus model comprising the proof-of-history and proof-of-stake algorithm.

Founded in 2017 by Anatoly Yakovenko and Greg Fitzgerald, Solana has been keen on making its transactions scalable and low-cost. Its developers cited the slow transactions in PoW networks and how its timestamp technology could solve the drawbacks.

Solana’s popularity surged in 2021 when it was poised to be the ‘Ethereum killer.’ However, the blockchain now seems to be a shadow of itself. Aside from the crypto crash in the first half of 2022, Solana has suffered numerous network outages. The challenges have shaken the confidence of its community driving value downwards.

SOL drops 79% year-to-date 

According to the year-to-date price outlook, Solana has plunged 79% since trading at $173. The sell-off has also seen the token tank 86% since peaking at $258 in 2021, according to data from CoinMarketCap. SOL’s market capitalization has then decreased from $77 billion to $12 billion.

Solana’s total value locked is currently at $2.61 billion at #5 behind Ethereum, BSC, Tron, and Avalanche as per Defi Llama. Ethereum and BSC have $47.43 billion and $6.23 billion in TVL, while Tron and Avalanche have $5.3 billion and $2.7 billion, respectively.

SOL meets resistance at $36 (4-hour chart) 

Source: TradingView

From the 4-hour chart above, SOL has found resistance at $36. The token is, however, showing some bullish momentum having moved from $32. The MACD indicator is also bullish. The latest data from CoinMarketCap shows that SOL is currently trading at $35.79, after a surge of 5.81% in the past day and a jump of $2.93% in the past week.

Summary

Although Solana seems to be losing popularity, traders can still benefit from the short-term gains. The recent network outages and the overall bearish sentiment are some factors affecting SOL price. A surge above the $35 resistance can usher in some bullish momentum, and the $42 will be the next resistance to watch.

The post SOL price outlook following bearish sentiment in cryptos appeared first on CoinJournal.