Sweatcoin price prediction ahead of the SWEAT launch

Sweatcoin is the fastest growing fitness project in the world with over 113 million users globally. It is a move-to-earn (MTE) platform that has a close resemblance to StepN, the well-known platform on Solana’s ecosystem. In September, Sweatcoin will launch its SWEAT cryptocurrency that is believed to be the biggest launches this year. So, in this SWEAT price prediction, we will assess whether the coin is a good buy.

What is Sweatcoin?

Sweatcoin is a leading application that is at the intersection of two leading industries: fitness and blockchain. The platform is a mobile application that can be installed in both Android and iOS smartphones. 

Sweatcoin rewards users for making basic exercises like walking and running. It is an accurate platform because it uses the inbuit GPS that is in a person’s phone. Users are then rewarded using the SWEAT token, which exists in its ecosystem.

Sweatcoin has had a lot of success in the past few months. According to its website, it now has over 113 million users and is the number one fitness application in most countries, including the US and the UK. The company has raised millions of dollars from venture capital companies.

What is the SWEAT crypto?

Presently, SWEAT coins that users earn in the ecosystem have no value in the real world. As a result, the developers partnered with NEAR Protocol to launch a new cryptocurrency based on those tokens. 

After months of developments, the SWEAT crypto coin will be launched on September 13th of this year. As a result, existing holders will be awarded fresh new tokens that they can sell in listing cryptocurrency exchanges. People can also decide to hold their tokens and generate returns through staking. 

After the launch, the developers hope to expand the network in various ways. For example, in their second phase, they will launch SWEAT NFTs and a DAo.

SWEAT price prediction

At this point, it is not possible to conduct a SWEAT price prediction since the coin has not been launched yet. Still, we believe that the coin’s price will dip initially as existing holders cash out for fiat currency. If this happens, the sell-off could be brutal as supply will exceed demand.

In the long-term, however, the coin will likely bounce back because of its strong user adoption and brand knowledge. Therefore, for people without SWEAT coins, it will be wise to wait before you buy.

The post Sweatcoin price prediction ahead of the SWEAT launch appeared first on CoinJournal.

Anchor Protocol (ANC) Price Soars as Terra’s LUNC and USTC Rebound

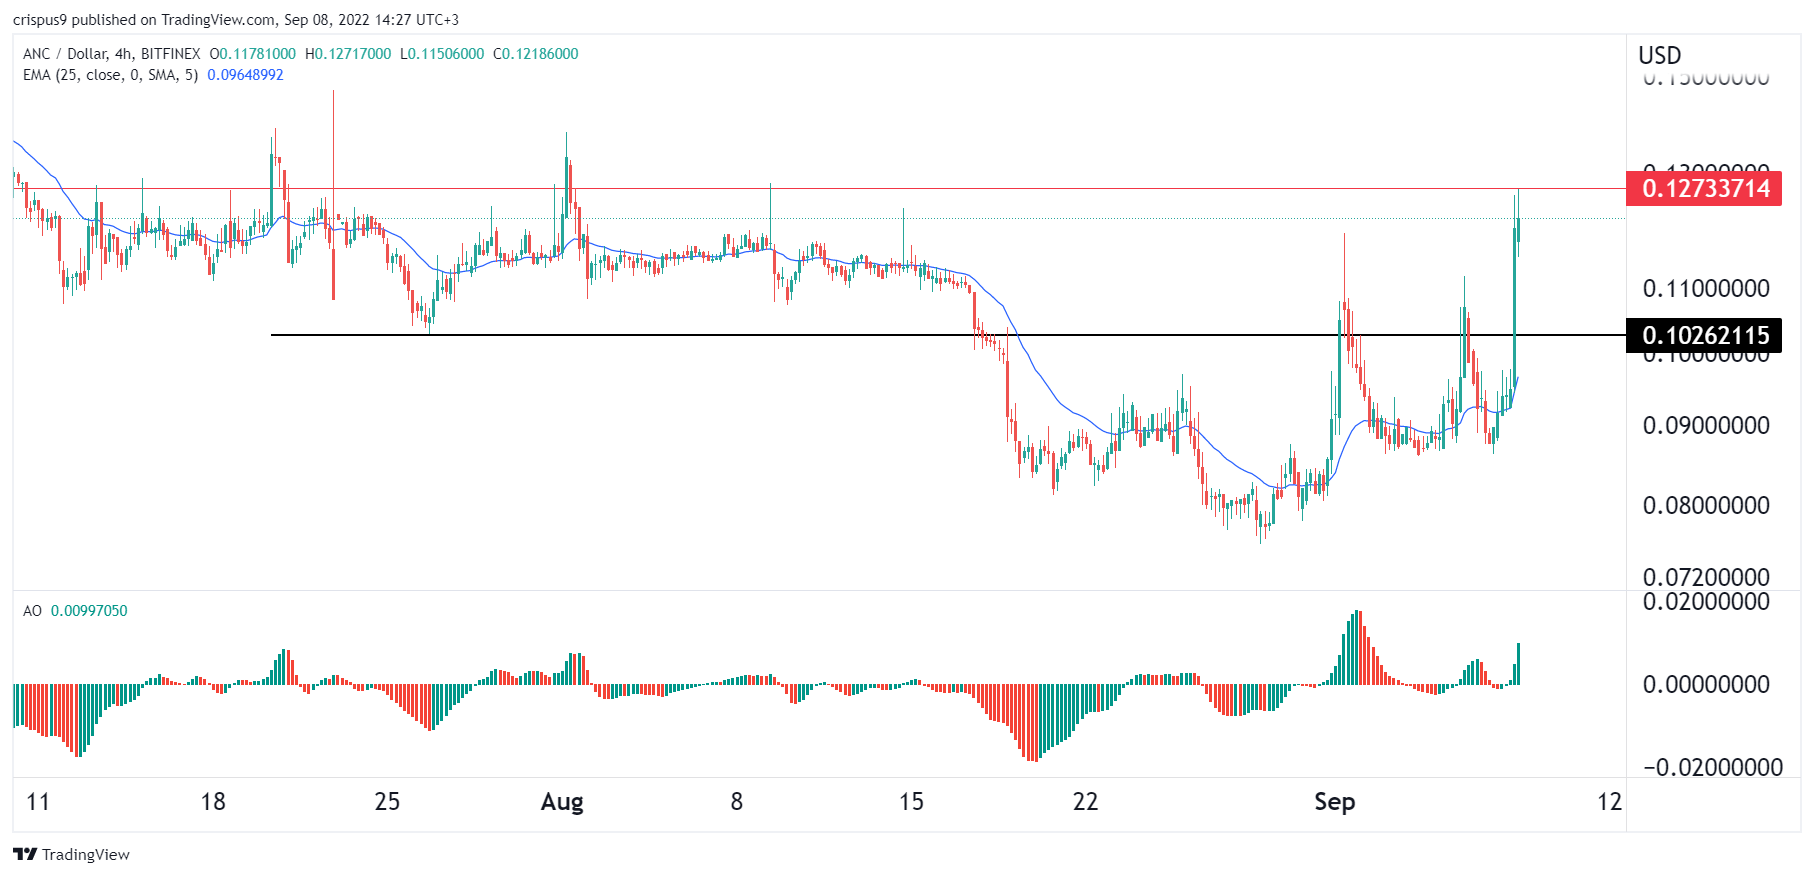
Anchor Protocol price went parabolic on Thursday as investors cheered the strong performance of cryptocurrencies associated with Terra. The ANC token jumped to a high of $0.12, which was the highest level since August 9. It has jumped by over 65% from its lowest level in August of this year.

Why is ANC price soaring?

Anchor Protocol was the biggest part of Terra’s ecosystem. It was a platform that allowed people to deposit Terra USD stablecoin and earn exceptional returns. In most periods, the platform had APY of over 20%. ANC was the native token for Anchor Protocol’s ecosystem.

At its peak, Anchor Protocol was one of the biggest decentralized finance (DeFi) platforms in the world with a total value locked (TVL) of over $17 billion. All this came crumbling down in May when Terra USD lost its peg leading to the collapse of Terra’s ecosystem.

Since then, no activity has been going in Anchor Protocol. By design, it only worked with Terra USD, whose price crashed from $1 to below $0.0001. At the same time, several cryptocurrency exchanges like FTX decided to delist ANC.

Anchor Protocol price has staged a strong recovery in the past few days because of the strong price action in Terra’s ecosystem. In the past few weeks, Terra Classic USD (USTC) has surged to a high of $0.08. And according to CoinMarketCap, its total market cap has jumped to over $458 million. 

Similarly, Terra Classic has jumped by more than 100% in the past seven days, giving it a market cap of over $3 billion. The new version of the coin known as LUNA has also rebounded. Other coins in Terra’s ecosystem like Mirror Protocol and Astroport have also risen. 

Some analysts believe that this rebound of Anchor Protocol price is part of a pump and dump scheme since the coin is thinly traded.

Anchor Protocol price prediction

The four-hour chart shows that the ANC price has been in a strong bullish trend in the past few days. Along the way, the coin has managed to move above the important resistance level at $0.1026, which was the lowest level on July 21. As it rose, Anchor Protocol moved above the key resistance at $0.1120 and $0.1187. 

It has also moved above the 25-day and 50-day moving averages while the Awesome Oscillator has moved above the neutral point. Therefore, the coin will likely keep rising as FOMO sets in. This could see it soar to a high of $0.15.

The post Anchor Protocol (ANC) Price Soars as Terra’s LUNC and USTC Rebound appeared first on CoinJournal.

Terra Classic’s LUNC is up by 50% on Thursday: Here is why

LUNC, the native coin of the Terra Classic ecosystem, is up by 50% in the last 24 hours, outperforming the other major cryptocurrencies.

LUNC is the best performer amongst the top 100 cryptocurrencies by market cap today. The native token of the Terra Classic ecosystem is up by more than 50% in the last 24 hours, outperforming the broader crypto market.

The cryptocurrency market is recovering from the slump suffered on Wednesday. The total market cap is now up by more than 4% in the last 24 hours and currently trades above $975 billion.

Bitcoin is eyeing the $20k resistance point once again after adding nearly 3% to its value today. Ether is up by more than 7% in the last 24 hours and is trading above $1,600 ahead of the Merge.

LUNC’s rally comes as the Terra Classic ecosystem prepares for its 1.2% tax burn. Several exchanges, including KuCoin, have announced support for Terra Classic’s 1.2% tax burn when the proposal is officially approved and implemented on Terra Classic (LUNC) mainnet.

Key levels to watch

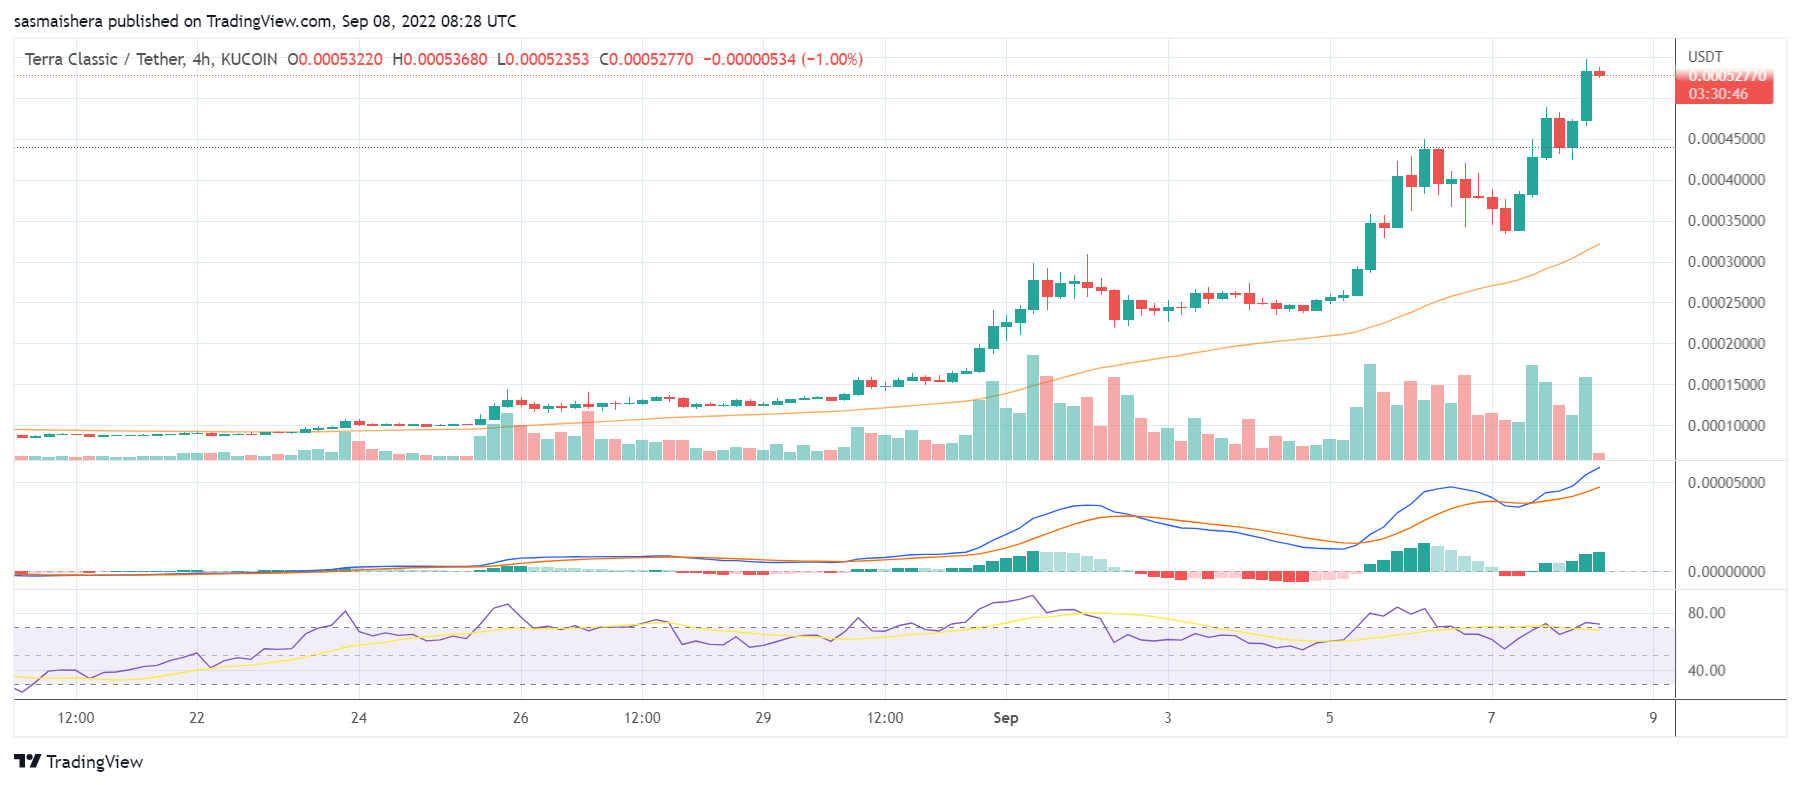
The LUNC/USDT 4-hour chart is extremely bullish as the cryptocurrency is up by more than 130% in the last seven days. The technical indicators show that it is one of the best performers in the market.

The MACD line is within the positive territory, indicating bullish momentum for LUNC. The 14-day relative strength index of 78 shows that LUNC could enter the overbought region if the rally is sustained.

At press time, LUNC is trading at $0.0005318 per coin. If the positive momentum is maintained, LUNC could surge past the $0.000751 resistance level. In the event of an extended bullish run, LUNC could set a new all-time high around $0.001 level. 

The bears are still lurking and could drag LUNC lower after the tax burn event. If that happens, LUNC could decline below the $0.00040495 support level. 

The post Terra Classic’s LUNC is up by 50% on Thursday: Here is why appeared first on CoinJournal.

PIVX price pumps after forming a falling wedge. Is it a buy?

PIVX price jumped sharply on Wednesday even as the prices of other cryptocurrencies nosedived. The token rose to a high of $0.2265, which was the highest level since August 28. At its peak, the coin was up by more than 44% from its lowest level this week.

What is PIVX and why is it rising?

PIVX price defied gravity on Wednesday even as the prices of other digital coins crashed. Bitcoin dropped to a low of $18,000 while the total market cap of all digital cryptocurrencies dropped below $1 trillion.

For starters, PIVX is a privacy-focused cryptocurrency that emerged as a hard fork of Dash. Dash, on the other hand, was created from a hard fork of Litecoin, one of the oldest cryptocurrencies in the world.

There are four main types of transactions in PIVX. First, there is transparent transactions where the sender and recipient’s address are all public. Second, there are de-shielding transaction, where a shield address sends funds to a transparent one. 

Third, there is a shielding transaction where a transparent address sends to a shield one. Finally, there is a shield transaction, where a shield sender sends to another shield address.

Another PIVX feature is that it rewards its users for just holding the token. According to its website, the average daily reward for the token is 2.52 PIV while the estimated annual yield is 9.18%. The total supply locked in masternodes has risen to 24.53%.

It is unclear why the PIVX price is soaring as other cryptocurrencies crash. A possible reason is that this could be a pump and dump scheme. In 2021, users complained after losing over $112 million in a pump and dump scheme of the token. 

PIVX price prediction

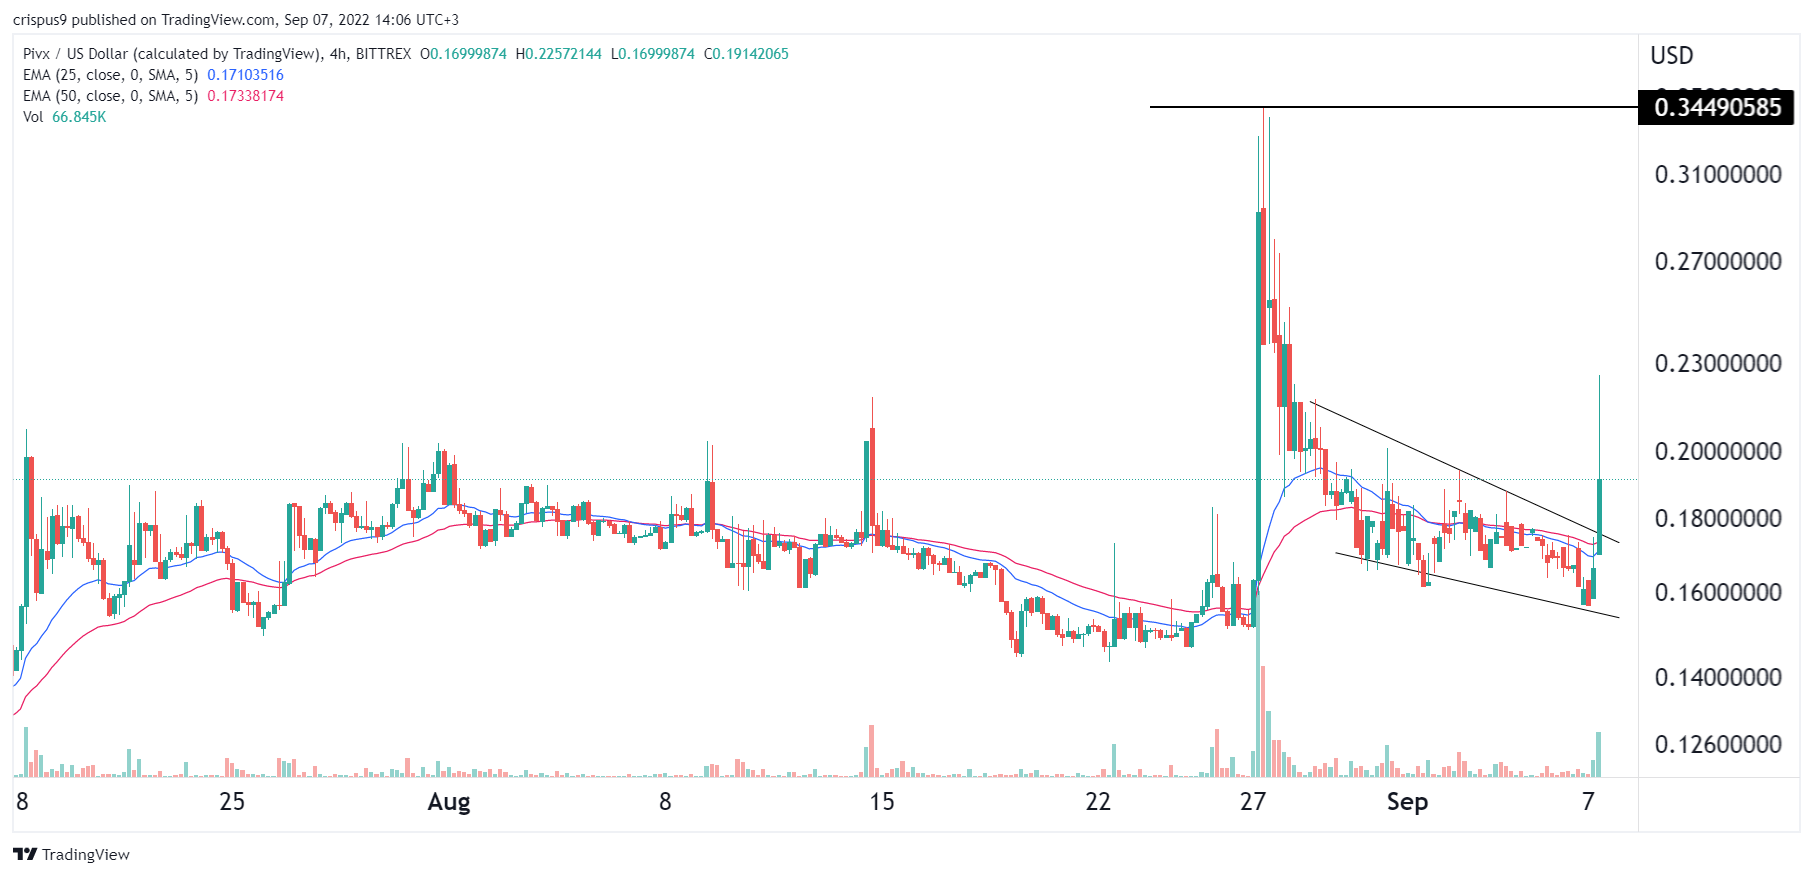
The four-hour chart shows that the PIVX price jumped to a high of $0.3450 on August 27 of this year. This was a 140% increase from the lowest level during the month. It then had a freefall as demand for the coin crashed and after it moved to a distribution phase. 

As the coin dropped, it formed a falling wedge pattern that is shown in black. In price action analysis, this pattern is usually a bullish sign, which explains why its price rose. Still, with volume still low, there is a likelihood that the coin will resume the bearish trend in the near term.

The post PIVX price pumps after forming a falling wedge. Is it a buy? appeared first on CoinJournal.

Why is Helium up by more than 7% on Wednesday?

Helium has emerged as the best-performing cryptocurrency amongst the top 100 coins by market cap on Wednesday.

HNT, the native coin of the Helium blockchain, is the best performer amongst the top 100 cryptocurrencies by market cap today. Helium’s performance comes despite the broader crypto market underperforming in the last 24 hours.

The broader cryptocurrency market is trading in the red zone after starting the week positively. The total cryptocurrency market cap is now around $941 billion, down by more than 5% so far today.

Bitcoin has once again dropped below $19k and is currently trading at $18,790, down by more than 5% in the last 24 hours.

Ether, the second-largest cryptocurrency by market cap, is also down by more than 8% in the last 24 hours and is currently trading at $1,520 per coin.

Although HNT is the best performer amongst the top 100 cryptocurrencies by market cap today, there is no apparent catalyst behind this move. Despite HNT’s ongoing positive performance, the coin has lost more than 27% of its value in the last seven days.

Key levels to watch

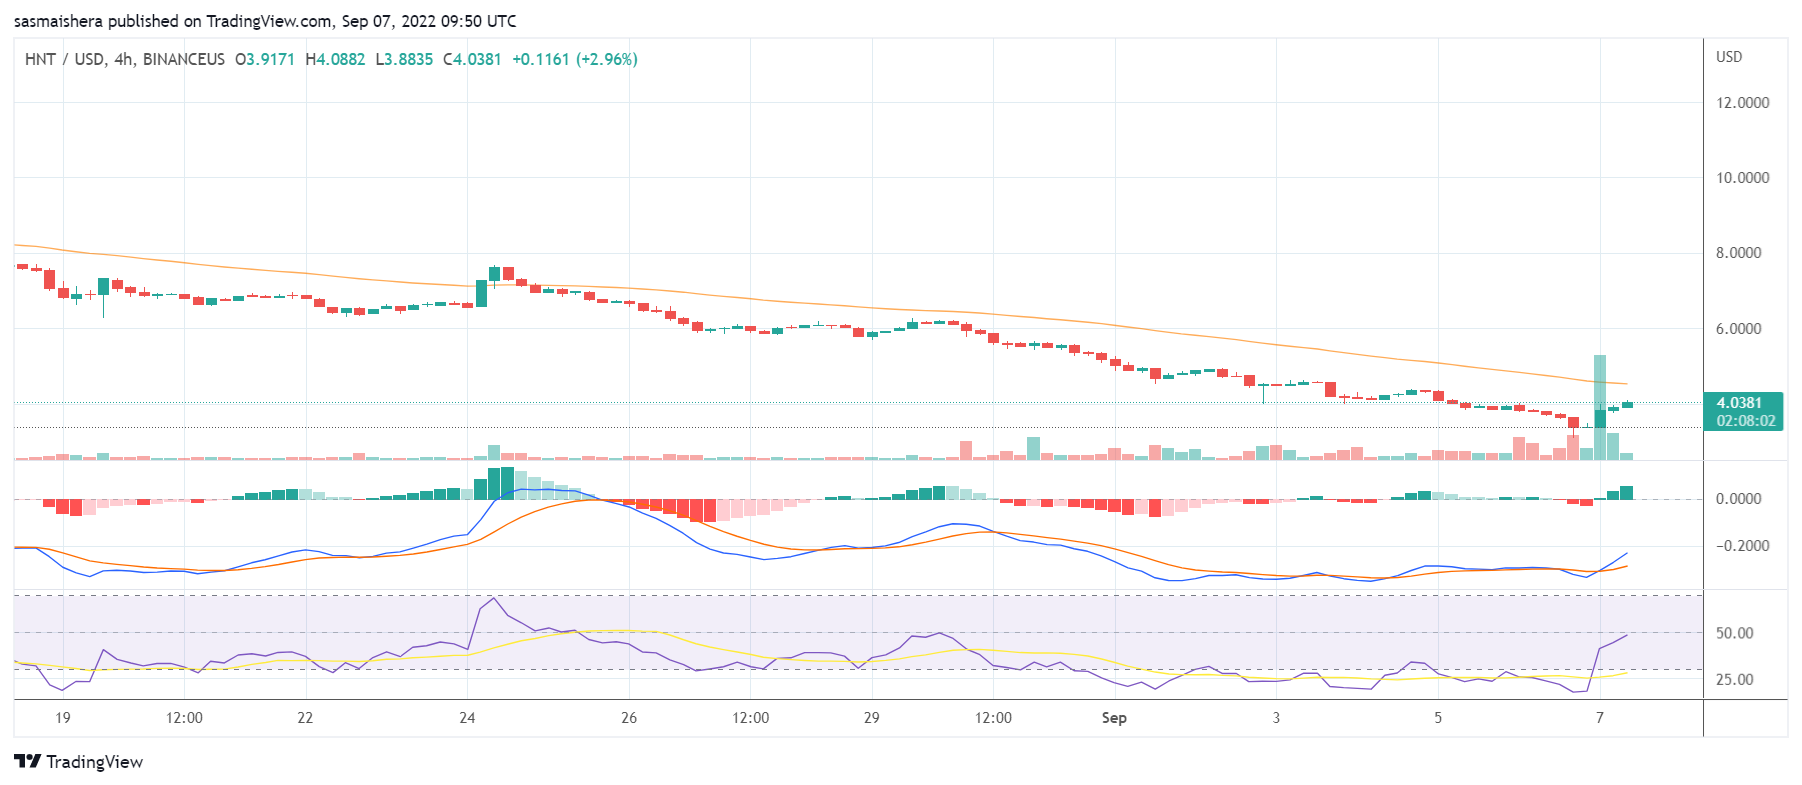
The HNT/USD 4-hour chart remains bearish despite Helium outperforming the market in the last 24 hours. HNT’s technical indicators show that the coin is recovering from its recent slump.

The MACD line dropped into the negative zone on August 25th and continues to remain there. Despite HNT’s positive performance, the MACD line is still within the negative region, indicating that the bears have not relinquished control.

The 14-day relative strength index of 49 shows that HNT is no longer in the oversold region. HNT would need to rally higher to enter the overbought territory over the next few days and weeks.

At press time, HNT is trading at $4.028 per coin. If the recovery continues, HNT could surge past the $4.470 resistance level before the end of the day. 

However, HNT would need the support of the broader market to move past the second major resistance point at $5.017.

The bears are still around and could drag HNT below the $3.7771 support level over the next few hours.  

The post Why is Helium up by more than 7% on Wednesday? appeared first on CoinJournal.