Litecoin price prediction as token trades under $50

  • Litecoin has plummeted over 60% since March

  • The launch of the MWEB privacy upgrade contributed to a bearish sentiment

  • LTC trades lower than $50 psychological support level

Litecoin (LTC/USD) has been trading in lower highs and lower lows since March 2022. The trend has led to a 64% decline from $132. The current trading price is $47, with a daily drop of 4.36%. 

Litecoin is one of the earliest crypto projects that was forked from Bitcoin in 2011. LTC token is a utility crypto powering transactions in the network and acting as a store of value.

Many factors have contributed to the decline in LTC. The launch of Litecoin’s MimbleWimble update received negative sentiment leading to delisting in Binance and multiple Korean exchanges.

Litecoin is also a victim of the overall cryptocurrency bearish sentiment, which has seen most tokens dip. The token was designed to complement bitcoin with a faster block time and larger supply. Due to its similarity with bitcoin, Litecoin is affected by the same sentiment facing BTC. Some of them include the hike of interest rates by the Federal Reserve. The economic intervention with the rising inflation rate has forced investors to less risky assets.

Currently, most cryptos tokens are flashing red lights. Bitcoin has dipped 4.45% in the past day, trading at $19,623. Ethereum is also down 7.88% in the same period at $1,056. BNB, XRP, and Cardano have also plunged 4.3%, 4.88%, and 6%, respectively.

LTC loses $50 Psychological support level
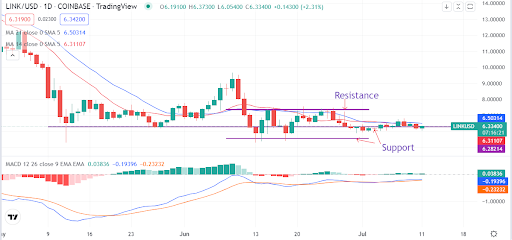
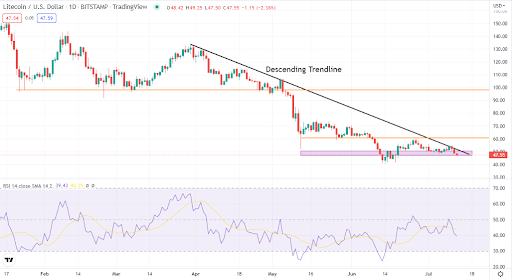
Source: TradingView

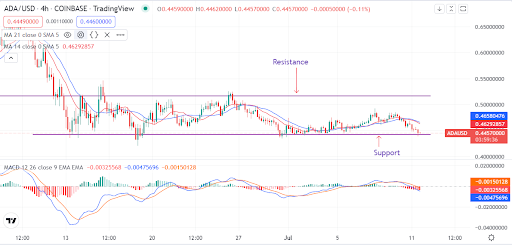
According to Litecoin’s daily chart, LTC has been bouncing off a descending trendline. The token has also lost key support levels at $98 and $60. Furthermore, at the $47 support zone, LTC is looking bearish and can trade lower. The price outlook shows that if the LTC loses the currency support, more positions will be liquidated even as the RSI remains above the Oversold zone.

Closing thoughts

We do not recommend a buy of LTC at the current level as the technical and fundamental analysis points towards a bearish momentum. Investors should remain patient until there is a change of sentiment. The sell-off in LTC is related to both internal factors and the aspects around the macroeconomic level.

The post Litecoin price prediction as token trades under $50 appeared first on CoinJournal.

GMX price has staged a slow recovery. Is it still a good buy?

The GMX price has been in a slow recovery as investors attempt to buy the dip. The token is trading at $21, which is the highest it has been since July 3rd of this year. It has jumped by more than 120% from the lowest level in June this year. GMX has a market cap of over $168 million. 

What is GMX? 

There are primarily two main types of cryptocurrency exchanges: centralized and decentralized platforms. In the past few years, the concept of decentralized exchanges has become so popular that analysts believe that they will soon overtake centralized exchanges like Coinbase and Binance. 

GMX is a relatively small but fast-growing decentralized perpetual exchange that enables people to buy and sell crypto derivatives in just a few steps. Unlike centralized exchanges, you don’t need to register. Instead, all you need is to connect your wallet to its platform and start trading. 

Read our review of the best crypto exchanges.

GMX makes it possible for people to use leverage to maximize their crypto investments. It also has substantially lower fees than other perpetual protocols. In addition to trading, one can easily swap coins in a few steps. 

GMX uses two smart contracts that are all easily available to most users. Its main platform was built on Arbitrum, which is well-known for its low fees and high performance. It is also available on Avalanche. According to its website, GMX has helped to facilitate over $47 billion in trading volume from over 69k users. 

GMX has two tokens: GMX and GLP. GMX, the main coin, is the utility token for the ecosystem. It accrues about 30% of the total fees earned from the ecosystem. Holders earn about 21% on both Arbitrum and Avalanche. On the other hand, GLP is the liquidity provider token for the network. It accrues about 70% of its fees. 

GMX price prediction 

The hourly chart shows that the GMX token price has been in a slow upward trend in the past few days. The coin has managed to move above the ascending trendline that is shown in blue. It is also hovering around the 25-period and 50-period moving averages. 

A closer look shows that it has formed what looks like an ascending head and shoulders pattern. Therefore, we can’t rule out a situation where the GMX price makes a major pullback in the coming days. If this happens, the next key support level to watch will be at $18.

The post GMX price has staged a slow recovery. Is it still a good buy? appeared first on CoinJournal.

Origin Protocol price prediction: Is it safe to buy the OGN dip?

The Origin dollar price joined other cryptocurrencies in a strong sell-off as investors waited for the upcoming American inflation data. OGN, the network’s coin, is trading at $0.2170, which was the lowest level since June 18th. It has crashed by more than 40% from its highest point this month, bringing its total market cap to about $111 million.

What is Origin Protocol and why is it falling?

Origin Protocol is a blockchain project that is at the intersection of three well-known industries in the decentralized industry: DeFi and NFTs. 

DeFi is an industry that is attempting to change how people handle finances. Instead of using centralized companies like banks, DeFi is enabling people to use organizations backed by smart contracts. Anyone can participate in this Decentralized Autonomous Organization (DAO) by buying th OGN token.

Origin Protocol’s DeFi platform is made possible by Origin Dollar (OUSD), which is an algorithmic stablecoin. Unlike popular stablecoins like USDT and USDC, OUSD is not backed by fiat currencies. 

Like Terra UST, OUSD is an algorithmic stablecoin that aims to achieve its peg through arbitrage. According to CoinGecko, Origin Dollar has a total market cap of over $66 million, making it the 319th biggest cryptocurrency in the world.

Like Anchor Protocol, Origin’s DeFi product enables OUSD holders to earn interest by just holding the coin. At the time of writing, the coin has an APY of 12.50%, which is a higher yield than what fiat currencies like the US dollar earns. 

Origin Protocol also owns Origin Story, a platform in the NFT industry. The platform enables people to mint NFTs and sell them in the platform. They can personalize their storefronts and engage their audience easily.

The OGN price has declined recently mostly because people are worried about both the DeFi and NFT ecosystems. There are concerns about the future of the OUSD and the fact that NFT sales are falling.

Origin Protocol price prediction

The four-hour chart shows that the OGN price has been in a strong bearish trend in the past few weeks. It has managed to move below the support at $0.2365, which was the lowest level on July 1st. It has also dropped below the 25-day and 50-day moving averages while the Relative Strength Index (RSI) has moved below the oversold level.

Therefore, the Origin Protocol price will likely continue falling as sellers target the key support at $0.1900. 

The post Origin Protocol price prediction: Is it safe to buy the OGN dip? appeared first on CoinJournal.

Chainlink’s prediction after Grayscale removed the token from its fund

  • Chainlink’s token LINK was recovered from the Grayscale fund

  • LINK powers the decentralized oracle network

  • The cryptocurrency is robust, although resistance holds it back

Chainlink’s LINK/USD may not be among the week’s strongest tokens. With 7-day gains of around 1.18%, the price has been relatively consolidating. However, it has kept key levels intact, implying a potential price take-off in the next few days.

LINK is the native token of a decentralized oracle network. Chainlink’s oracles are bridges connecting smart crypto contracts and off-chain data. Thus, the network’s continued growth is tied to the demand for smart contracts. Recently, the network announced that its smart protocols were live on the Fantom mainnet. Chainlink also, on June 7, announced a new road map that will introduce staking on the platform. The developments have been positive for LINK, which has been staging recoveries.

The most recent development has, however, been negative for LINK. On July 8, asset manager Grayscale Investments announced the removal of LINK from its Digital Large Cap Fund. The removal also included LTC, BCH, UNI, and DOT. However, the move has caused a little impact on LINK, which has been showing strengths lately. We believe LINK could stage a major comeback if it maintains key levels.

LINK recovering key level of $6.3 after slipping below it

Source – TradingView

The daily chart shows LINK trapped below the $7.4 resistance. The price has attempted a break above the level severally, but bears have taken control. The crypto’s support is currently at $6.3. MACD signal is above the moving average, meaning that the token is still bullish. We believe LINK is staging a recovery soon, although the price could remain subdued for a while. If the price fails to hold $6.3 support, it could slide to $5.6.

Summary

Chainlink’s token is robust despite its removal from the Grayscale fund. The token is recovering the $6.3 support but could remain subdued by the $7.4 resistance. Consider buying above the $5.6 support.

The post Chainlink’s prediction after Grayscale removed the token from its fund appeared first on CoinJournal.

Decision moment for Cardano as whales add another $37 million in June

  • Cardano’s Vasil update went live on July 3 ahead of the mainnet launch

  • Whales have been accumulating the cryptocurrency ahead of the hard fork

  • ADA price remains subdued, but recent accumulation points to a potential spike

Cardano’s ADA/USD is a cryptocurrency that investors are highly anticipating a comeback. The optimism relates to the expected mainnet hard fork, enhancing Cardano’s scalability. Initially set for June 29, Cardano developers rescheduled the date to clear critical issues. ADA price has since been moving with the general crypto trends. Investors are accumulating the tokens.

Santiment indicates that ADA investors boosted their holdings by nearly 80 million tokens in June. The investors have holdings that range between 10,000 and 100,000 tokens. The Santiment data also indicated that the sell-off of ADA had reduced significantly since mid-June.

Investors are banking on the Vasil upgrade, which is expected to boost the ADA price soon. The date for the final upgrade is yet to be confirmed. The Vasil update went live on the network testnet on July 3. With these developments, it is worth exploring when to buy ADA.

ADA slips to support amid bearish pressure

Source – TradingView

ADA has been trapped between $0.51 resistance and $0.44 support for a month. The moving average and MACD indicators are currently flashing bearish signs. We view the region as a potential make or break for ADA. Long-term buyers should consider buying at the $0.44 bottom. ADA would experience a lasting momentum if it successfully clears $0.51 resistance. Investors should now watch for price action and a potential bullish reversal at $0.44.

Summary

Cardano is experiencing an increased whale activity despite a bearish market. ADA price is under pressure as technical indicators reveal bearish signs. However, the price remains supported at $0.44, and a bullish reversal could occur.

The post Decision moment for Cardano as whales add another $37 million in June appeared first on CoinJournal.