STEPN underperforms despite introducing quarterly buyback and burn

The cryptocurrency market has been underperforming over the last 48 hours. 

The cryptocurrency market has continued its poor performance this week. The total market cap is down by nearly 2% in the last 24 hours, with the major coins currently trading in the red zone. The total market cap currently stands at around $870 billion.

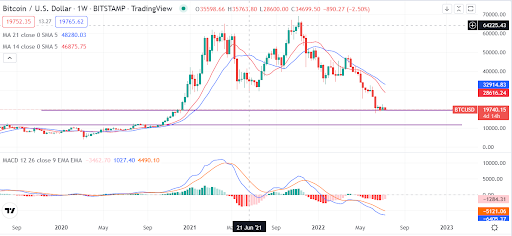
Bitcoin, the world’s leading cryptocurrency, continues to trade below the $20k mark after losing more than 2% of its value in the last 24 hours. Meanwhile, Ether has maintained its price above $1,000 despite losing 2% of its value today.

GMT, the native token of the STEPN walk-to-earn ecosystem, has lost more than 3% of its value in the last 24 hours. This latest development comes despite STEPN announcing two major updates in the last few hours.

On Tuesday, STEPN revealed that it generated $122.5 million in profits through its platform fees in the second quarter. As a result, STEPN will use 5% of the profits to initiate a Q2 GMT buyback and burn program. 

STEPN also introduced a new feature called Health Points (HP) earlier today. The team added that the HP attribute would be displayed in the Sneaker’s background in the form of a capsule.

Key levels to watch

The GMT/USD 4-hour chart is bearish as STEPN has been underperforming over the last 24 hours.

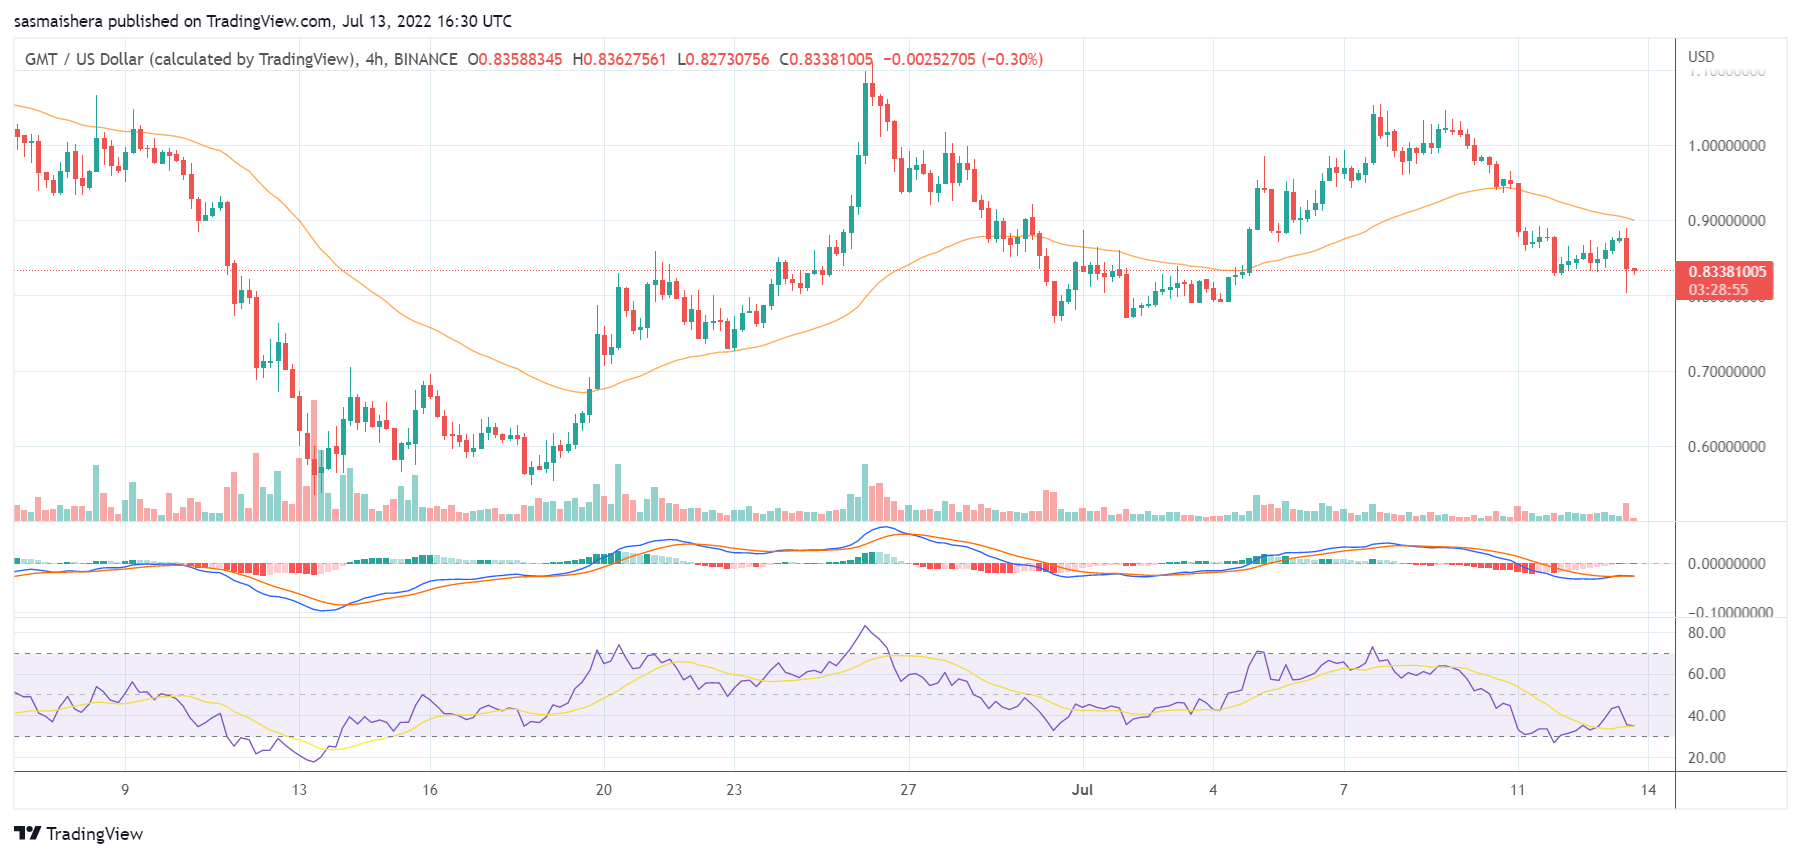
The MACD line is below the neutral zone, indicating bearish momentum. The 14-day relative strength index of 37 shows that GMT could soon enter the oversold region if the bears remain in control.

At press time, GMT is trading at $0.83 per coin. GMT could slip below the $0.731 support level before the end of the day. In the event of an extended bearish performance, GMT could lose its second major support level at around $0.66. 

The post STEPN underperforms despite introducing quarterly buyback and burn appeared first on CoinJournal.

Why is Decred up by more than 11% in the last 24 hours?

The cryptocurrency market has underperformed for the second-consecutive day this week.

The cryptocurrency market has continued its poor performance this week. The total market cap is down by nearly 2% in the last 24 hours and currently stands around $870 billion.

If the bearish trend continues, the total market cap could slip below the $850 billion mark soon.

Bitcoin continues to trade below the $20k mark after losing more than 2% of its value in the last 24 hours. Ether, the second-largest cryptocurrency by market cap, has maintained its price above $1,000 despite losing 2% of its value today.

However, DCR, the native token of the Decred ecosystem, is the best performer amongst the top 100 cryptocurrencies by market cap. DCR has added more than 11% to its value over the past few hours.

At the moment, there is no catalyst behind DCR’s ongoing rally. It has outperformed the other major cryptocurrencies and the broader cryptocurrency market over the past 24 hours.

Key levels to watch

The DCR/USD 4-hour chart has turned bullish as Decred has been performing excellently over the past 24 hours. The technical indicators show that it is outperforming the broader crypto market.

The MACD line has crossed into the positive zone as DCR has been performing well so far today. The 14-day relative strength index of 69 shows that DCR could enter the overbought region if the rally continues.

At press time, DCR is trading at $24.46 per coin. If the rally continues, it could surge past the first major resistance level at $27.49 before the end of the day. However, it would need the support of the broader crypto market to move past the $30 resistance point.

The bear market is still in play, and DCR could slip below the $21 support level over the coming hours. However, DCR should comfortably defend its price above $19 in the short term. 

The post Why is Decred up by more than 11% in the last 24 hours? appeared first on CoinJournal.

Bitcoin steady as inflation data nears – Major turning point or further crash?

  • Bitcoin holds onto $19,000 as investors remain cautious of inflation numbers.

  • The price may weaken further if inflation rises faster than expected.

  • Bitcoin remains held by long-term focused investors.

Bitcoin BTC/USD trades at $19,796 as of press time. The level is already a support zone. The world’s largest cryptocurrency has held the level for a month. It signals that investors are circling the cryptocurrency after recent declines. However, inflation data on Wednesday will be a major event closely watched by Wall Street.

An inflation data on Wednesday by the US labor department will show how prices jumped in June. Faster inflation will stoke markets as it will call for a faster Fed move to tighten policy. Bitcoin will be under pressure at $19,000 if the numbers exceed estimates. Similarly, data showing cooling prices could allow Bitcoin to continue holding onto the $19,000 level. 

Although Bitcoin is under pressure, long-term focused investors remain convinced of a recovery. Coinbase Analytics data shows that investors hold 77% of the supply of the cryptocurrency. The number is close to the peak of 80% in January and higher than 60% of the bull run in late 2017. David Duong, Coinbase’s head of institutional research, says that short-term traders account for most sells. Whereas the inflation data will have an impact on Bitcoin price, investors should still see an opportunity at $19,000.

Bitcoin keeps $19,000 support intact

Source – TradingView

Technically, the MACD and moving averages flush bearish signals for Bitcoin. However, the cryptocurrency has kept the support intact. If inflation numbers grow further, Bitcoin could slide. The next support is at around $11,500. Prices could still recover before the next support as Bitcoin is a very volatile cryptocurrency.

Summary

We encourage a long-term hold for Bitcoin as volatilities remain in place. High inflation could lead to a further decline. The price could recover from the support zone if inflation cools.

The post Bitcoin steady as inflation data nears – Major turning point or further crash? appeared first on CoinJournal.

Is ApeCoin a buy after retesting $4.3 support?

  • ApeCoin finds support at the $4.3 price level.
  • APE is down 83.8% from its all-time high.

  • Trends around Metaverse directly affect the long-term value.

The ApeCoin DAO airdropped millions of APE tokens to NFT owners in March this year during the token’s launch. The airdrop went to BAYC, Mutant Ape Yacht Club, and Bored Ape Kennel Club NFT holders. The token distribution and the speculations around it drove it to as high as $27 in April.

The surge was also attributed to the anticipated NFT sales of the BAYC metaverse game ‘Otherside’. However, at the moment, the enthusiasm seems to have faded away. APE is currently trading at $4.28 after a 5.77% decline in the past day and a 10.39% drop in the past week.

Overall, ApeCoin is down 83.8%, with a market capitalization of $1.29 million and #43 in market ranking. The current circulating supply is 299,531,250 from a hard cap of 1 billion. 

ApeCoin is a governance token that is used as a utility token. The token allows holders to be part of a decentralized ecosystem of a Web3 community. The native APE token started trading on March 17, 2022. The token remains bearish despite attracting notable partnerships from major industry players like Animoca Brands. However, as the Web3 economy evolves into the metaverse, projections point to a comeback in the token.

APE retests $4.3 support

The 4-hour technical chart below shows that APE has retested the $4.3 price support. The MACD line has crossed the signal line from above to below, showing that the momentum is bearish. However, the RSI reading is at the oversold zone and presents a potential trend reversal. If the trend reverses, $5.3 will be the next level to watch. Clearance above the resistance could welcome an uptrend.

Source: TradingView

Summary

While the speculation around NFTs is believed to have been behind the surge in the value of APE, the long-term value seems intact. The technical indicators show mixed signals, with the MACD showing bearish momentum while the RSI seems to have bottomed. For the holders, the trends in the metaverse and NFTs will inform the value of ApeCoin.

The post Is ApeCoin a buy after retesting $4.3 support? appeared first on CoinJournal.

What next as Tezos slips below a short-term trendline?

  • Tezos token XTZ has been bullish this month.

  • The cryptocurrency has breached an ascending trendline and is going lower.

  • XTZ could fall up to $1.3 as weakness develops.

Tezos XTZ/USD has been bullish since the start of July. The cryptocurrency recovered from the $1.3 bottom on July 1, rising to a high of 1.7 on July 11. The crypto weakness has caused a 2% drop in Tezos in the last 24 hours.

Tezos prides itself on being an open-source platform. It seeks to address the barriers that face blockchain adoption for assets and applications. It achieves the goal by ensuring that Web3 is user-governed. Users can directly interface with one another over the network and interact with various applications. Its native token XTZ is used to pay for fees and for staking. It also acts as the basic accounting unit on the blockchain platform.

Whereas the XTZ token surged massively in 2021, it crashed this year. The token currently trades at $1.5, significantly below the high of above $9 in October 2021. Investors could again be looking for an opportunity to snap the token at the bottom. But is Tezos currently a buy?

Tezos bearish breakout is currently underway

Source – TradingView

Technically, the MACD indicator is flashing a bearish market for Tezos. Previously, the cryptocurrency was trading in a system of higher highs and higher lows. Prices always recovered after hitting the 21-day moving average. However, with the recent weakness, Tezos broke below the ascending trendline and channel. It also trades below the 14-day and 21-day moving averages, which affirms the developing bearish move. We recommend a sell of Tezos as the price faces further declines. The cryptocurrency could proceed lower to touch the $1.3 support again.

Summary

Tezos is bearish after breaching an ascending trendline and channel. MACD indicators and moving averages are bearish. The cryptocurrency could fall back to $1.3.

The post What next as Tezos slips below a short-term trendline? appeared first on CoinJournal.