Why is ATOM up by more than 12% in the last 24 hours?

ATOM is one of the best performers amongst the top 30 cryptocurrencies by market cap today. 

ATOM, the native token of the Cosmos ecosystem, is one of the best performers amongst the top 30 cryptocurrencies by market cap today. The coin has added more than 12% to its value today, outperforming the broader crypto market. 

The cryptocurrency market is slowly recovering today, following a slow start to the week. After losing more than 3% of its value yesterday, the crypto market is up by nearly 2% so far today. 

The positive performance has pushed the total cryptocurrency market cap above the $1 trillion mark again.

Bitcoin remains above the $21k level and could rally higher today after adding more than 1% to its value. Ether is trading above $1,600 after depending its price above the $1,500 psychological level yesterday. 

However, ATOM is the second-best performer amongst the top 30 cryptocurrencies by market cap (only behind Bitcoin Cash).

There is no catalyst behind ATOM’s ongoing rally as it could be only a recovery from its recent price crash. Despite adding more than 12% to its value today, ATOM is down by 1% in the last seven days.

Key levels to watch

The ATOM/USD 4-hour chart has turned bullish as Cosmos has been performing well over the past 24 hours. 
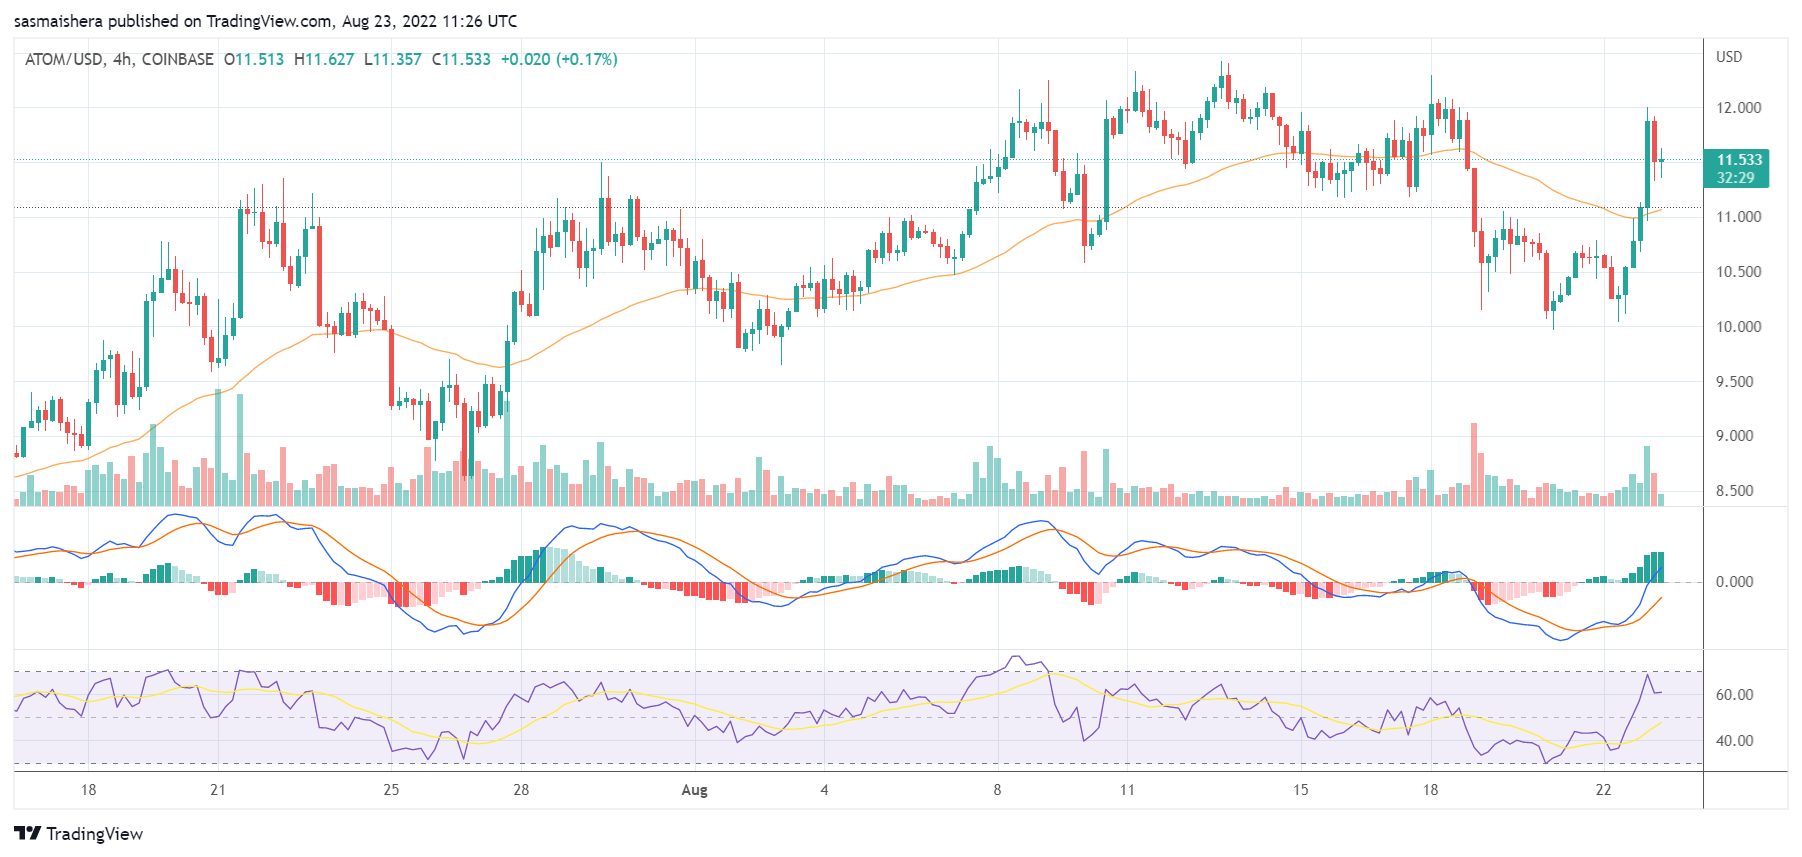
The MACD line crossed into the positive zone a few hours ago, indicating that ATOM is no longer bearish.

The 14-day relative strength index of 60 shows that ATOM could enter the overbought region if the positive momentum continues. 

At press time, ATOM is trading at $11.52. If the positive momentum continues, ATOM could move past the first major resistance level at $12.271 before the end of the day. 

However, ATOM would need the support of the broader market to reach the $13.60 mark for the first time since May.

The post Why is ATOM up by more than 12% in the last 24 hours? appeared first on CoinJournal.

Is Ethereum Classic losing the technical battle at $34?

  • Ethereum Classic is trading slightly below key support of $34

  • The token is expected to benefit from the Ethereum merge; however, disputed

  • Ethereum Classic could head to $26 next if it loses the $34 technical battle

Ethereum merge euphorbia seems to be now fading. As the September 15 date fast approaches, Ethereum and hard fork Ethereum Classic ETC/USD are falling. That, of course, is not to mean that the hard fork will not have a bullish impact on price. If speculations are to be believed, Ethereum’s price will hit $5,000 after a successful merge. Its hard fork, Ethereum Classic, is expected to surge too on the influx of PoW to the protocol. The idea is still disputed if, indeed, Ethereum Classic will benefit. ETC gains have been direct as a result of expectations. 

It is too early to speculate that ETC will benefit from Ethereum Merge. However, speculations will remain as cryptocurrencies are known to benefit from them, if positive. Thus, we cannot underestimate how much ETC could surge in the 3 weeks to the merge. We still urge caution as the technical indicators are currently not pricing to a potential merge rally.

Ethereum Classic could retest $26 as the price remain bearish

Source – TradingView

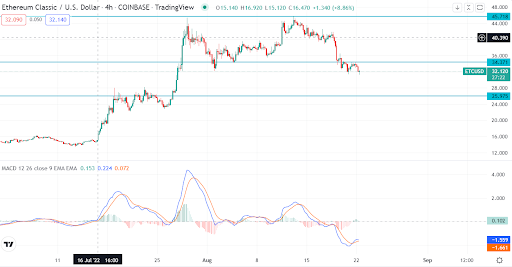
Ethereum Classic trades at $32. The price below key support at $34 indicates bear momentum. Using a short time frame of 4 hours, we can see that the MACD line has moved above the moving average. That suggests a short-term price appreciation. The momentum indicator still remains in bear territory. 

Concluding thoughts

Potential price discovery is expected to push Ethereum Classic to $34. However, the token will remain bearish if the price fails to break past $34. A price rejection will see bears take control, with ETC potentially crashing to $26.

The post Is Ethereum Classic losing the technical battle at $34? appeared first on CoinJournal.

Cardano retests key support amid bearish sentiment and testnet concerns

  • ADA has dipped 3% in the past day.

  • Reports of a bug in one of Cardano’s testnets likely to delay Vasil upgrade.

  • Technical indicators are looking bearish below the $0.56 resistance level.

Cardano’s ADA/USD has dropped 3% in the past day, increasing weekly losses to 19%. Its market capitalization is down to $15,218,450,837 with lower trading volumes. ADA trading volumes reduced by 8% to slightly above $650 million in the past day.

The bearish momentum in Cardano is partly linked to the ongoing crypto market correction. Aside from the correction, an important fundamental aspect has shaken the smart contract blockchain. A bug reported in its testnet could delay the anticipated Vasil hard fork.

Cardano’s founder Charles Hoskinson has refuted the claims, which termed the testnet ‘catastrophically broken’. Hoskinson said that the bug had already been solved in a previous update and was not a major issue. He maintains that the concerns could unnecessarily delay the hard fork.

Vasil upgrade is expected to introduce major updates on Cardano. Some benefits include enhanced throughput speed and reduced latency of block transmission. However, there have been multiple delays, with the latest being in July. The delays are causing a subdued performance in ADA, as shown in the daily chart below.

ADA retests $0.4 support

Source: TradingView

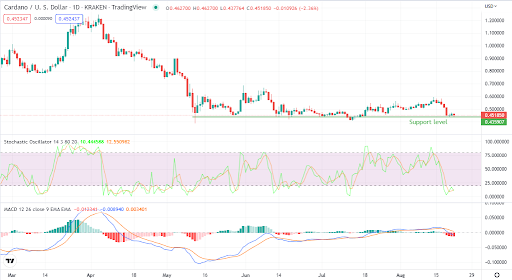
According to the technical chart above, ADA has retested the $0.43 support level. The level has been retested several times since mid-May. Overall, the token has remained subdued at under $0.56 for the past three months.

The technical indicators are not looking bullish either. MACD histograms are red, with the trend following lines crossing close to the neutral point. The Stochastic Oscillator is at the lowest point since July 13.

At 11, the momentum indicator is at the oversold zone and could be due for a bounce back. However, with the momentum being bearish, the token must flip $0.56 to welcome any bullish sentiment.

Concluding thoughts

ADA has retested a key support level. The technical and fundamentals are pointing to more bearish pressure. A bullish momentum can only be possible past the $0.56 resistance.

The post Cardano retests key support amid bearish sentiment and testnet concerns appeared first on CoinJournal.

Why is EOS performing positively in the middle of a bear run?

The cryptocurrency market has started the week in a poor fashion, but EOS is currently the best performer amongst the top 100 cryptocurrencies by market cap.

EOS, the native token of the EOSIO ecosystem, is the best performer amongst the top 100 cryptocurrencies by market cap. EOS is up by more than 4% in the last 24 hours, outperforming the other major coins and tokens in the process. 

The cryptocurrency market has lost more than 2% of its value today, resulting in the total market cap dropping below $1 trillion for the first time this month.

Bitcoin is down by more than 1% in the last 24 hours and is struggling to maintain its price above the $21k resistance level. Ether, the second-largest cryptocurrency by market cap, is down by more than 3% today and could drop below the $1,500 resistance level soon.

EOS’s rally comes as the community continues to prepare for the cryptocurrency’s rebrand. 

The EOSIO rebrand would also lead to the fork of the EOS coin. According to the team, the EOS Network Foundation would soon be in charge of the EOS blockchain. 

Key levels to watch

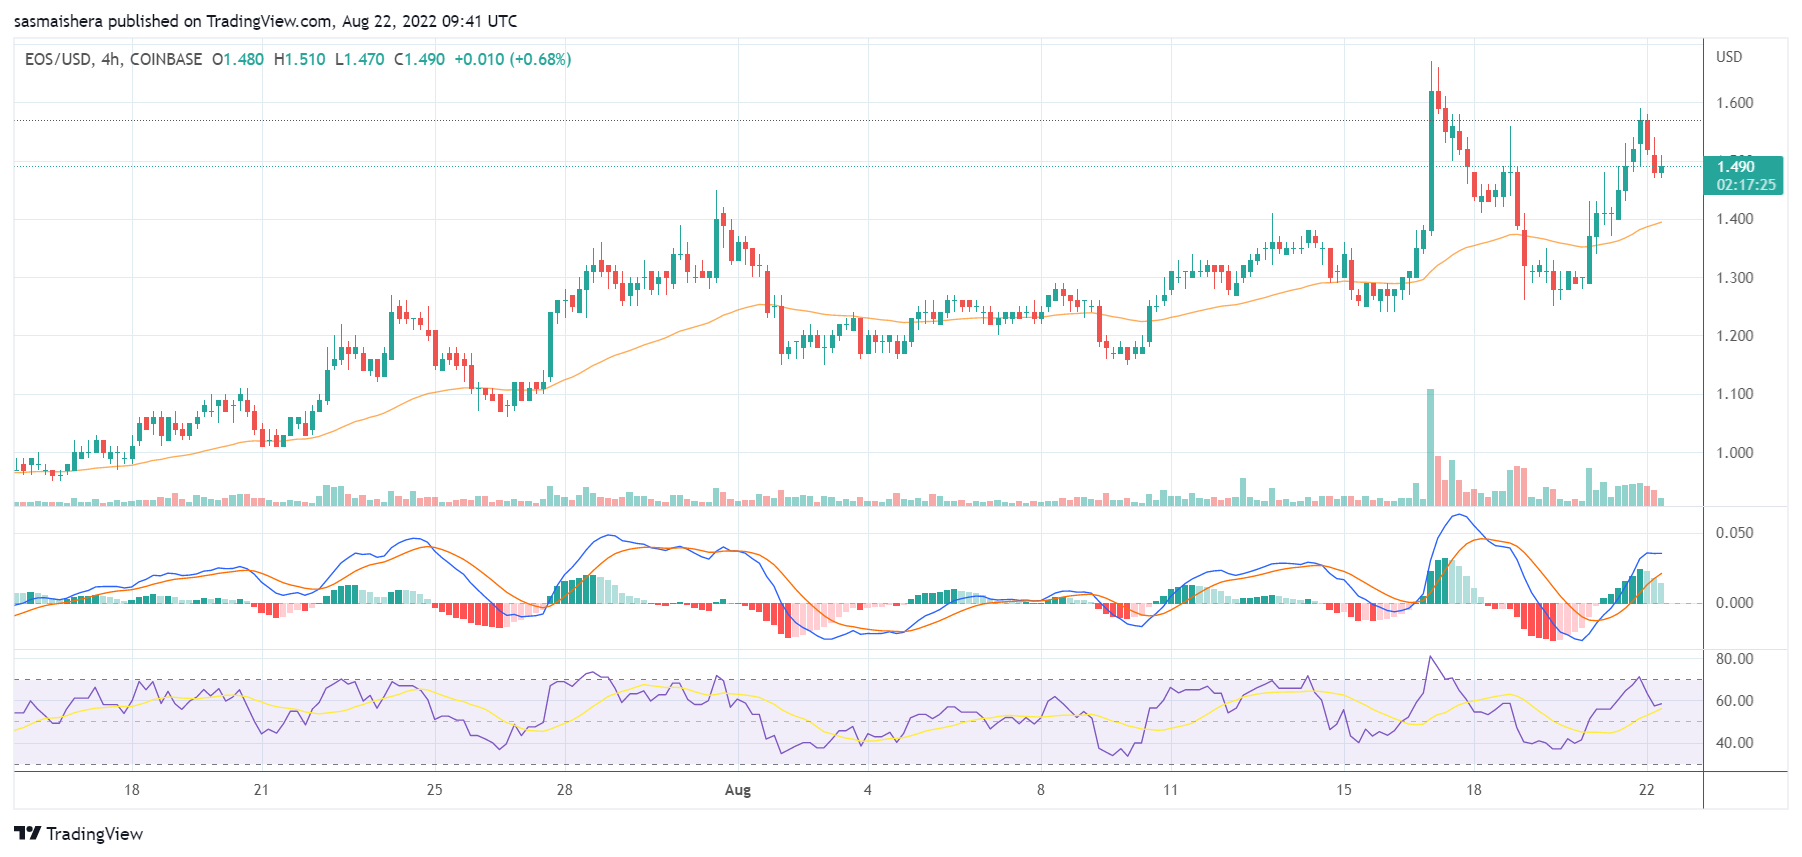
The EOS/USD 4-hour chart continues to be bullish despite the broader cryptocurrency market underperforming at the moment. The technical indicators show that EOS is outperforming the broader crypto market at the moment.

The MACD line remains above the neutral zone, indicating EOS’s bullish momentum at the moment. The 14-day relative strength index of 57 shows that EOS could be heading towards the overbought region if the rally can be sustained.

At press time, EOS is trading at $1.480 per coin. If the positive momentum is maintained, EOS could surge past the $1.585 resistance level. In the event of extended bullish momentum, EOS could surpass last week’s high of $1.671 over the next few hours or days.

The bears are still in control of the broader market, and that could affect EOS’s performance in the short term. If that happens, EOS could drop below the $1.362 support level before the end of the day.

The post Why is EOS performing positively in the middle of a bear run? appeared first on CoinJournal.

SSV Network price prediction as it defies gravity. Is it a buy?

The SSV Network price has defied gravity in the past few weeks even as other cryptocurrencies recoil. The token’s price jumped to a high of $17.50, which was the highest level since April 20th. It has jumped by over 276% above the lowest level in July, bringing its total market cap to about $103 million.

What is SSV and why is it rising?

SSV Network is a relatively small blockchain project that enables developers to build ETH staking applications. Some of those applications are staking pools, staking services, and solo stakers. Some of the top projects building on SSV’s infrastructure are Stader, Ankr, Swell Network, and Blockscape among others.

SSV Network price has jumped sharply in the past few weeks as investors wait for the upcoming Ethereum merge event. Merge is an important process that will transition Ethereum from a proof-of-work (PoW) to a proof-of-stake (PoS) platform.

As a result, Ethereum will become a substantially fast and cost-effective blockchain platform. Transactions per second (TPS) will rise from about 20 to over 1,000. At the same time, the average transaction cost will drop to just cents. This transition also explains why ETH price has jumped sharply in the past few days.

SSV price has also risen because of the growing adoption of the platform. Some of the top companies that have partnered with the network are Coinbase Ventures, Delight Labs, Everstake, and Huobi Pool among others.

SSV Network price prediction

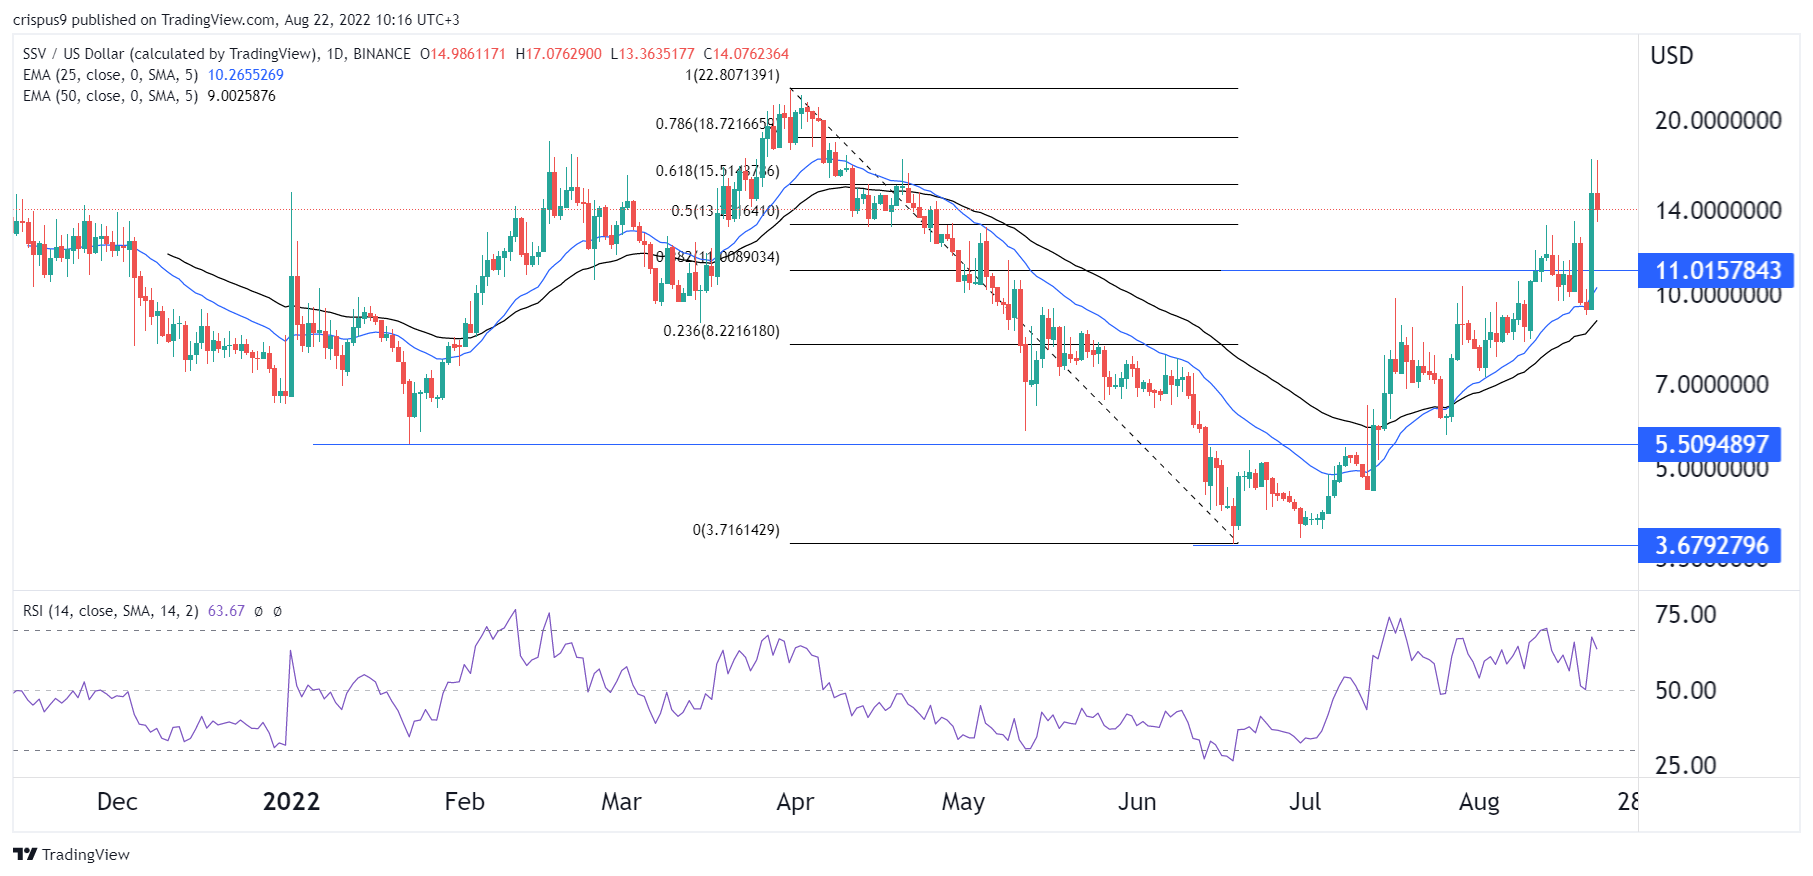
The daily chart shows that the SSV Network price has been in a strong bullish trend in the past few months. The uptrend started when the coin dropped to a low of $3.67 on June 18. As it rose, it managed to move above the important resistance level at $5.50, which was the lowest level on June 22nd.

The coin has managed to move above the 25-day and 50-day moving averages. It also rose above the 61.8% Fibonacci Retracement level. The Relative Strength Index (RSI) has rallied above the neutral level of 50.

Therefore, the coin will likely continue rising as bulls target the next key resistance level at $20. A move below the support at $11 will invalidate the bullish view.

The post SSV Network price prediction as it defies gravity. Is it a buy? appeared first on CoinJournal.