DOT/USD price forecast: A descending triangle keeps bulls at bay

  • DOT/USD is in a triangular consolidation
  • The bias remains bearish
  • Conservative traders might want to wait for the market to move first

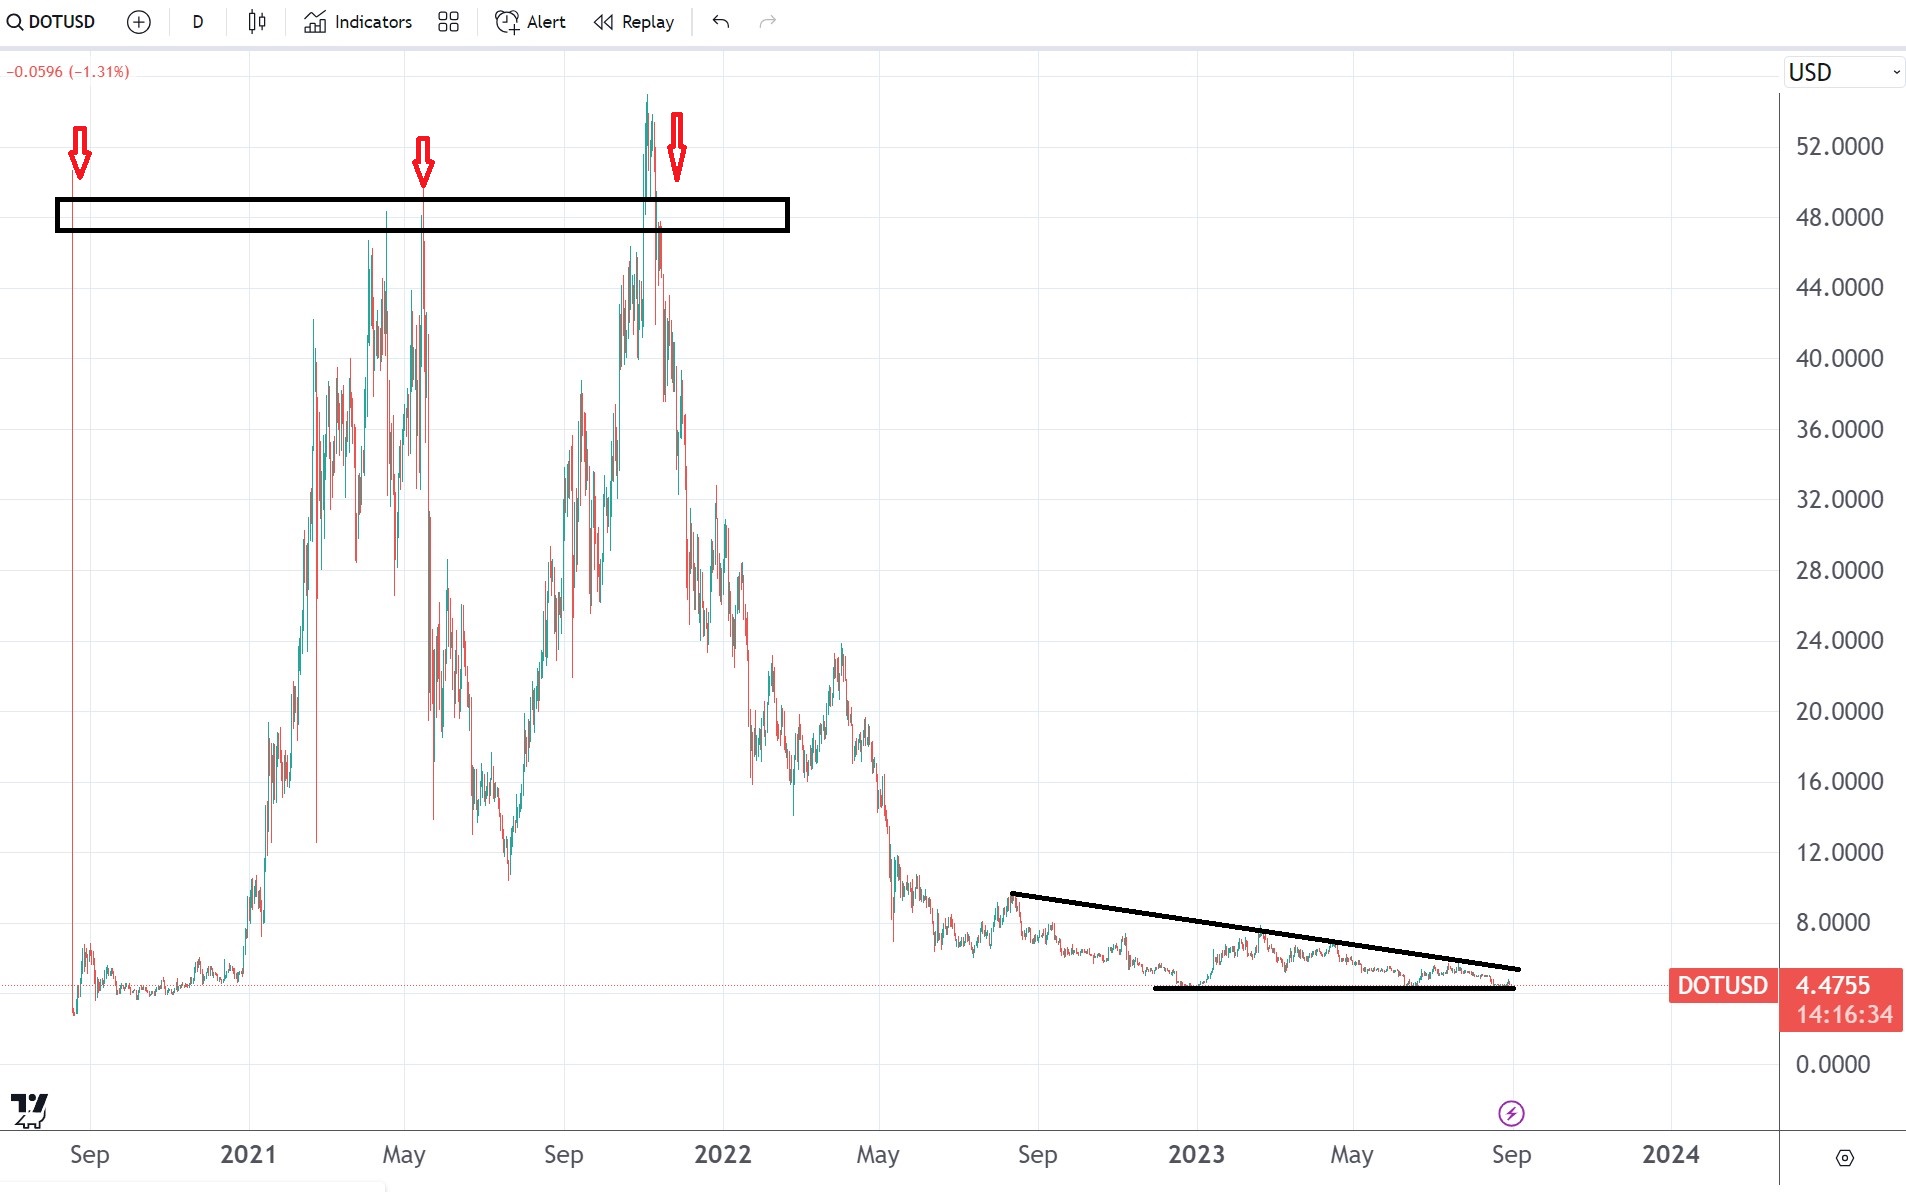
There is nothing positive in the DOT/USD chart for bulls. The price action remains constrained by a triangular pattern that formed in the last twelve months.

Sure enough, the triangle may break in either direction. But the bias is bearish while Polkadot’s price action holds inside the pattern.

Polkadot’s price collapsed after the triple failure at the $50 area. The dollar’s strength was one reason, but surely some other factors contributed to the selloff.

Not even the renewed optimism in the cryptocurrency market that was seen in 2023 was enough. After a small bounce, Polkadot gave away all of its 2023 gains as the market was (and still is) unable to break the lower highs series. At the same time, it pushes for another lower low – a bearish development.
Polkadot chart by TradingView

The bullish case for Polkadot

The only way to construct a bullish case for Polkadot is to wait for the market to move first simply. For a “proof of life,” if you want.

Such proof that the market turned bullish will appear only if the price moves above $8. And, if it holds there.

It would mean that the previous lower high is broken, and the bias turned bullish. Until such a move is seen on the daily chart, buying DOT/USD is risky.

The bearish case for Polkadot

It is easier to build a bearish case because of the descending triangle mentioned earlier. If the market makes a new lower low, the triangle’s measured move points to a drop toward the $1 area.

The post DOT/USD price forecast: A descending triangle keeps bulls at bay appeared first on CoinJournal.
Key US data to move the cryptocurrency market this week

  • The US dollar is at an inflection point
  • Core PCE data today is key
  • The NFP report might miss expectations

Today marks the last trading day of the month. As usual, it means that volatility in financial markets will increase, especially during the London and North American sessions.

The US dollar’s volatility was a main driver for the cryptocurrency market this year. For instance, the dollar weakened since last October, as reflected by the EUR/USD bouncing from 0.95 and rallying to 1.12. At the same time, Bitcoin rallied too.

But as the EUR/USD could not hold above 1.12, nor did Bitcoin and other cryptocurrencies hold at their 2023 highs. In some cases, some cryptocurrencies reversed all of their gains against the dollar – and some more.

Therefore, it is clear that what happens with the US dollar also moves the cryptocurrency market. This week, despite having just two trading sessions left, the US dollar might move aggressively on two pieces of economic data:

  • Core PCE Price Index m/m
  • August NFP report

Core PCE Price Index

The PCE data is the Fed’s favorite way of interpreting inflation. It shows the change in the price of goods and services purchased by consumers but leaves out food and energy prices. The data will be released later today in the North American session.

The market expects it at 0.2% MoM, but the risk is that it will be lower. Jerome Powell, the Fed Chair, stated at the Jackson Hole this August that he believes inflation has peaked. If that is the case and the PCE data confirms it, the dollar might take a hit.

August NFP report

The second part of the Fed’s mandate deals with job creation. For the Fed to stop hiking the funds rate, it must see a softening labor market.

So far this week, both the JOLTS report and the private employment have disappointed. Therefore, the bias is that the NFP report will also come on the soft side. In such a case, the dollar’s weakness should accelerate.

The post Key US data to move the cryptocurrency market this week appeared first on CoinJournal.

Polygon price forecast: Will it hold above $0.5?

  • Polygon erased all of its 2023 gains
  • The technical picture is bearish
  • Only a move above parity will change the bearish bias

What a ride it has been for Polygon investors. Since its inception, the cryptocurrency rallied strongly, only for the move to be faded.

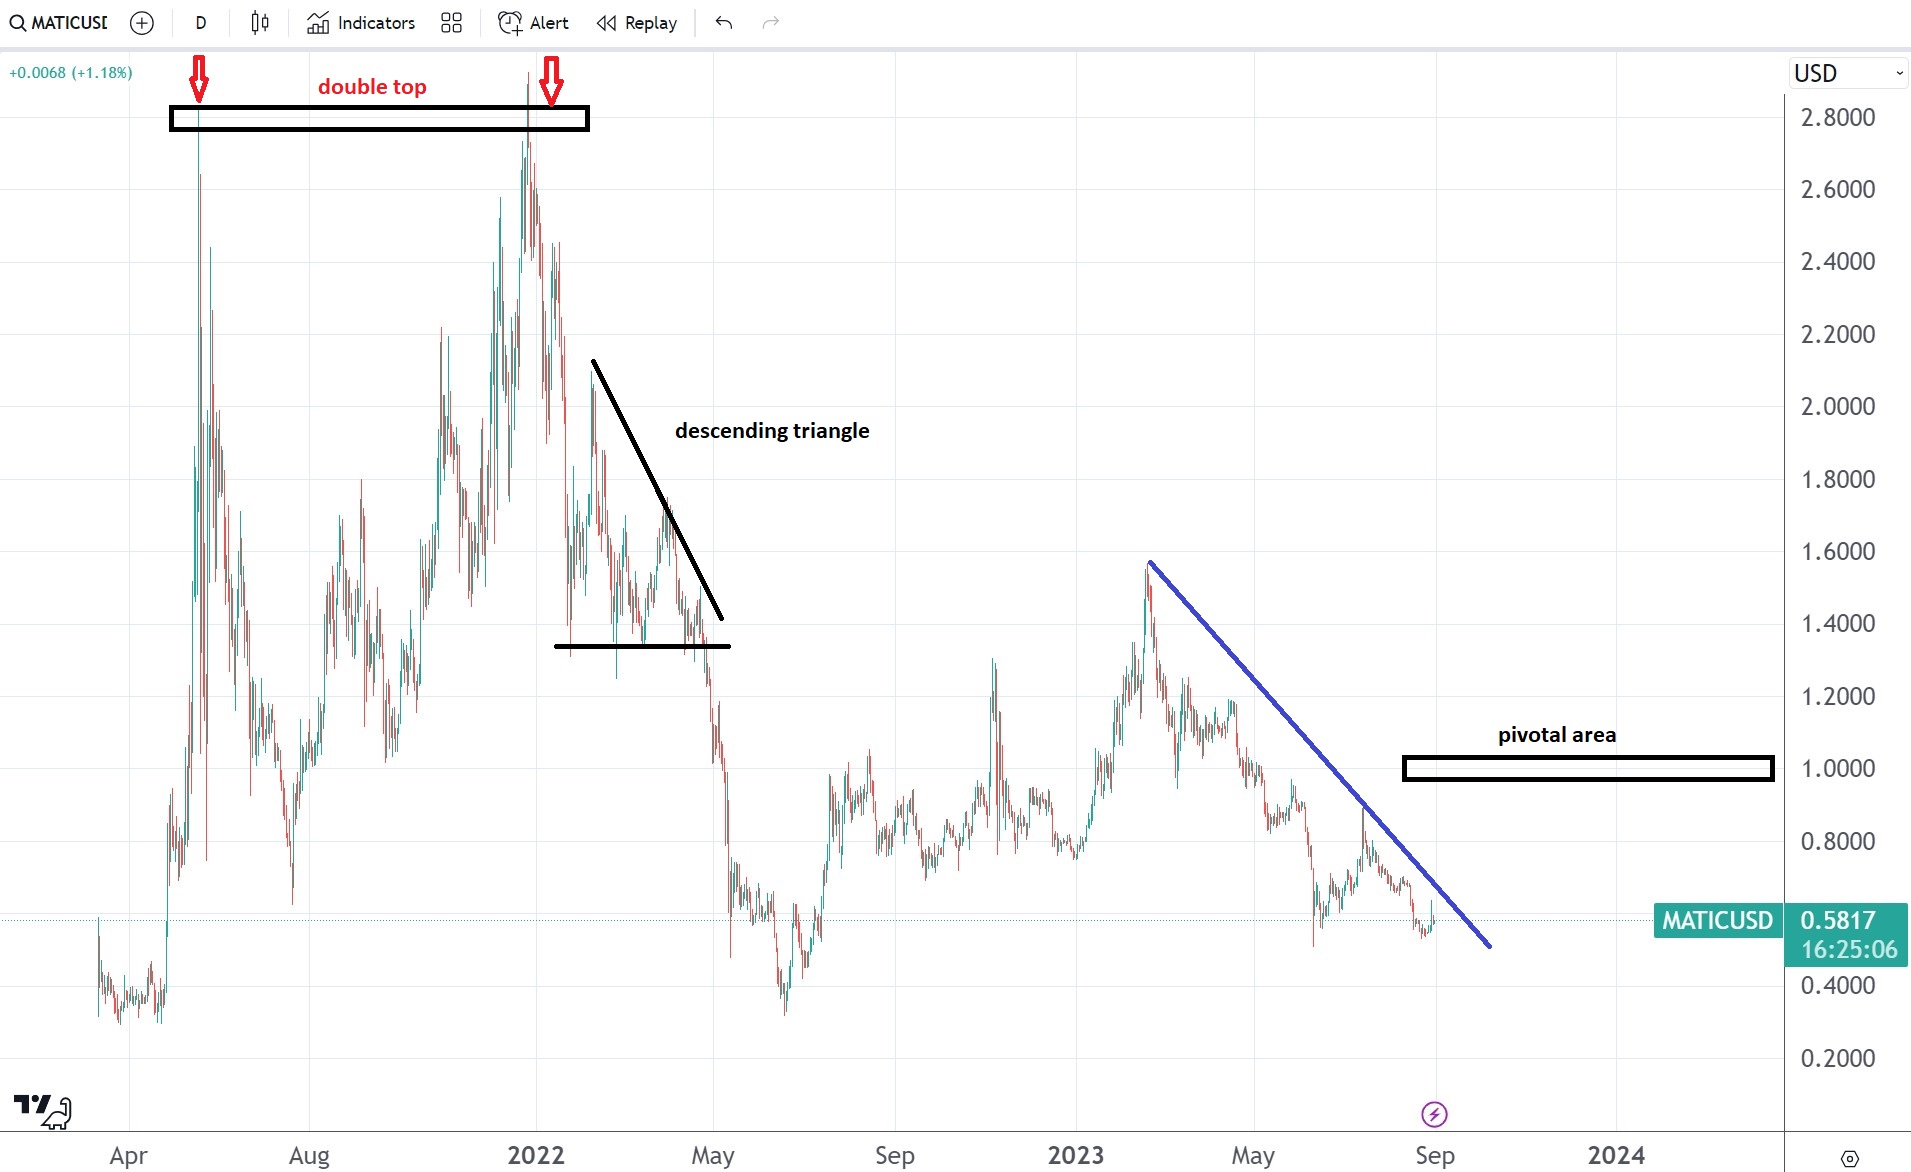
Twice, it had tried at the $2.8 area, failing both times. The market has put a double top pattern there, as it was unable to break above the horizontal resistance area.

Following the double top, it all went wrong for Polygon investors. Another bearish pattern formed, a descending triangle, with a scary measured move for those that bought at the top.

The measured move sent the market all the way down to $ 0.4 before bouncing in the last part of 2022.

When cryptocurrencies rallied at the start of 2023 on the back of Bitcoin’s move higher, optimism emerged again. Polygon rallied, too, trading above $1.4, but those gains are long gone. However, Bitcoin still holds on most of its 2023 gains, which spells trouble for Polygon investors.

Polygon chart by TradingView

Polygon remains bearish while below $1

For the bearish bias to end, the market needs two things. First, it must break the bearish trendline on the chart above. Ideally, it should also break the series of lower highs.

Second, it must trade above parity with the dollar. That is a pivotal level; holding there builds energy for further advances.

The post Polygon price forecast: Will it hold above $0.5? appeared first on CoinJournal.

Dogecoin finds buyers at $0.06, focus shifts to the $0.08 area

  • Dogecoin remains bearish while below $0.08
  • A move above would invalidate the lower highs series
  • A weak US dollar might matter more for Dogecoin than anything else

Not much is happening in the cryptocurrency market lately. Traders used to high volatility levels were disappointed lately.

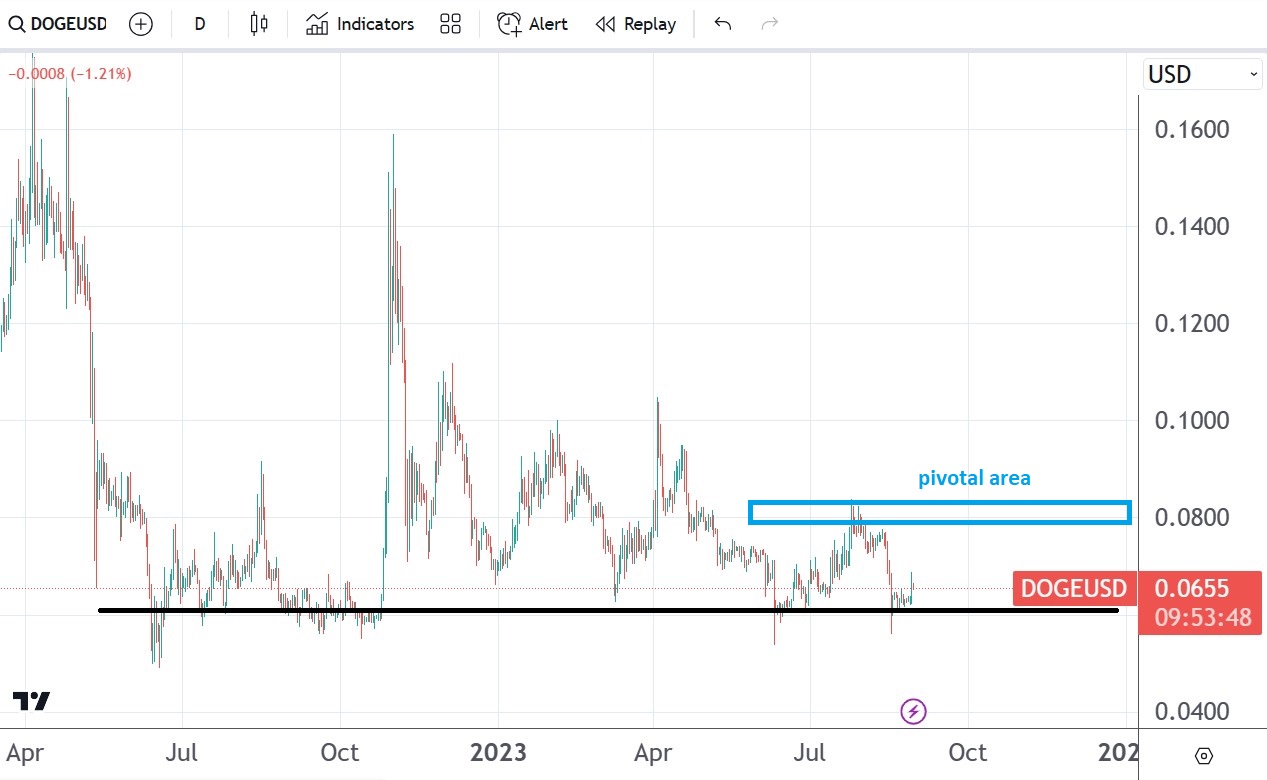
For example, Dogecoin has been in consolidation for more than twelve months. Sure enough, the market bounced several times but only found resistance at the $0.1 level.

Having said that, it does not mean that Dogecoin cannot bounce from these depressed levels. As long as the market holds above $0.06, bulls will try to overcome $0.1. But the critical level to overcome first is $0.08.

By breaking and holding above, the market would invalidate the lower highs series. Therefore, the bias would then shift from bearish to bullish.

Dogecoin chart by TradingView

What can drive Dogecoin higher?

Like it or not, cryptocurrency traders must recognize that volatility is not what it used to be in the crypto market. Sure enough, rallies or selloffs have a larger magnitude than in the traditional currency market, but nevertheless, the amplitude of market movements is not the same anymore.

It can only mean that the cryptocurrency market aligns with the traditional currency market in terms of what drives volatility. Hence,  it is only logical to look at the US dollar and where it might go next.

Recent labor market data suggests that the August NFP report will disappoint. If that is the case, expect the US dollar to continue its downward trend that started yesterday after the disappointing JOLTS report.

The post Dogecoin finds buyers at $0.06, focus shifts to the $0.08 area appeared first on CoinJournal.

Ethereum price prediction: ETH has more short-term upside

  • Ethereum price made a strong bullish breakout on Tuesday.

  • Investors expect companies to launch of several Ethereum ETFs.

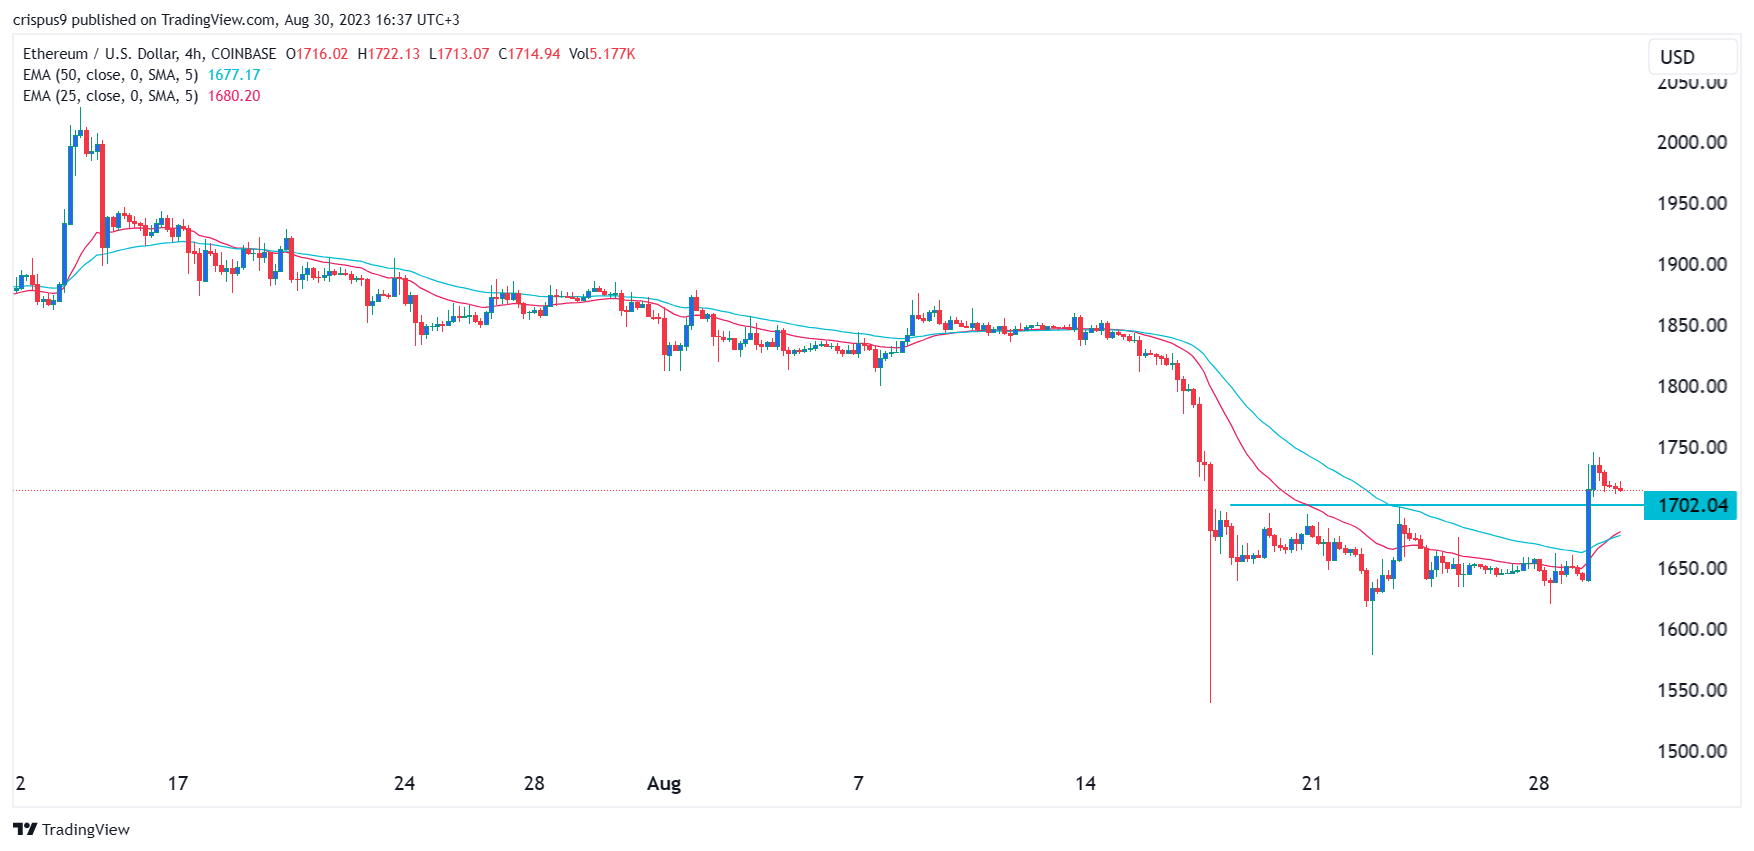
Ethereum price staged a strong recovery on Tuesday as investors remained optimistic about cryptocurrencies. ETH coin jumped to a high of $1,738 on Tuesday, the highest level since August 17th. It has soared by more than 11% above its lowest level this month.

Ethereum ETF next?

The main catalyst for the Ethereum price surge was the decision by a US court to side with Grayscale. The lawsuit emerged from a decision by the SEC to arbitrarily reject Grayscale’s attempt to convert its GBTC ETF into a spot ETF.

In the verdict, the court said that the SEC should review and approve the ETF. As a result, investors hope that the SEC will move on to approve the fund together with those requested by companies like Blackrock, Vanguard, and Invesco.

Grayscale’s initial strategy will likely be to convert the $5.2 billion Grayscale Ethereum Trust (ETHE) into a spot ETF. An ETF operates best because it does not have the discount to Net Asset Value (NAV). Today, the market price of ETHE stands at $11 while the value of holdings stand at $16.72.

Other companies like Blackrock and Invesco could also apply for their Ethereum ETFs. The challenge for Ethereum is that it has become significantly different from Bitcoin. By merging with the Beacon Chain, Ethereum transitioned into a proof-of-stake coin. 

SEC’s Gary Gensler has previously argued that Ethereum, because of its staking features, has transitioned into a financial security. He believes that brokers and exchanges that hold ETH for staking should provide more disclosures to investors.

Analysts believe that the agency has a better chance of convincing a court about Ether being a security than in the XRP case.

Ethereum price prediction

The 4H chart shows that the ETH price moved from a consolidation phase and made a strong bullish breakout. It has moved above the crucial resistance level at $1,702, the highest level on August 23rd. The coin has also moved above the 25-day and 50-day moving averages.

Most importantly, it seems like it is forming a small bullish flag pattern. Therefore, the outlook for the coin is bullish, with the next level to watch being at $1,800. A move below the key support of $1,702 will invalidate the bullish view.

How to buy Ethereum

AVATrade

Ava Financial Ltd operates the AvaFX and AvaTrade forex brands and all business associated with them. The company has a branch office in Dublin, Ireland, which enabled it to get an operational license from the Irish authorities.

Binance

Binance has grown exponentially since it was founded in 2017 and is now one of, if not the biggest cryptocurrency exchanges on the market.

The post Ethereum price prediction: ETH has more short-term upside appeared first on CoinJournal.