Crypto price prediction: Memeainator (MMTR), Chainlink, WorldCoin

  • Memeainator raised more than $300k a few days after starting its token sale.

  • WorldCoin token surged as the developers increased their focus on emerging markets.

  • Chainlink gained traction as demand for its tokenizatioon products rose.

Cryptocurrency prices had a strong performance this week as they defied the gravity we saw in other assets like stocks and bonds. Bitcoin price jumped to over $27,000 even as the Russell 2000 index moved to the bear market. In all, the total market cap of cryptocurrencies jumped to over $1.07 trillion. This article looks at some of the top cryptocurrencies to watch, including WorldCoin, Memeainator, and Chainlink. 

Memeainator analysis

Memeainator (MMTR) was one of the top breakout stars in the crypto industry this week. The developers launched a highly successful token sale on Wednesday, which has raised more than $391k from investors around the world. The token is going for $ 0.011 and is set to continue rising throughout the token sale. It can be bought using ETH, USDT, and USDC.

Memeainator aims to be the biggest meme coin launch this year. For one, unlike other meme coins that lack utility, Memeainator will have genuine utility. For example, the token will provide holders with access and perks when they launch new products like the Memeainator Game and MemeScanner. 

Most importantly, Memeainator will also embrace artificial intelligence (AI), the fastest-growing technology in the world. Just this week, Amazon invested $4 billion in Anthropic, a company that has built a generative AI project. Memeainator will use AI to automate its marketing with the goal of reaching as many people as possible. 

Also, Memeainator is also in the meme coin industry that has created many wealthy people in the past few years. There are countless Shiba Inu, Dogecoin, and Pepe millionaires today. You can read Memeainator white paper here and buy the token here.

WorldCoin price prediction

WorldCoin’s WLD token did well this week as it jumped to a high of $1.90, the highest level since August 10th. The token’s rally was mostly because of the overall crypto rally that we saw during the week.

WorldCoin also rallied after the developers announced plans to expand the network to the emerging markets. It has now signed up more than 2.32 million people using the Orb device, mostly in the developing and EM markets. It is also gaining some traction in some developed countries, especially Portugal, where 1% of the population has signed in,

The 4H chart shows that the WorldCoin price jumped to a high of $1.90, the highest level since August. It has moved above the 25-period and 50-period moving averages. Along the way, the coin has formed a rising wedge pattern. In price action analysis, this is one of the most bearish patterns in the market.

Therefore, there is a likelihood that the token will have a bearish breakout as sellers target the next key support at $1.60.

Chainlink price prediction

Chainlink was one of the top-performing major cryptocurrencies this week as demand for tokenization continued. The LINK token jumped to a high of $8, the highest level since July this year. At its peak, it was up by more than 40% from the lowest level this month. 

Chainlink is being supported by strong fundamentals and the 50-day and 25-day moving averages. It has also formed an ascending channel shown in black while the Relative Strength Index (RSI) has pointed downwards. Therefore, I suspect that the LINK price will retreat slightly during the weekend as investors take profits. This view could see it drop to the key support at $7.50.

The post Crypto price prediction: Memeainator (MMTR), Chainlink, WorldCoin appeared first on CoinJournal.
Bitcoin price sits at inflation point; RSI indicates more upside

  • Bitcoin price remains resilient despite the US dollar’s strength
  • A bullish divergence with the RSI supports Bitcoin’s price action
  • The horizontal consolidation might be part of a bullish flag pattern

This is the last trading week of Q3 2023, and investors already have plans for the last quarter of the year. Bets are made both ways of the dollar, especially since September brought such a strong rally. 

For instance, EUR/USD traded today below 1.05, as the bearish trend from 1.12 continued. Most of the decline was in September. 

Investors bought the dollar and dumped stocks. After all, the Fed is still restrictive and talks hawkish. 

But in all this strong dollar environment, there is one market that, surprisingly, was (relatively) stable. 

Bitcoin. 

Bitcoin chart by TradingView

Bullish divergence with the RSI supports Bitcoin’s bullish case

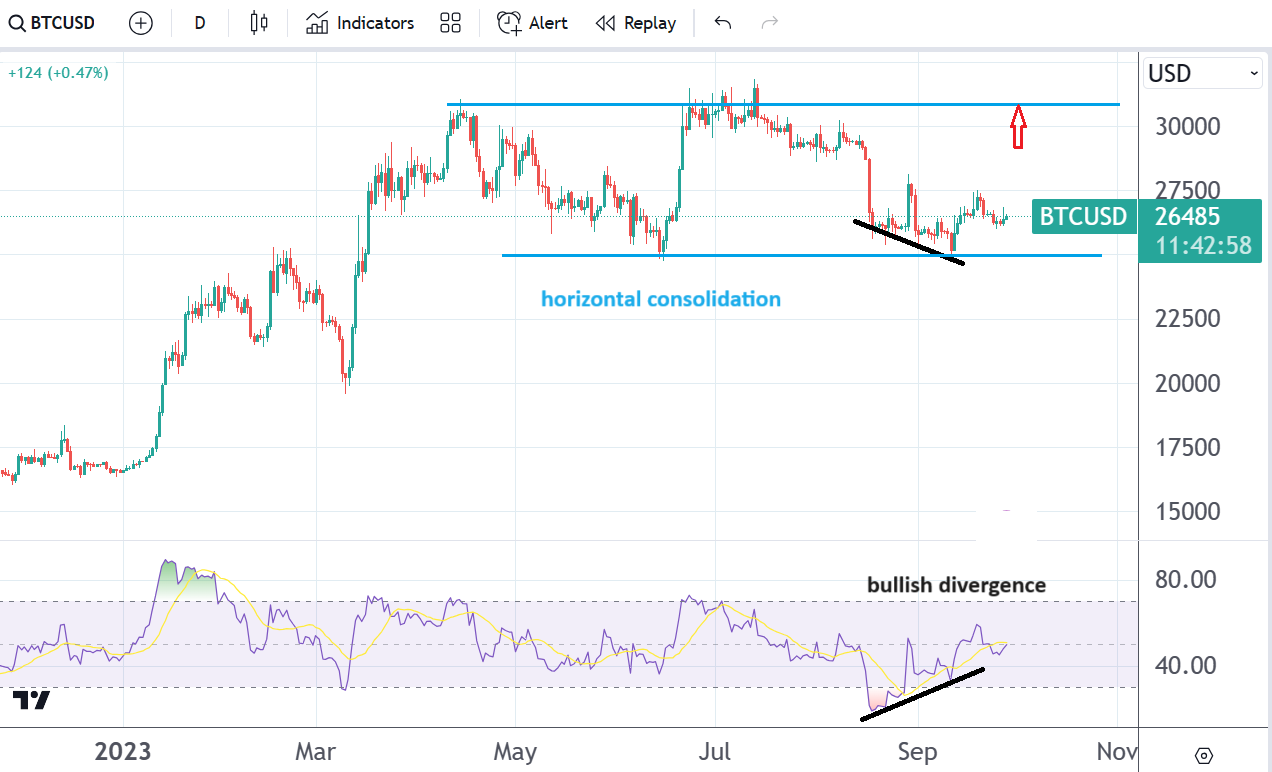
Bitcoin rallied at the start of 2023, jumping from below $17k to above $30k in April. But after that, a horizontal consolidation started, and Bitcoin couldn’t rally anymore. 

However, by staying relatively flat and holding on to most of its gains, Bitcoin shows strength not seen in other markets. When the US dollar rallied, Bitcoin held the ground all this time, albeit it did correct a bit from the yearly highs. 

A quick look at the Relative Strength Index (RSI) reveals a bullish divergence that formed recently. It supports the bullish case for Bitcoin, and now all eyes are on the upper edge of the horizontal channel. 

Speaking of the channel, it may be part of a bullish flag formation. If that is the case, a bullish breakout should be followed by a measured move equal to the rally seen at the start of the year. 

The post Bitcoin price sits at inflation point; RSI indicates more upside appeared first on CoinJournal.

Cosmos (ATOM/USD) outlook: bearish while below $15

  • Cosmos gave up all of its 2023 gains and some more
  • The $15 level acts as a pivotal one
  • The bias remains bearish while trading below resistance

Many cryptocurrency investors were thrilled to see Bitcoin and most cryptocurrencies rallying at the start of 2023. It was supposed to be the start of a new bullish market. 

But some cryptocurrencies, especially the leading ones, hold onto most of their gains. For instance, Bitcoin’s price is still relatively close to its 2023 highs. 

However, this is not the case for smaller projects in the cryptocurrency market. Most of them erased the 2023 gains and some more. 

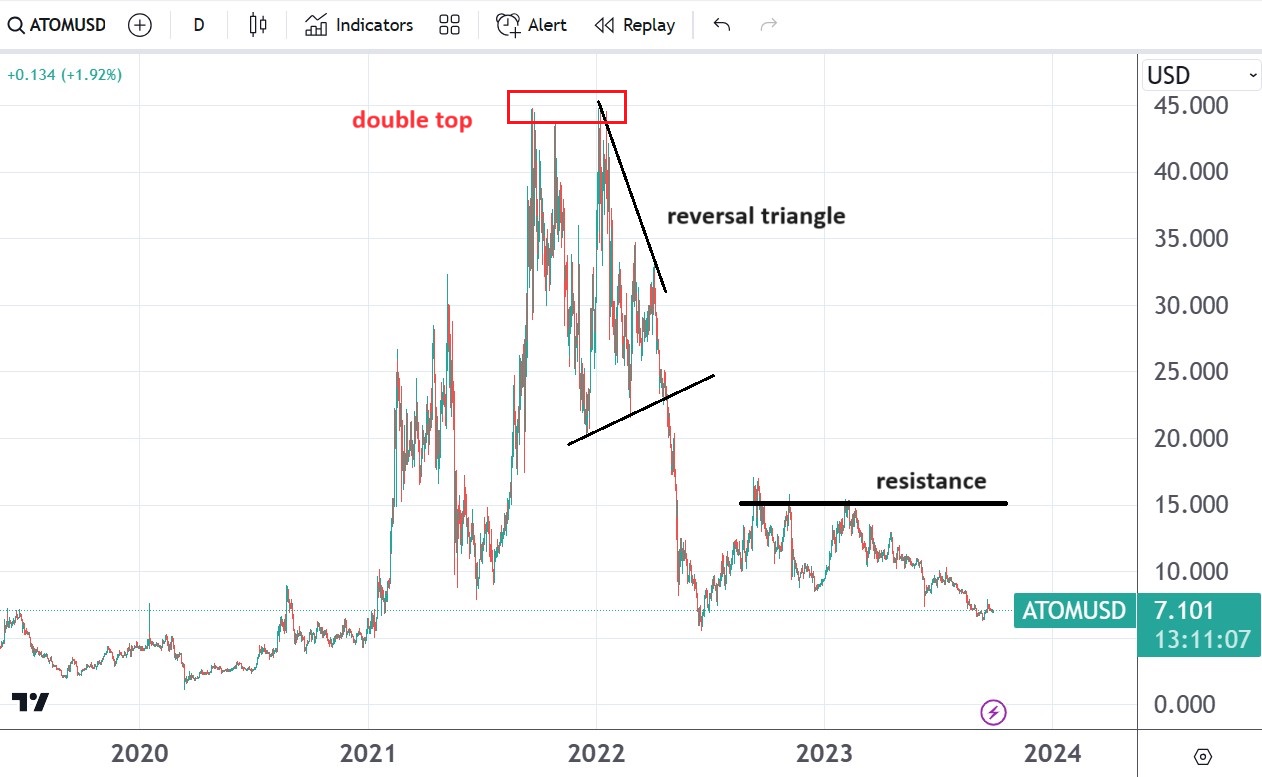
One example is Cosmos (ATOM/USD). It met resistance at the $15 area and then lost more than 50% of its value, erasing all 2023 gains and keeps diving. 

Cosmos chart by TradingView

The daily chart shows a bearish picture while below $15

In 2021, Cosmos reached $45. It failed at the level twice, putting a double top pattern that marked its historically high levels. 

That was the first bearish sign pointing to what was about to follow. 

Next, the market formed a reversal triangle. When it appears at the top of a bullish trend, it implies that a complex correction might have ended. Most of the time, such corrections are fully retraced. Hence, the break below $25 in the first half of 2022 should not have surprised anyone. 

Finally, the most recent price action is not encouraging either. The constant failure at $15, which proves to be strong resistance, keeps a bearish bias on Cosmos. Only a daily close above would shift the bias from bearish to bullish. 

The post Cosmos (ATOM/USD) outlook: bearish while below $15 appeared first on CoinJournal.

Hedera (HBAR/USD) technical analysis as it struggles at support

  • Hedera struggles at dynamic support
  • If the US dollar weakens and Hedera fails to follow, it suggests internal problems
  • Bulls may want to see a daily close above $0.07

Bitcoin rallied at the start of 2023 and triggered similar rallies in all corners of the cryptocurrency market. Even less known and popular projects, such as Hedera, benefited from Bitcoin’s bullish breakout. 

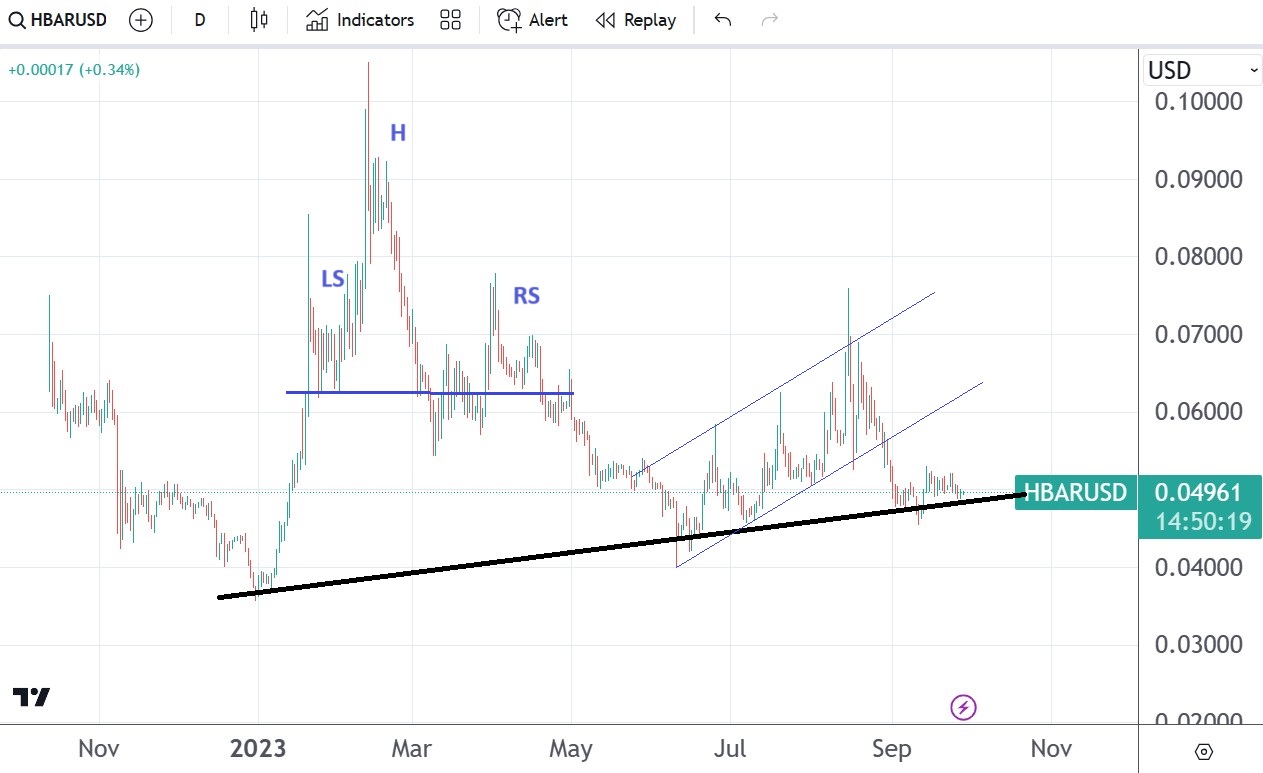
HBAR/USD surged from $0.04 to $0.1 in less than three months. It appeared like only the sky was the limit, but reality settled in slowly. 

Fast forward several months, and Hedera gave back all of its gains. Moreover, it is unable to bounce convincingly, as all rallies are sold. 

Currently, it sits on dynamic support and struggles to hold above. With the US dollar rallying across the board, will HBAR/USD bounce from dynamic support?

Hedera chart by TradingView

The bullish case for Hedera

Bulls have a case as long as HBAR/USD holds above the dynamic support area seen in black on the chart above. 

The daily chart also reveals strong resistance at the $0.06 – $0.07 area. A daily close above there, especially above $0.07, would reinforce the bullish case. 

For that to happen, the US dollar must turn. It rallied over the summer months, and now that September ends, it may turn. In fact, it is the only option for Hedera to make a bullish reversal, given that the dollar was in the driving seat all year. 

The bearish case for Hedera

On the flip side, a drop below dynamic support might suggest internal problems. That is particularly the case if the dollar weakens while Hedera fails to rally. 

The post Hedera (HBAR/USD) technical analysis as it struggles at support appeared first on CoinJournal.

Stellar (XLM/USD) fails at $0.2; attention turns to previous support

  • $0.2 proves to be strong resistance for Stellar
  • The US dollar’s strength is responsible for Stellar’s weakness
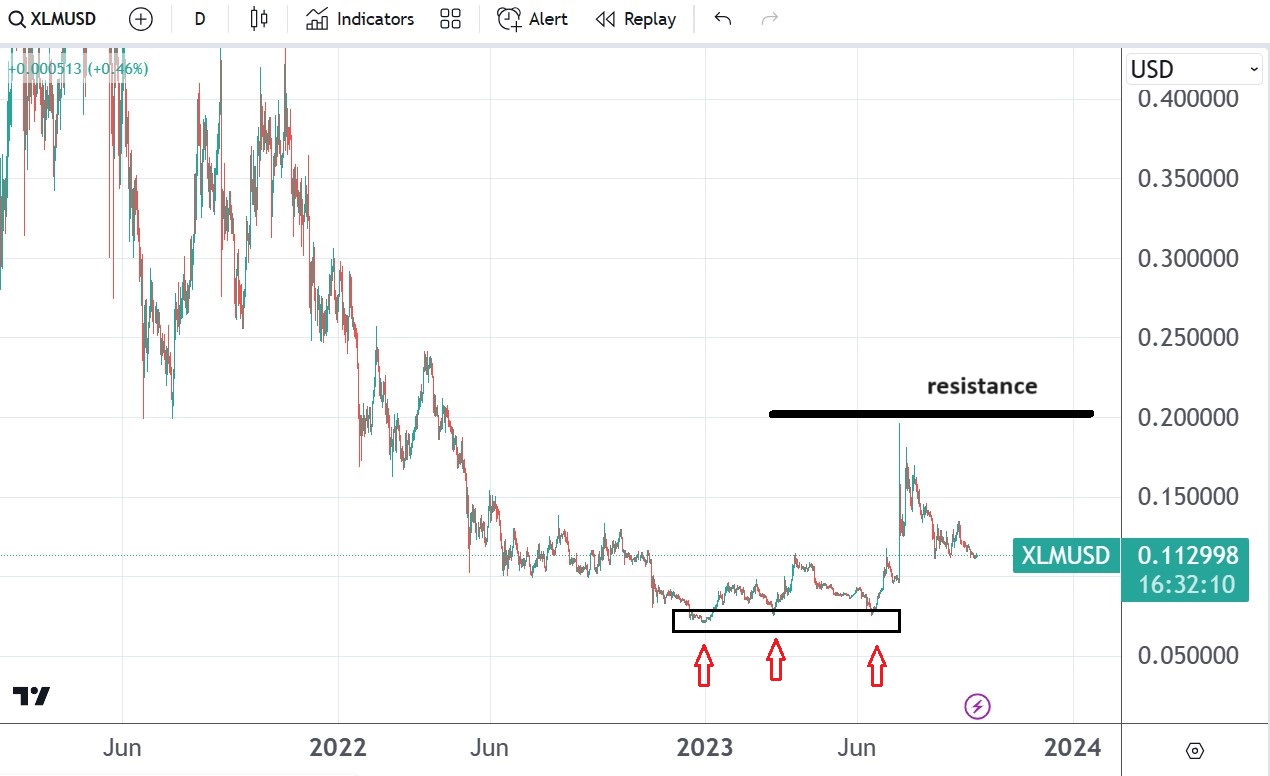
  • Support in the triple bottom area might not hold if the market gets there

The US dollar surged during the summer, putting pressure on equities and fiat currencies. It also pressured the cryptocurrency market, as a higher dollar pressured crypto prices to their lows. 

One example is Stellar (XLM/USD). The bounce during summer to $0.2 seemed to be a reaction to a triple bottom formed earlier. However, it was just a spike in an otherwise bearish trend. 

Bearish market rallies are violent and often lead traders to believe that a sharp reversal might be in the cards. But frequently, they are nothing but spikes. 

In other words, for Stellar to keep rallying above $0.2, the dollar should give up its summer gains. 

Stellar chart by TradingView

How can the dollar turn bearish?

In several ways. 

One is that bond yields come down, and bond prices come up. The massive selloff in the bond market seen recently led to a surge in the demand for greenbacks. 

Another is a consolidation or even a reversal in crude oil prices. Oil rallied over 38% during the summer, triggering lower equity prices, which in turn translated into a strong dollar. 

Finally, the Federal Reserve. While no rate cuts are in the pipeline anytime soon, the central bank’s message is important. 

So far, the Fed prefers to be in the wait-and-see camp. Uncertainty is key, and the balance sheet keeps shrinking. 

Coming back to Stellar, the inability to break above $0.2 resistance might send the price back to support in the area where the triple bottom formed. If that is the case, support is unlikely to hold. 

The post Stellar (XLM/USD) fails at $0.2; attention turns to previous support appeared first on CoinJournal.