OPX Finance token soars 182% in 24 hours: Here’s why

  • Optimism tokens soar after Coinbase news helps inject fresh buying pressure.
  • OPX, VELO and SONNE all spike, with OP also up double digits.
  • Coinbase has launched an Ethereum scaling solution dubbed Base.

OPX Finance (OPX) is one of the tokens to absolutely rip following the latest cryptocurrency news involving the blockchain platform Optimism.

According to data from CoinGecko, the native token OPX has skyrocketed 182% in the last 24 hours, with the decentralised finance ecosystem platform one of the Optimism-based tokens to experience sharp price gains starting Thursday.

As noted here, all that has to do with fresh momentum resulting from news released by major crypto exchange Coinbase. See, on 23 February, the US-based digital assets platform announced the launch of Base, a Layer 2 blockchain that the company said would leverage Optimism’s OP stack.

It is the news of Base, the new Ethereum L2 scaling solution by Coinbase, which saw buying pressure across multiple Optimism ecosystem tokens rise to new levels. And in turn, the ecosystem saw sharp price gains that have contrasted with the sideways action for most top coins.

OPX token leads sharp gains for Optimism ecosystem tokens

As highlighted above, OPX Finance’s governance token OPX is one of the coins to rally hard after the Coinbase announcement. But the token’s price was also helped by news of a successful burn involving 15,200 OPX.

As per CoinGecko data at 6:00 am ET on Friday, OPX price had jumped nearly twofold to push the token’s value from lows of $4.78 to highs of $8.58. The token was 182% up at the time of writing, with its price oscillating near $7.89 amid some profit booking.

Other tokens to see major gains amid the Base L2 launch include Sonne Finance (SONNE). The lending protocol is native to the Optimism ecosystem and its token jumped nearly 90% to highs of $0.44.

DEX platform Velodrome Finance also saw double digit gains, with the price of VELO up more than 20% in the past 24 hours to trade above $0.22.  Meanwhile, perpetual-focused DEX protocol Perpetual Protocol’s native token PERP soared 44% to hit a high of $1.26.

Several other Optimism ecosystem tokens saw increased buyside pressure, and are currently trending alongside OP, which as highlighted, came close to hitting a new all-time high amid the Coinbase news.

The post OPX Finance token soars 182% in 24 hours: Here’s why appeared first on CoinJournal.
Analyst says ‘it doesn’t matter’ as Block reports a hit to BTC revenue in Q4

  • Block reports a 7.0% decline in its fourth quarter bitcoin revenue.
  • Baird analyst David Koning shares his outlook on the Block stock.
  • Shares of the financial technology company are up 15% year-to-date.

Shares of Block Inc (NYSE: SQ) are trading up in extended hours even though the financial technology company reported a year-over-year decline in its bitcoin revenue.

Baird’s analyst reacts to its quarterly update

The San Francisco-based multinational noted a 7.0% hit to its bitcoin revenue in the recent quarter. Reacting to it on CNBC’s “Closing Bell: Overtime”, Baird’s senior analyst David Koning said:

Bitcoin mattered when Block was at $250 a share. At $70, it doesn’t matter. It’s 4.0% of gross profit. I haven’t even looked closely at it, that’s how much it matters.

BTC generated $35 million of gross profit for Block Inc in Q4 – a 25% year-on-year decline related to the slump in bitcoin price. As of December 31st, the company’s bitcoin holdings had a fair value of $133 million.

Koning is keeping bullish on Block stock

In its letter to shareholders, Block revealed a $9.0 million impairment charge related to its BTC investment in Q4 versus $2.0 million only in the prior quarter.

The stock is still trading up primarily because former Twitter CEO Jack Dorsey’s firm reported overall quarterly revenue that came in slightly above the consensus. Baird’s Koning added:

Cash App crushed it. They accelerated well above the Street. And January and February trends accelerating very nicely. Street’s modelling deceleration in Q1. So, the stock should be up nicely tomorrow.

His price target of $85 a share suggests about a 15% upside on where this stock closed the regular session today. For the full year, Block Inc is now calling for $1.30 billion of adjusted EBITDA. Its forecast for gross profit sits at 25% versus 22% in the recent quarter.

The post Analyst says ‘it doesn’t matter’ as Block reports a hit to BTC revenue in Q4 appeared first on CoinJournal.

Optimism price prediction: OP spikes after Coinbase launches Base on OP stack

  • Optimism token OP rose 16% after Coinbase announced the launch of its L2 platform on OP stack.
  • OP price hit highs of $3.10 on Coinbase, not far from its all-time high of $3.19.
  • Gains for the OP token paled in comparison to the staggering 250% spike for BASE, a token unrelated to Coinbase’s L2 Base.

Optimism price surged double digits on Thursday after cryptocurrency exchange Coinbase announced it had launched Base, an Ethereum Layer-2 network.

Like Arbitrum, Optimism is a L2 network that uses Optimistic Rollups to increase transaction speed and reduce gas fees. Its scalable blockchain is one of the top chains in the Ethereum ecosystem.

Optimism price surges 16% on Coinbase news

Sentiment across the OP community flipped bullish as reaction to Coinbase news pushed OP token higher.

According to Coinbase, Base will offer “a secure, low-cost and developer-friendly” platform for people to create, deploy or interact with decentralized apps. The project’s goal is to onboard the next 1 billion or more people into the crypto space, the digital asset platform noted.

Base is built on Optimism’s OP stack, Coinbase announced. 

While the news saw another unrelated cryptocurrency called Base Protocol spike more than 250% amid speculation, the price of Optimism also jumped. However, the native token OP did not rip as much as BASE did, with its price soaring roughly 16% on Coinbase.

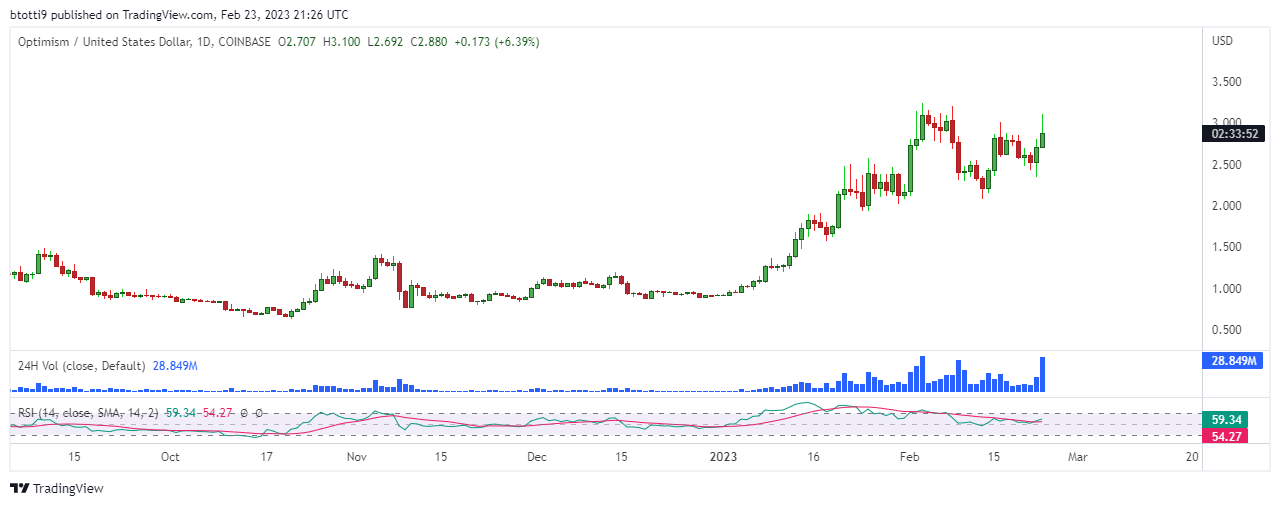
OP surged to above $3.00 on most major exchanges that support the cryptocurrency, including $3.10 on Coinbase. 

OP/USD price chart on Coinbase. Source: TradingView

Market activity was also up, with data from CoinGecko showing trading volume rose nearly 90% in the past 24 hours to over $733 million. Alongside the spike in buyside volume is the bullish flip of the relative strength index, which is upturned to suggest bulls are in control.

Optimism price reached its all-time high of $3.19 in early February this year, and with a positive technical outlook in place, it’s likely OP/USD could go on to hit a new ATH. 

Crypto trader and analyst HornHairs says this is likely if Bitcoin and Ethereum prices break above key resistance zones.

The post Optimism price prediction: OP spikes after Coinbase launches Base on OP stack appeared first on CoinJournal.

Amp price prediction: technical analysis points to a brief pullback

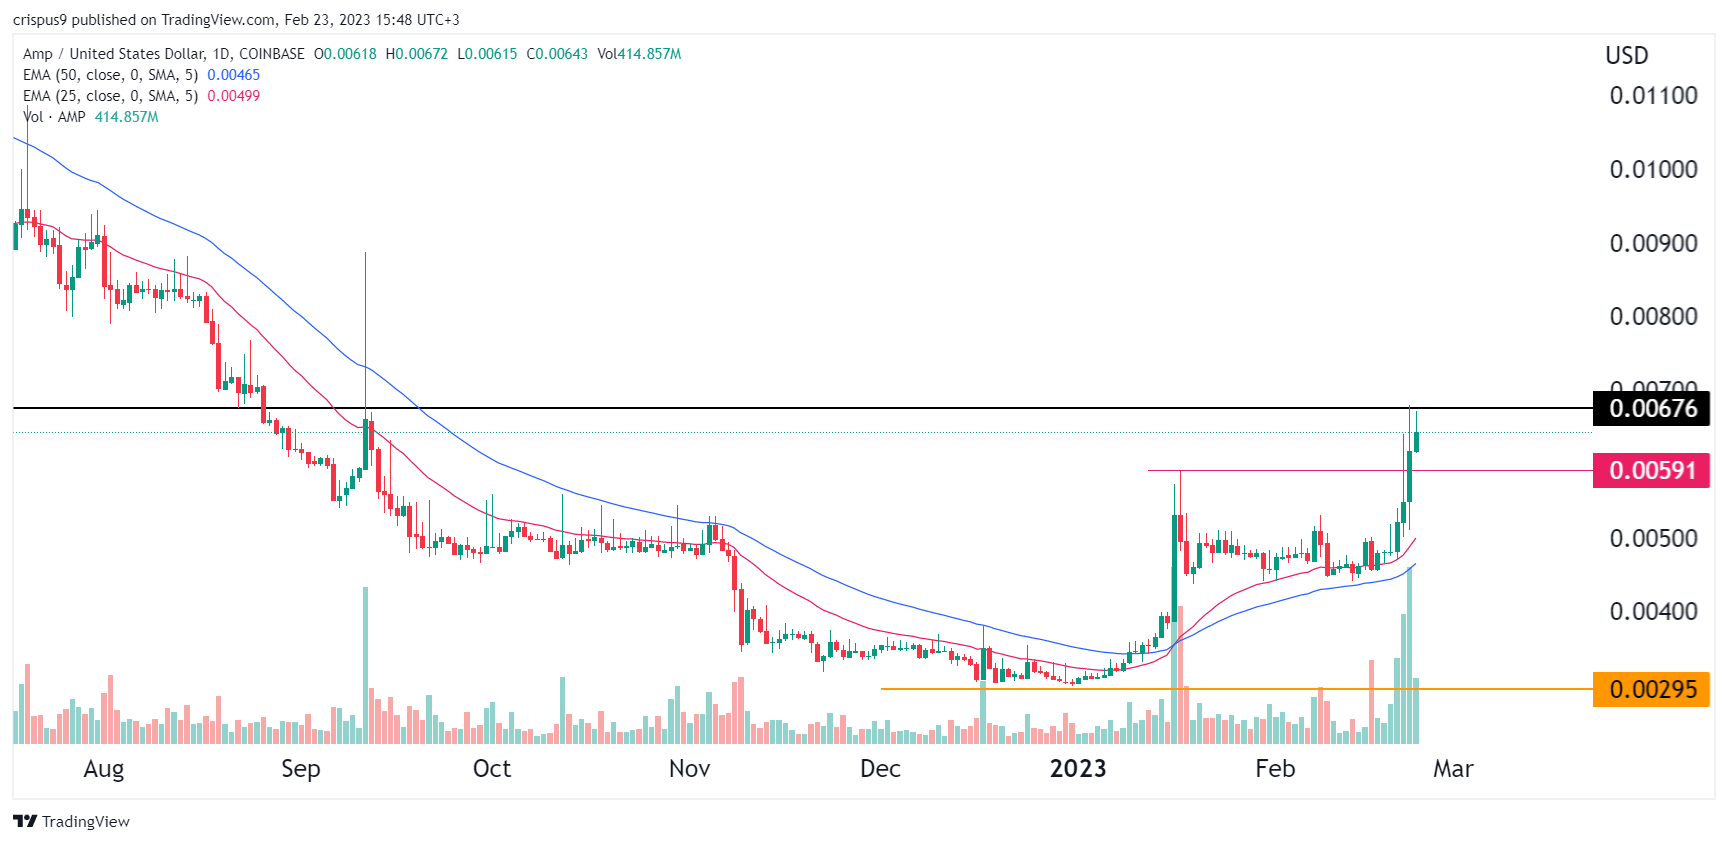
Amp price bullish momentum continued on Thursday as the bullish momentum continued. It rose to a high of $0.0067, the highest point since September 11 last year. Like most crypto tokens, it has jumped by more than 121% from the lowest level last year.

It is unclear why Amp token is rising even as its on-chain metrics continue deteriorating. On-chain metrics show that the number of people using and holding Amp was relatively negligible. For starters, Amp is a blockchain that helps people provide collateral of their assets in a relatively easy process. 

There have been no major Amp-related news in the past few days. The most relevant is the decision by New York prosecutors to sue CoinEx, a small crypto exchange. In a statement, New York’s attorney general said that the company offered securities in its platform. It cited tokens like Amp, Luna, and RLY. The statement added that:

“The Tokens are also securities under the Martin Act because they represent investments of money in common enterprises with profits to be derived primarily from the efforts of others.”

Amp price prediction (daily chart)

The daily chart shows that the Amp crypto price has made a strong recovery in the past few days. It has managed to move above the key resistance level at $0.0059, the highest point on January 17th. The coin has also jumped above the psychological level at $0.0050. 

Further, it has moved above the 25-day and 50-day moving averages while oscillators like the Relative Strength Index (RSI) and the MACD have kept rising. Notably, these gains are happening at a period of high volume. 

Therefore, I suspect that Amp has some more upside to go. If this happens, the next level to watch will be at $0.008. However, a drop below the support at $0.0060 will invalidate the bullish view.

Amp crypto forecast (4H chart)

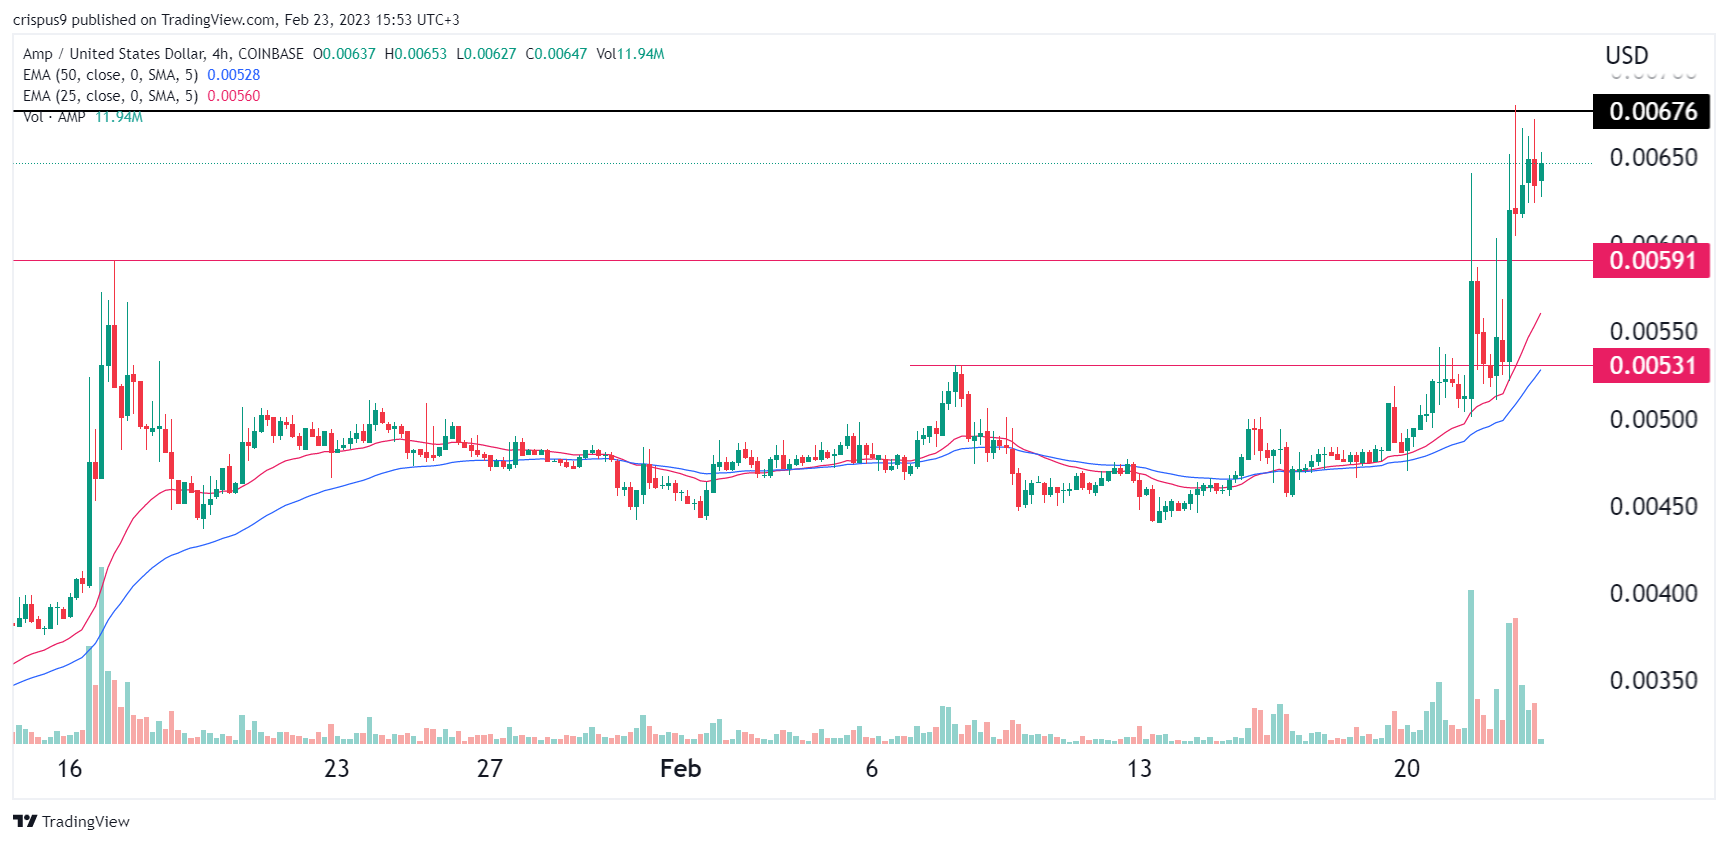
On the four-hour chart, we see that the Amp price has been in a bullish trend as well. It has managed to cross several levels, including the resistance point at $0.0053 and $0.0059, the highest points on Feb 8 and Jan 7, respectively. Like in the daily chart, the token remains above all moving averages. The only difference is that volume has started moving downwards. 

Therefore, with other coins like Bitcoin and ETH retreating, there is a likelihood that Amp will also decline and retest the support at $0.0060.

How to buy Amp

As AMP is such a new asset, it’s yet to be listed on major exchanges. You can still purchase AMP using a DEX (decentralised exchange) though, which just means there are a few extra steps. To buy AMP right now, follow these steps:

1. Buy ETH on a regulated exchange or broker, like eToro ›

We suggest eToro because it’s one of the world’s leading multi-asset trading platforms, an exchange and wallet all-in-one with some of the lowest fees in the industry. It’s also beginner-friendly, and has more payment methods available to users than any other available service.

2. Send your ETH to a compatible wallet like Trust Wallet or MetaMask

You’ll need to create your wallet, grab your address, and send your coins there.

3. Connect your wallet to the 1Inch DEX

Head to 1Inch, and ‚connect‘ your wallet to it.

4. You can now swap your ETH for AMP

Now that you’re connected, you’ll be able to swap for 100s of coins including AMP.

The post Amp price prediction: technical analysis points to a brief pullback appeared first on CoinJournal.

XRP/USD price forecast amid a +13.19% YTD performance

  • Ripple’s rally lags behind other cryptocurrencies’ rallies for 2023
  • A bullish flag pattern suggests more upside
  • Once the bullish flag is confirmed, a double bottom pattern projects the price even higher

Ripple rallied against the US dollar in 2023 as the entire cryptocurrency market bounced. However, unlike Bitcoin, Ripple rallied less.

One explanation may come from the current consolidation. The chart below shows the daily timeframe, and the recent price action reveals a tight range lasting several weeks.

So what does the technical picture says about XRP/USD?

XRPUSD chart by TradingView

Bullish technical setup for XRP/USD, providing the 2023 lows hold

A double top pattern may be spotted on the left side of the chart. Ripple failed twice at $0.9 before reversing sharply.

It declined in line with the overall cryptocurrency market as investors fled, scared of scams and after losing faith in various crypto projects.

A double top is a reversal pattern. The key to trading the pattern is waiting for the price to move below the neckline.

Then, projecting the measured move, one can determine the minimum distance the market should move to confirm the reversal.

After the reversal pattern was confirmed by the price action reaching the measured move, Ripple entered a long period of consolidation. Ripple trades in a tight range against the dollar for almost eight months now. That is, a tight range considering the cryptocurrency market standards.

Currently, one can spot two bullish factors for Ripple. First, a double bottom pattern might be in the makings. Still incomplete, it points to $0.7 should the price move above the neckline.

Second, the most recent price action looks like the flag of a bullish flag pattern. If it is confirmed by future price action, then the measured move points to a break above the double bottom’s neckline.

To sum up, the bullish flag’s measured move exceeds the double bottom’s neckline. Hence, bulls may want to buy on a daily close above $0.45 and place a take-profit at $0.7.

The invalidation point of this bullish setup is a move below $0.3.

The post XRP/USD price forecast amid a +13.19% YTD performance appeared first on CoinJournal.