iZUMi Finance price: profit deals dump IZI after KuCoin listing

  • iZUMi Finance (IZI) price dropped over 15% amid massive profit taking.
  • The dump followed the token’s listing on major crypto exchange KuCoin.
  • But while price could fall below $0.030, the cryptocurrency’s strong ecosystem growth could see increased IZI demand and aid price uptick down the road.

iZUMi Finance (IZI) price fell more than 15% early Wednesday as the cryptocurrency’s market defied broader crypto prices outlook. IZI traded to lows of $0.032 as sell pressure mounted following the coin’s listing on major crypto currency exchange KuCoin.

The dump is likely a “sell the news” scenario as the price of iZUMi Finance rose exponentially over the past few days. This after KuCoin announced it would list the native token of the multi-chain decentralised finance (DeFi) protocol.

Even with today’s dip, IZI/USD was still trading more than 26% up in the past seven days and over 280% up in the past two weeks.

iZUMi Finance price: sellers in control for IZI/USD

While current price outlook suggests sellers might push IZI lower, the cryptocurrency is poised at a horizontal demand zone that has helped bulls for much of April. That suggests the profit taking could give way to new upside momentum.

As for immediate price outlook, IZI/USD is likely to trade lower if bulls fail to keep $0.030. The hourly chart shows the token is trending towards the oversold territory though and could thus be due an upward flip should the $0.02 base hold. Otherwise, a dip to $0.011 could happen.
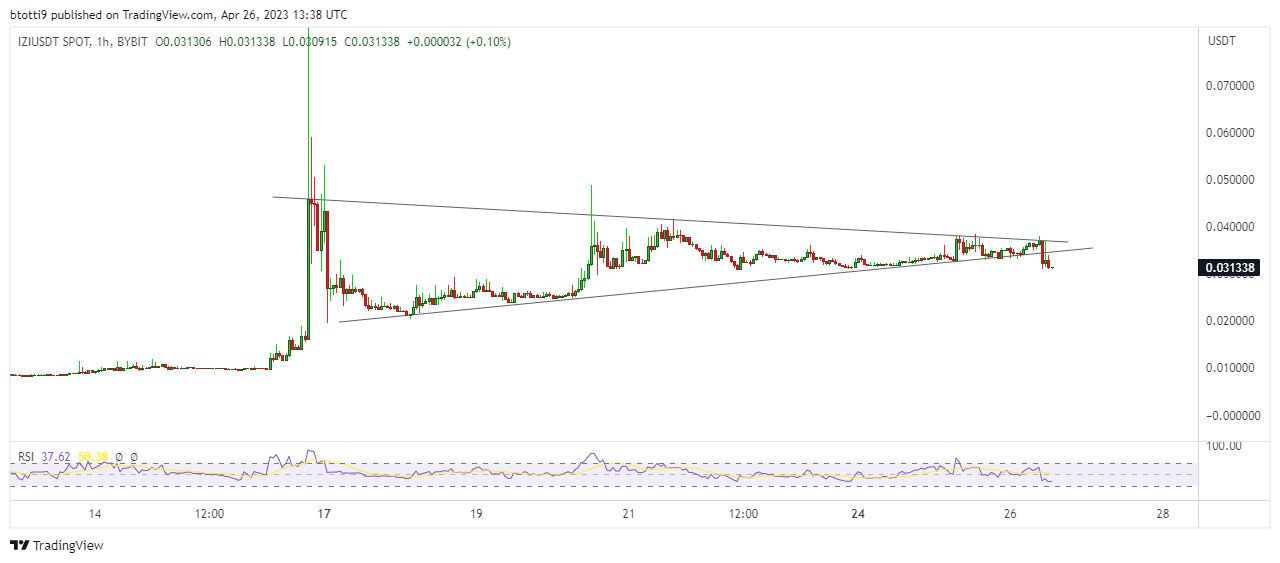
IZI price on the hourly chart. Source: TradingView

iZUMi Finance long term outlook: network strength key

A look at Izumi Finance’s network performance shows decent growth in total value locked (TVL). According to data on DeFiLlama, the TVL has risen sharply in the past 10 days – from under $2 million to over $25 million as of 26 April 2023.

The DeFi protocol’s products iZiSwap, LiquidBox and DAO veNFT among others are also seeing greater uptake across the market. Indeed, the platform announced on Wednesday that it had closed a $22 million financing round for the on-chain order book iZiSwap Pro.

The iZiSwap recently launched on zkSync Era, a future-proof zkEVM network helping to scale the Ethereum blockchain.

Other than the KuCoin, iZUMi has also struck key partnerships with MEXC Global, Bybit, Woo Network, and BitDAO. iZUMi also has a security partnership with auditing platform secure3io.

Building a strong platform amid the network pillars could inform long term demand for IZI and aid its price.

The post iZUMi Finance price: profit deals dump IZI after KuCoin listing appeared first on CoinJournal.
Band Protocol (BAND) and NEM (XEM) price prediction as Bitcoin bounces to $29k

  • Band Protocol (BAND) price was up 16% to $1.90 as major exchanges including Binance announced support for its network upgrade.
  • The uptick in cryptocurrency prices, with Bitcoin (BTC) price bouncing to $29,000, also saw NEM (XEM) price rise 4% to $0.04.
  • The price prediction for BAND and XEM is for a continued bullish flip, although buyers need to hold critical support levels.

Bitcoin (BTC) flipped higher from key support that has held over the past few days, with the bump to $29,000 providing a fresh bullish outlook for the cryptocurrency. With BTC price 6% up in the past 24 hours and crypto bouncing as new concerns hit the banking sector, a few altcoins look primed to make some decent moves.

Band Protocol (BAND) and NEM (XEM) are green today, but what’s their short term price outlook?

Band Protocol price prediction: BAND bullish above critical support level

The Band Protocol network upgrade is coming on 27 April 2023 and the native BAND token is surging. Major exchanges, including Binance are set to support the upgrade, and that has the community excited. But what’s the BAND price outlook? 

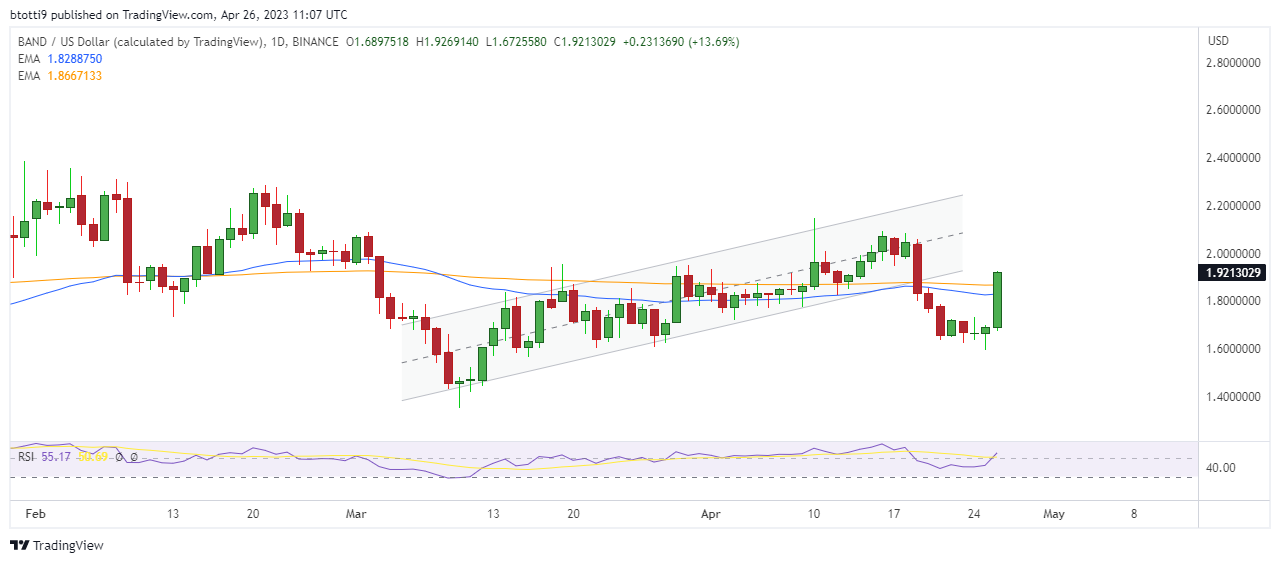
BAND/USD recently broke down from a rising parallel channel on the daily time frame to hit support around $1.65. Today’s double digit gains (BAND price is up 16% at the time of writing) has the coin trading above both the 50-day and 200-day exponential moving averages.

While the upside momentum is likely to push the price of Band Protocol higher, the key resistance zone is at the $2.0 psychological level. A bullish performance over the next few days could see buyers target $2.8.

On the downside, failure to consolidate gains above the $1.8 level could leave sellers eyeing $1.33.

Band Protocol price chart. Source: TradingView

NEM price prediction: can XEM break higher this time?

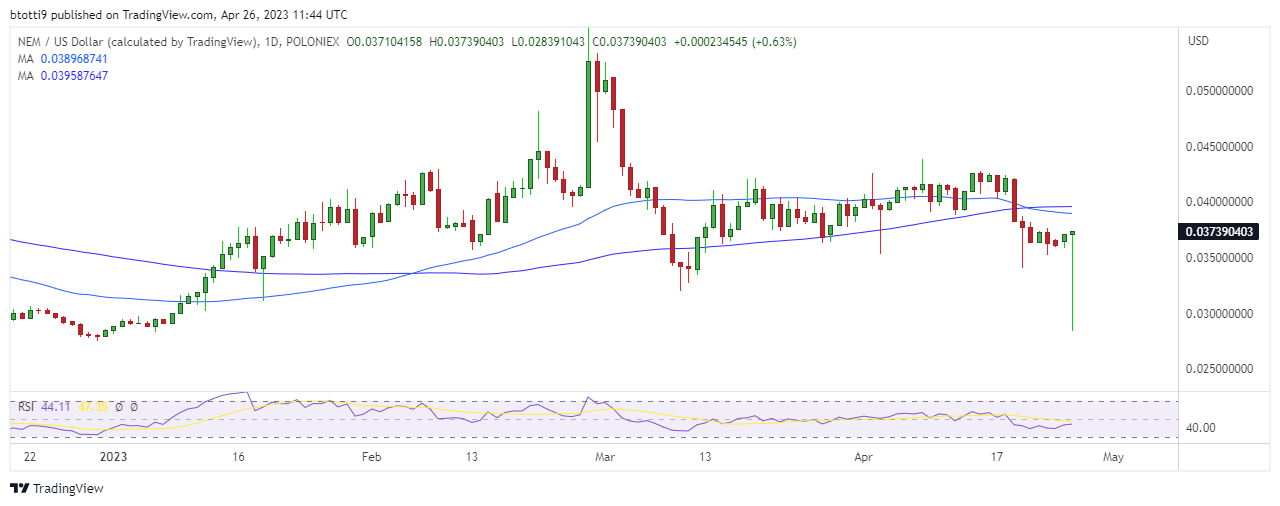
The XEM cryptocurrency has largely plateaued since its descent from highs of $0.77 reached in March 2021. Having corrected to lows of $0.028 in December 2022, XEM/USD flipped positive to hit $0.056 in February 2023.

The cryptocurrency retested the $0.028 support level again today, 26 April 2023. But bulls are battling to recoup gains amid the overall crypto bounce.

The coin currently trades near $0.04, with about 4% upside in the past 24 hours. But XEM remains negative on the week and in the past 30 days, trading 11% and 5% down respectively over these time frames.

XEM price outlook on the daily chart. Source: TradingView

A bearish crossover preceded the dip to the multi-month low and buyers have to reclaim $0.04 to extend today’s upside. Also, the daily RSI below the 50 line does not suggest much joy for bulls and a potential downward break to $0.033 and then $0.028 is a more likely short term scenario.

The post Band Protocol (BAND) and NEM (XEM) price prediction as Bitcoin bounces to $29k appeared first on CoinJournal.

Why is the Render Token (RNDR) price surging?

  • Render Network’s token jumped sharply on Wednesday.

  • The community passed two key votes: RNP – 002 and RNP – 003. 

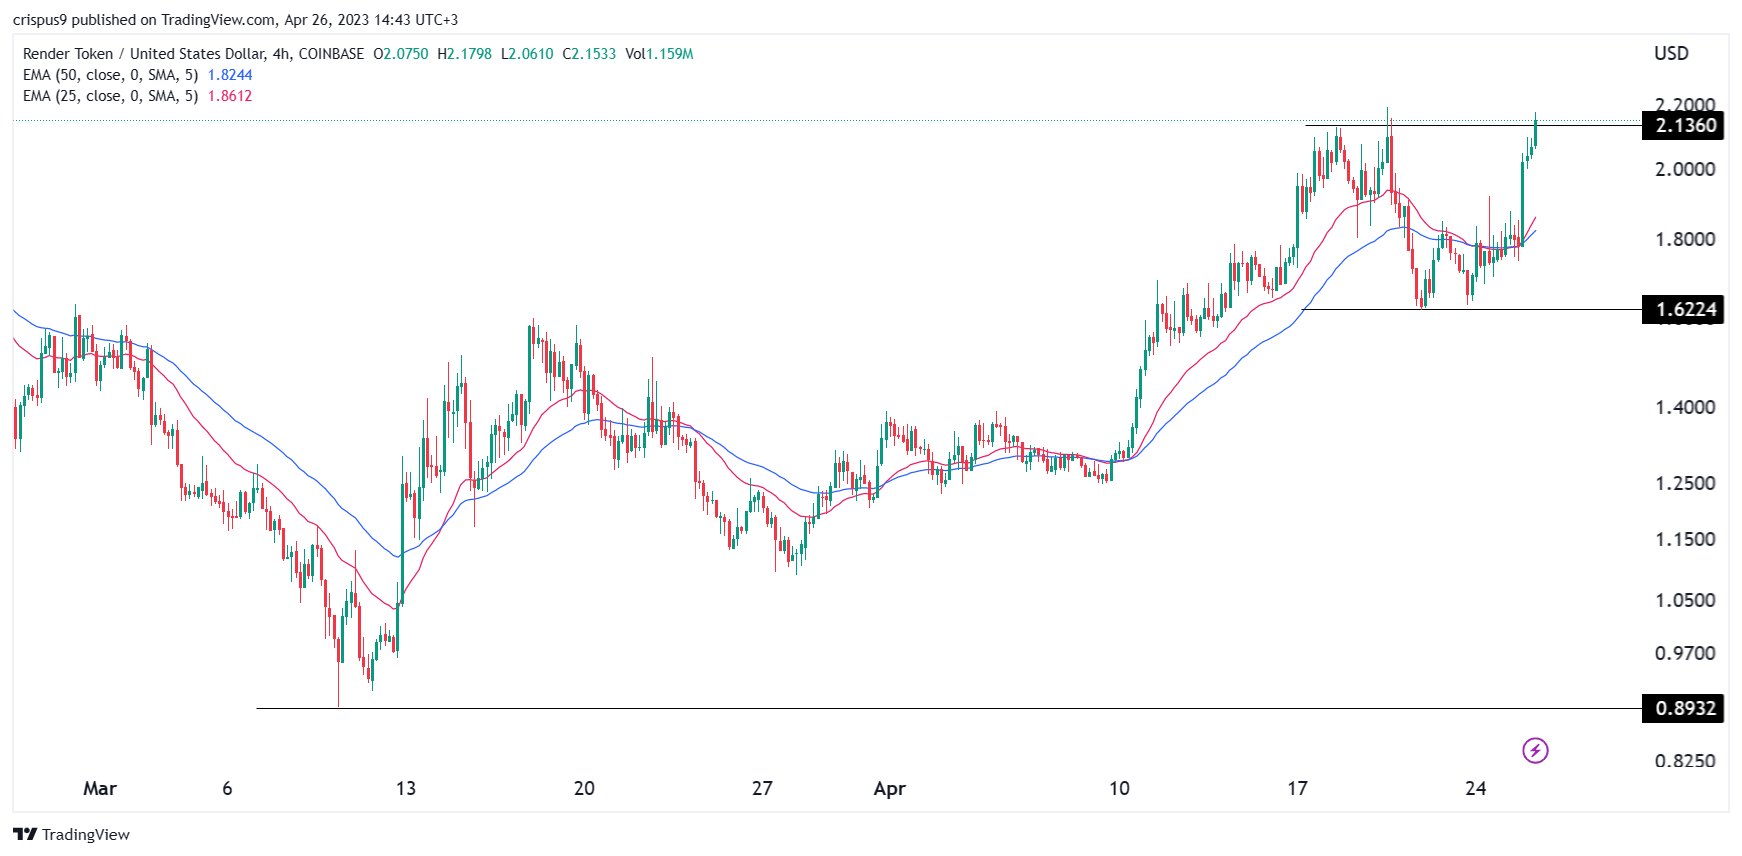
Render Token (RNDR) price surged to a key resistance level after the developers made a major milestone. The token surged to a high of $2.20, which was the highest point this month. In all, the token has been one of the best-performing cryptocurrencies after rising by more than 140% from the lowest level in March.

Render Network news

The main reason why the RNDR price surged is that the community completed the RNP-002 and RNP-003 votes. These were the most important votes in the community because they will change the architecture of the network.

Precisely, RNP-002 means that Render Foundation can now move ahead with implementing the BME model on the Solana ecosystem. Solana is a leading blockchain that is known for its fast speeds and low transaction costs. 

Unlike Ethereum, Solana can handle thousands of transactions per second while the average cost is less than $0.01. Therefore, by using Solana, Render hopes that its users will work at a faster pace and save a lot of money in transaction costs.

Meanwhile, the RNP-003 vote was known as the Resource Acquisition and Allocation for Core Team and Grants. The vote simply makes it possible for the Render Foundation to acquire and allocate resources in a bid to grow the ecosystem. The next stage is that these votes will be updated to Approved and on the Roadmap. 

Render Token price prediction

The daily chart shows that the RNDR price has been in a strong bullish trend in the past few months. It has jumped from a low of $0.8932 in March to a high of $2.20. The token has jumped above all moving averages.

The current price means that the token has formed a double-top pattern. In price action analysis, this pattern is usually a bearish sign. Therefore, with the Solana integration news confirmed, there is a likelihood that the token will pull back.

This is known as buying the rumours and selling the news. It happens when investors buy an asset ahead of a major event and then sell when it happens. If this happens, the next key level to watch will be the neckline of the double-top at $1.622.

How to buy Render Network token

The post Why is the Render Token (RNDR) price surging? appeared first on CoinJournal.

XRP/USD fails at horizontal resistance, but the bullish bias remains

  • $0.6 offers a strong horizontal resistance
  • The bias remains bullish while the market holds above the 2023 lows
  • A daily close above $0.6 should trigger more upside

It must have been a frustrating second half of the last year for cryptocurrency investors. As the dollar began to weaken, major stock market indices bounced. 

But the dollar’s weakness was not seen in the cryptocurrency market until the very last days of the year. Moreover, the divergence continued from last October, when the stock market bottomed, until the last trading days of the year. 

Only in 2023 things changed. Leading cryptocurrencies rallied, led by Bitcoin. 

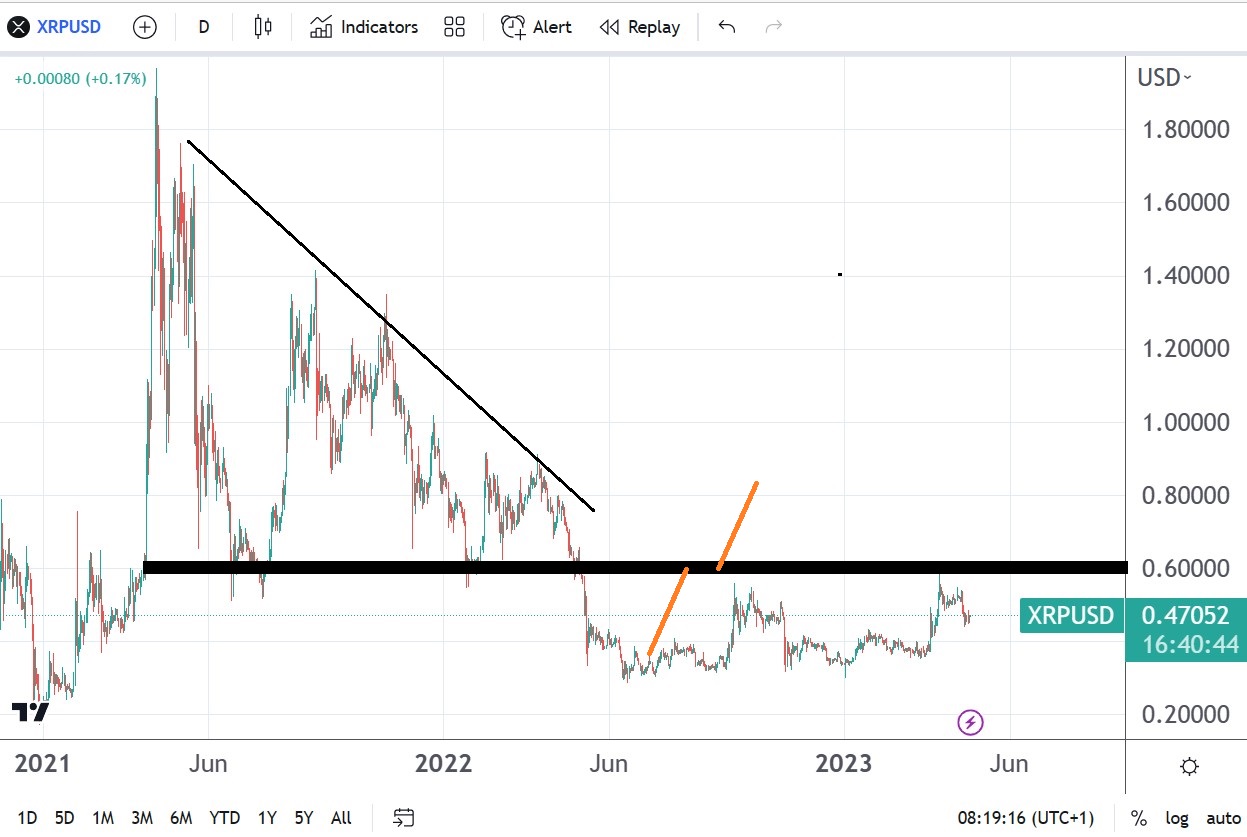
Some bounced stronger than others. In the case of XRP/USD, it met horizontal resistance at $0.6, a level that provided support in 2021. 

XRPUSD chart by TradingView

A daily close above $0.6 would be bullish for XRP/USD

After trading above $1.8 in 2021, when the entire cryptocurrency market rallied, Ripple gave up a big chunk of its gains. On the way down, the market met support at $0.6 for over a year. 

Eventually, the support gave way as the bears were in control. 

But now, the same area that acted as support acts as resistance. In technical terms, this is called the interchangeability principle (i.e., support becomes resistance and vice versa). 

If the bottom carved in the late days of 2023 is here to stay, then the focus is on the $0.6 area. A daily close above would be bullish, and the next immediate target would be $0.8. However, only a break above parity would shift the bias from bearish to bullish. 

All in all, XRP/USD looks constructive here. As long as the lows hold, the chances are that the market is only building energy for another attempt at the $0.6 level. 

The post XRP/USD fails at horizontal resistance, but the bullish bias remains appeared first on CoinJournal.

Binance.US terminates $1 billion deal for Voyager assets

  • Binance.US has reportedly terminated its deal for assets of Voyager Digital.
  • The $1 billion deal had been approved by a US court.
  • The price of VGX, the native Voyager token, fell more than 10% after the news.

Binance.US has terminated its acquisition deal for the assets of Voyager Digital, according to a tweet posted on the bankrupt crypto lender’s Twitter account.

“Today we received a letter from Binance.US terminating the asset purchase agreement. While this development is disappointing, our chapter 11 plan allows for direct distribution of cash and crypto to customers (a “toggle option”) via the Voyager platform,” the announcement read.

The Voyager token VGX fell more than 10% after the news, trading to lows of $0.317.

The purchase agreement for Voyager assets has been somewhat on and off, with Binance.US first being blocked from the deal by US authorities before a court allowed it to proceed. Despite the latest setback, the Voyager Chapter 11 plan team says the key is to return value to the platform’s customers.

“Consistent with the plan, we will now move swiftly to return value to customers via direct distributions. We will provide more information on next steps and any actions customers need to take in the coming days,” the tweet read.

Voyager filed for bankruptcy in July 2022 after a market turmoil amid contagion forced it to halt withdrawals.

Binance.US had not released a statement on the development at the time of going to press.

The post Binance.US terminates $1 billion deal for Voyager assets appeared first on CoinJournal.