LimeWire inks major deal with Universal Music Group for music-based NFTs

LimeWire, the new NFTs marketplace that sprung from the discontinued popular music app of the early 2000s, has scored a huge deal with Universal Music Group (UMG).

The partnership with UMG, a world leader in the booming music and entertainment sector, adds to LimeWire’s steady return into the limelight.

Per a press announcement released on Tuesday, the deal with Universal Music allows the firm to offer its digital collectibles marketplace to several iconic record labels and revered artists.

UMG to license artists to LimeWire’s NFT marketplace

Labels that could tap into the LimeWire NFT marketplace to increase fan engagement via digital music NFTs and a Web3 experience include Interscope Records, Virgin Music, Republic Records, Def Jam Recordings, EMI, Capitol Records, and Motown Records.

Paul and Julian Zehetmayr, LimeWire co-CEOs, commenting on the collaboration, said that the partnership was a “true demonstration of the pace at which the music industry is embracing Web3.” 

“We’re thrilled to open up the LimeWire NFT ecosystem to Universal Music Group artists and fans and can’t wait to see the first creative projects being launched on the marketplace,” they added.

Going forward, the partnership will allow for access to the licenses the marketplace needs to partner with artists signed up with UMG, with the collaboration translating to original music-based NFT projects.

The NFT space continues to grow as mainstream players, including governments, embrace the technology that allows for the creation and securing of digital items on the blockchain.

Monetization opportunities mean the industry is a perfect fit for artists and others looking to revamp their revenue streams. LimeWire will provide that to the UMG artists.

The post LimeWire inks major deal with Universal Music Group for music-based NFTs appeared first on Coin Journal.

Bitcoin bottom not in yet, according to on-chain analysis

On-chain analysis is fascinating to me. Exclusive to the blockchain, it doesn’t exist outside of crypto. But in jumping on-chain, we can often get intriguing insights into market sentiment, and specific indicators have even been predictive of future price action.  

Of course, given Bitcoin’s short history of just over a decade, it’s not yet clear which indicators are merely coincidences and which carry actual value. But that’s part of the fun, no?

Percentage of Supply in Profit

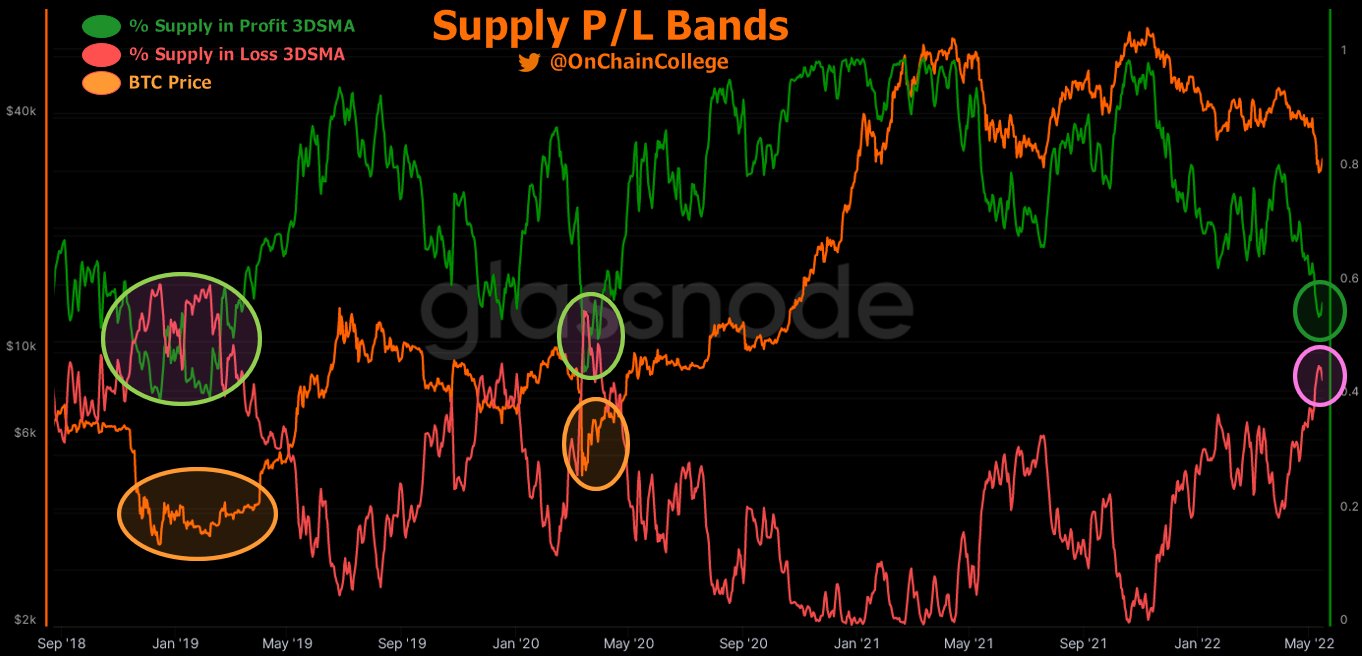
I came across an exciting indicator this week on Twitter, compiled by @OnChainCollege, who is a great follow if you’re into on-chain analysis. He looks at the percentage of Bitcoin supply in profit to gauge how overheated (or cooled off) the market is. Historically, this has signalled the start and end of the bear markets quite well for Bitcoin.

And these bands are very close to crossing at the moment.

To explain what the metric is, for those unaware, the percentage of supply in profit refers to the percentage of existing bitcoins where the current price is higher than the price at which those bitcoins were purchased. When the percentage of supply in profit rises above 50%, this is a top signal. When the percentage drops below 50%, this is a bottom signal. Or so the theory goes.

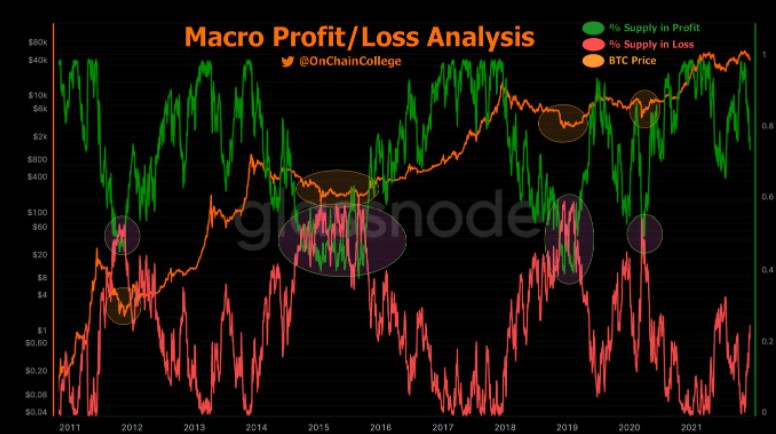
The graph below shows this, going back to 2011. Note that @OnChainCollege graphed it by placing the percentage of supply in loss (red) on the chart too, as well as the percentage of supply in profit (green). These two lines crossing would be the indicator.

Historical Accuracy

As you can see, this has crossed only four times previously. The most recent was March 2020, when the onset of COVID rattled the markets. In my view, this was the scariest time in crypto history – a true existential event (to be honest, it felt like it was an existential crisis for the world as a whole).

To play devil’s advocate, you could probably write this instance off as a black swan event, and overlook the impressive bounce that followed the crossover here – fine. But in looking at the other cases, the prediction ability holds in all three cases: 2019, 2014 and 2011.  

That’s all well and good. But what is the market saying now? Well, the percentage of supply in loss has not crossed the percentage in profit – yet. If the pattern holds, that means there may still be more pain to give before the bottom is in.

Caveats to On-Chain Analysis

Obviously, any on-chain analysis comes with the caveat that not only is the sample space small, but the data may be non-structural, with material changes to the landscape. Today, we are seeing rampant inflation, a hawkish Fed and a scary geopolitical climate. This has triggered the worst start to a year for stocks since 1939.

These macro headwinds mean that, for the first time in Bitcoin’s history, it is swimming upstream against serious and consistent bearish sentiment – April was the worst month for stocks since October 2008. Additionally, Bitcoin has almost nothing in common today with the niche Internet money it was back in 2011, or even 2014. Today, it takes its place amid bonafide asset classes, with institutional money pouring in and a seat at the macro table.

All this means that there is far from a guarantee that history repeats itself here, should these bands cross again. Nonetheless, it’s a fascinating trend to keep an eye on and a neat use of on-chain analysis from an analyst who is a personal favourite of mine. It will be fun to track going forward.

The post Bitcoin bottom not in yet, according to on-chain analysis appeared first on Coin Journal.
China returns as second-largest Bitcoin mining hub: report

Bitcoin mining has picked up again in China, a new report suggests.

According to a study by Cambridge University, Bitcoin mining activity in China has slowly surged to currently account for 21% of the total global hashrate.

The report released on Tuesday comes nearly a year after a massive Chinese crackdown on crypto mining and trading drove miners out of the country. As the exodus of miners found its way into the US and other countries, the overall hashrate securing the Bitcoin network from within China fell dramatically.

Per the report, miners have launched “covert mining operations”, the result of which is the uptick in the hashrate from virtually zero to nearly a quarter of global output.

“In China, following a sudden uptick in covert mining operations after the June 2021 government-mandated ban on Bitcoin mining, the country has re-emerged as a major mining hub,” the Cambridge Centre for Alternative Finance (CCAF) noted in its research report.

But while there’s a re-emergence of activity in the Chinese market, bringing it to second globally, the majority of computational power currently securing the Bitcoin network is in the United States.

Cheap electricity and favorable outlook across several jurisdictions mean 40% of hashrate is from US-based miners, a scenario likely to see the US top remain top of the list.

China’s 21.11% of global hashrate puts it ahead of Kazakhstan which accounts for 13.22%, Canada with 6.48%, and Russia with 4.66%.

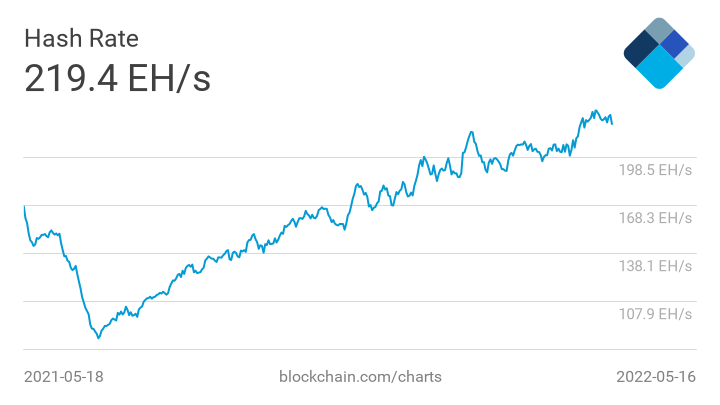
According to data from Blockchain.com, the Bitcoin hashrate has steadily risen since the lows reached in early July 2021. The 7-day average chart shows the total network hashrate stands at 219.4 EH/s (exahashes per second).

Bitcoin currently trades around $30,030 as bulls continue to battle massive bearish pressure. 

The post China returns as second-largest Bitcoin mining hub: report appeared first on Coin Journal.

Tron price prediction: USDD concerns remain

The Tron price has been a bit volatile in the past few days as worries about its newly launched USDD stablecoin that has a close resemblance to Terra USD. The coin is trading at $0.069, which is about 25% below the highest level last week. Its total market cap has declined to about $6.82 billion.

USDD concerns remain

The biggest story in the cryptocurrency this month was the collapse of Terra USD, the third-biggest stablecoin in the world. At its peak, it was the third-biggest stablecoin in the world after Tether and USD Coin.

Another big story was the launch of USDD Coin by Tron. USDD is a stablecoin that closely resembled Tron USD in that it is not backed by US dollars. Instead, it is an algorithmic stablecoin that automatically rebalances when it moves below or above $1. 

USDD has been one of the most successful stablecoin launches ever. In less than three weeks, its total market cap has jumped to over $310 million. This makes it one of the biggest stablecoins in the world and the 147th biggest coin globally.

Read more on how to buy Terra Luna.

The TRX price has declined because of worries of the USDD stablecoin. With algorithmic stablecoins like DEI, Neutrino, and Terra USD losing their peg, there are concerns that USDD also could do the same. For now, however, the coin’s peg has held relatively well and has ranged between $0.998 and $1.01.

Tron price has also declined because of the weak performance of its DeFi platform. Like all platforms, its total value locked has crashed hard in the past few days. It has dropped slightly to about $4.2 billion, making it the 4th biggest chains in the world.

Tron price prediction

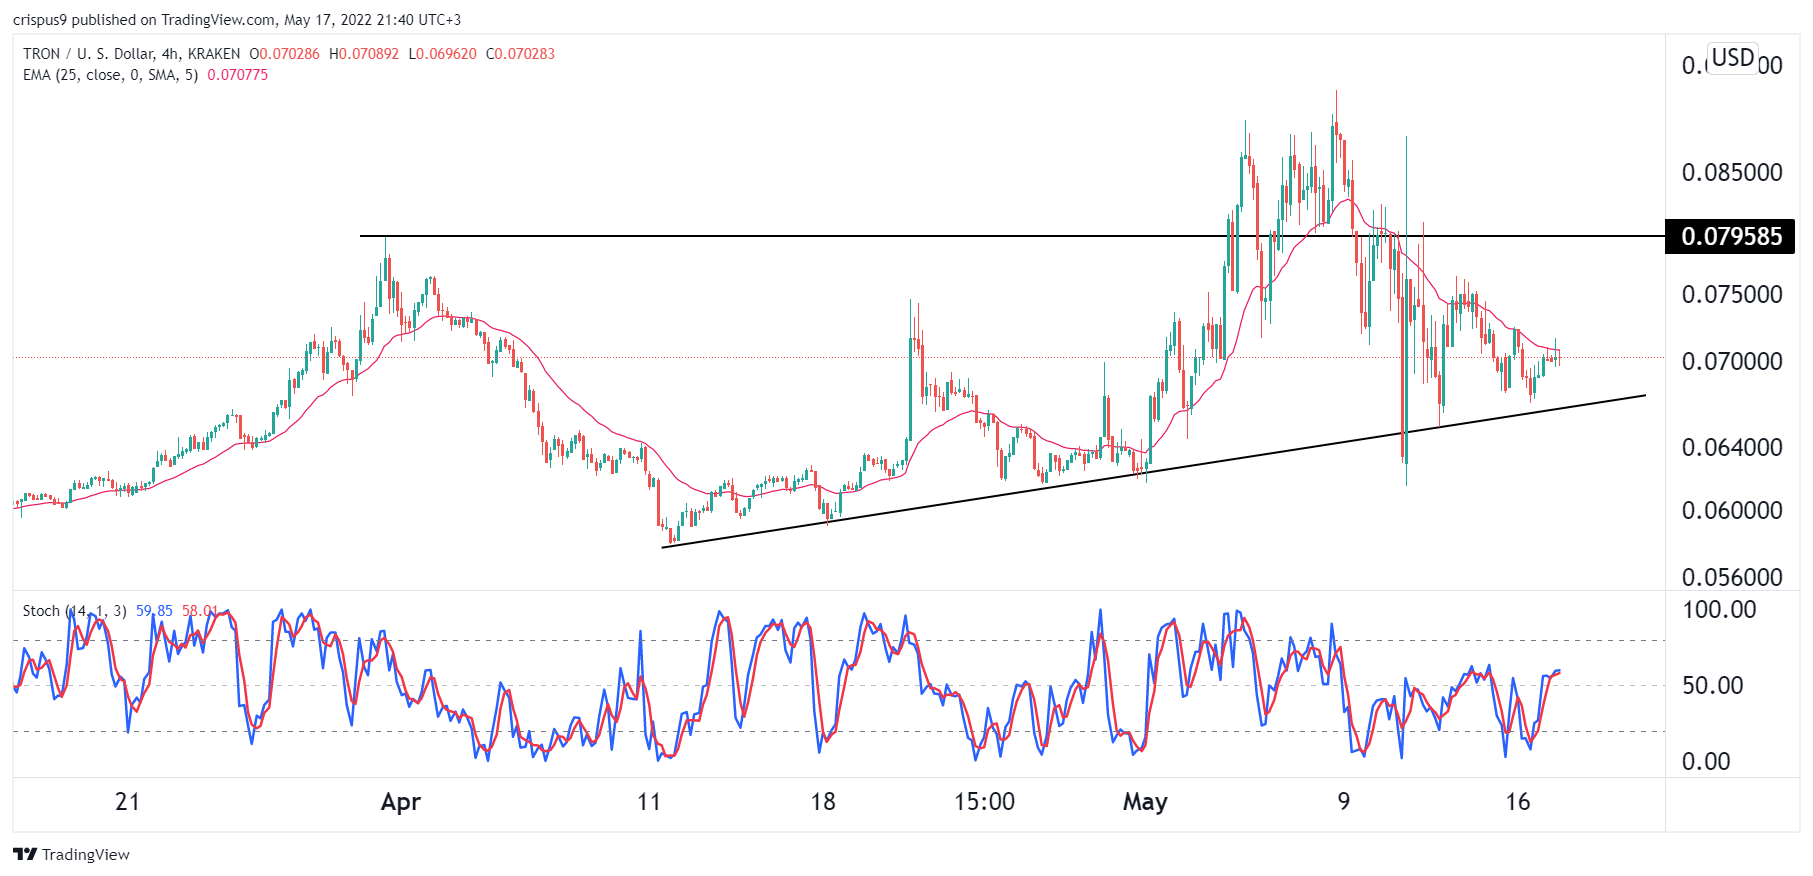
Turning to the four-hour chart, the TRX price jumped to a high of $0.092 as demand for the USDD coin rose. In the past few sessions, however, the coin has retreated sharply and moved below the 25-day and 50-day moving averages. The coin remains above the ascending trendline that is shown in black.

Tron’s Stochastic Oscillator has moved slightly above the neutral level at 50. Therefore, the outlook for the Tron price is a bit bearish, with the next key support level being at $0.065. A move above the resistance at $0.0072 will invalidate the bearish view.

The post Tron price prediction: USDD concerns remain appeared first on Coin Journal.
Maker (MKR) price could soon plummet as rising wedge forms

The Maker price has been in a consolidation mode in the past few days as investors assess the strength of the DeFi industry and its Dai stablecoin. MKR is trading at $1,544, which is in the same range it has been recently. This price has risen by more than 64% from its lowest level last week. It now has moved to over $1.4 billion, making it the 51st biggest coin in the world.

MKR rally fizzles

Maker is the biggest DeFi platform in the world with more than $10.5 billion locked in its ecosystem. It is a decentralized autonomous organization (DAO) that allows people to generate a stablecoin known as Dai by leveraging collateral assets provided by Maker Governance.

Dai is a stablecoin that is relatively different than Tether and USD Coin. Unlike these two, it is soft-pegged to the US dollar. However, it is decentralized in nature and its collateral assets are deposited in Maker vaults.

The Maker price rose sharply in the past few days as investors embraced Dai after the collapse of Terra LUNA, Terra USD, and affiliated DeFi networks like Anchor Protocol and Astroport. In the past few days, the total market cap of Dai has jumped to more than $6 billion, making it the 17th biggest coin in the world. It has become the third-biggest stablecoin in the world after Tether and USD Coin.

Read our comprehensive review of eToro.

Still, a closer look at its ecosystem shows that people have pulled out their cash from the network after the collapse of Terra. Its total value locked (TVL) in the network has declined to about $10.5 billion, which is the lowest it has been since July last year. At its peak, it had a TVL of over $20 billion.

Maker price prediction

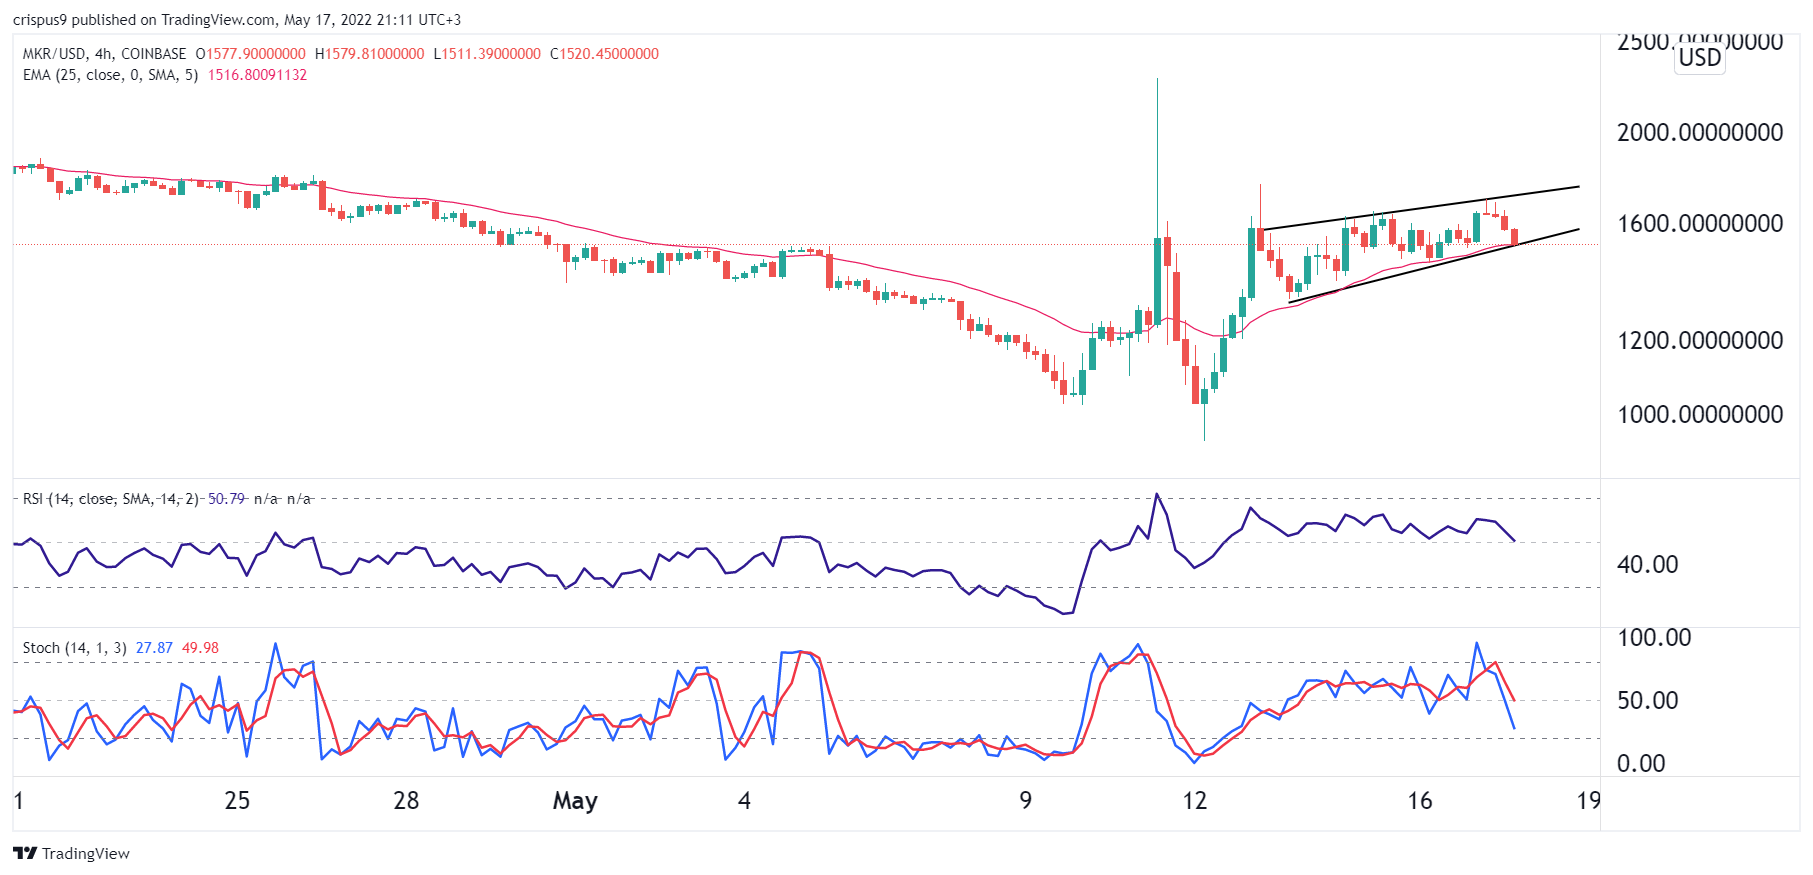
The four-hour chart shows that the MKR price has moved sideways in the past few days. The coin moved slightly above the 25-day moving average while the Relative Strength Index and the Stochastic Oscillator have tilted downwards.

However, a closer look shows that the coin has formed a rising wedge pattern, which is usually a bearish sign. Therefore, the outlook of Maker is bearish, with the next key support level to watch being at $1300. A move above the resistance level at $1,650 will invalidate the bearish view.

The post Maker (MKR) price could soon plummet as rising wedge forms appeared first on Coin Journal.