Bitcoin price update – bullish inverse head and shoulders pattern points to more upside

  • Bitcoin price found support at an inverse head and shoulders pattern’s neckline
  • The measured move points to more upside for Bitcoin
  • There is no significant resistance until the $48k level

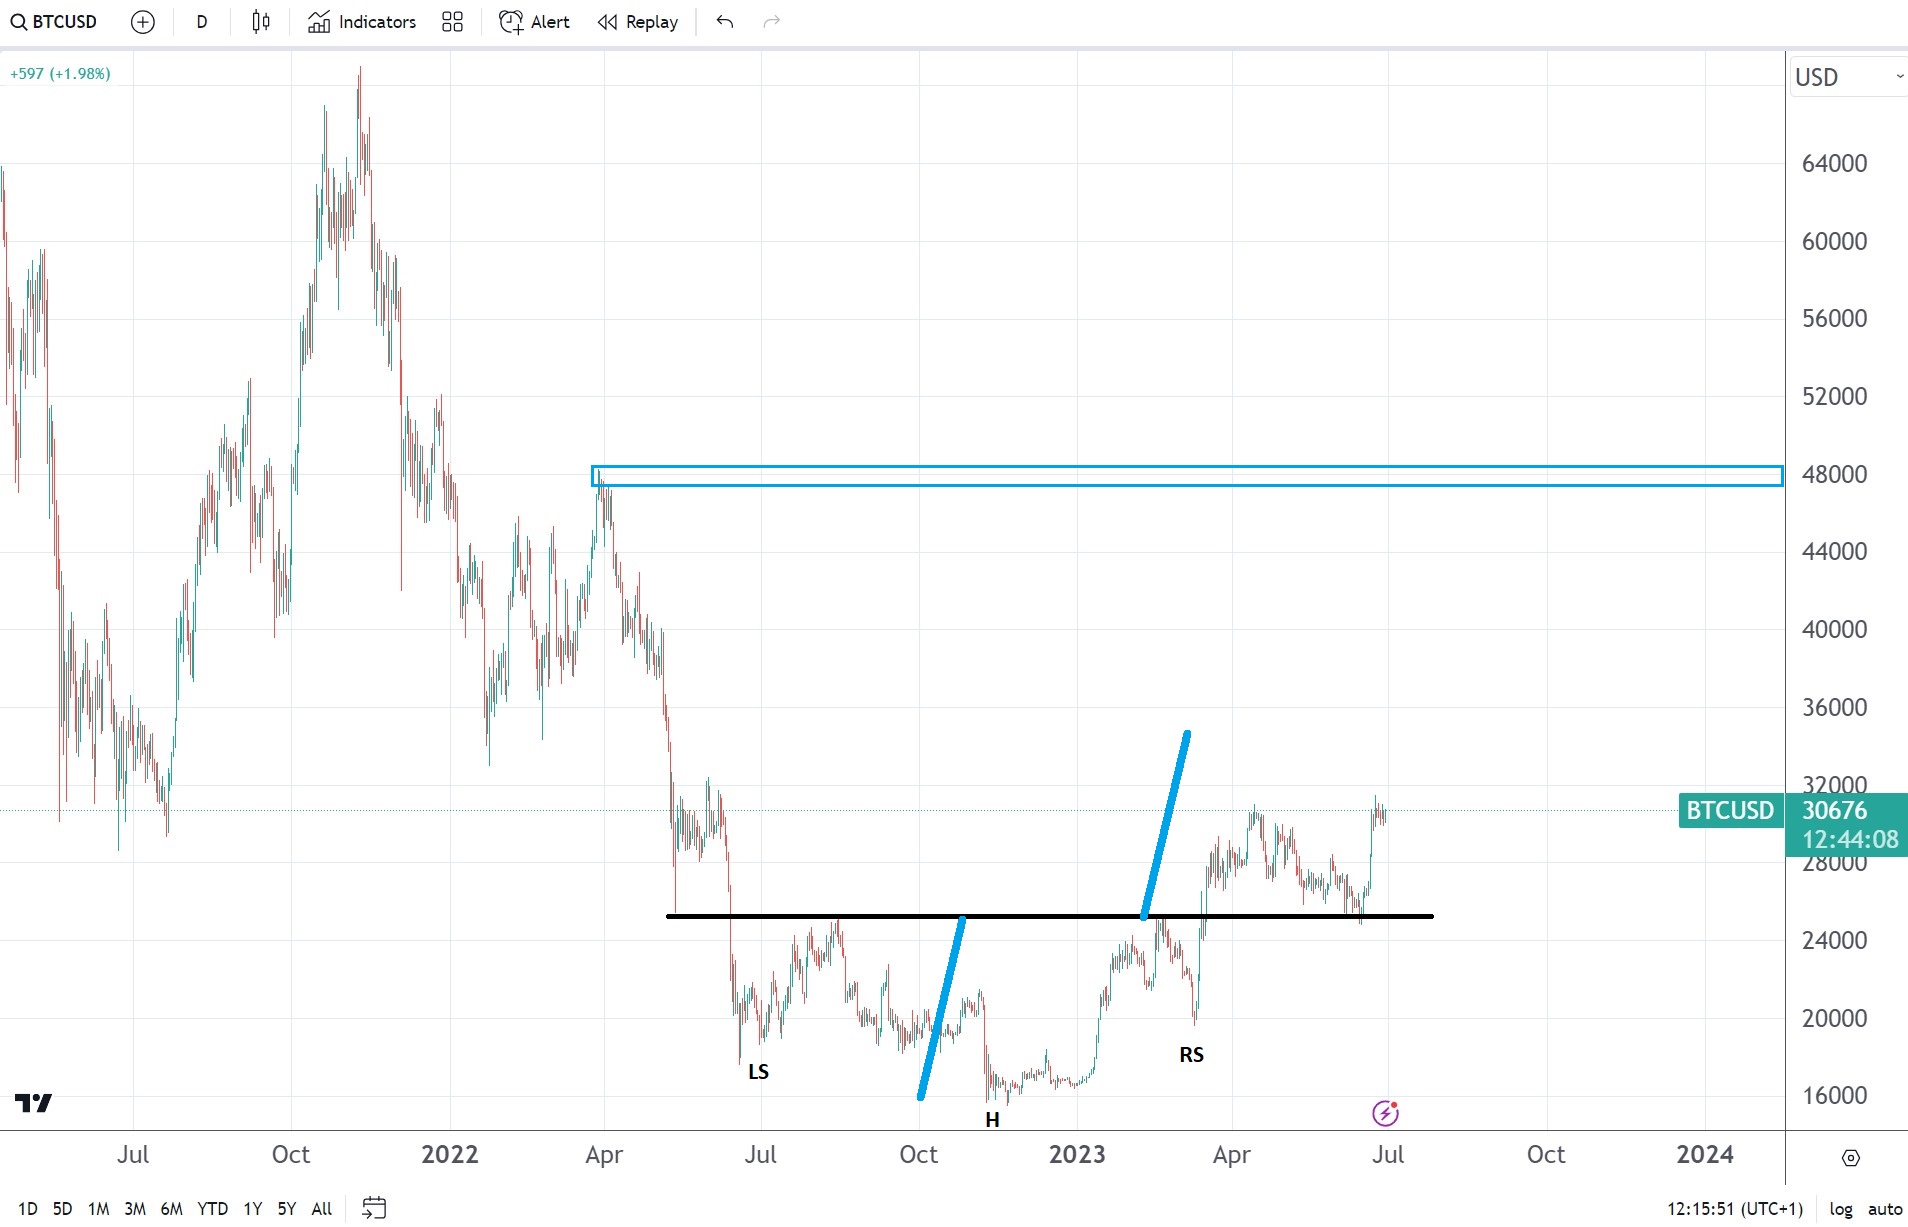
Bitcoin’s price holds above the key $30k level, and the price action is bullish while above $25k. This is the level that offered support on the recent downward trend as the neckline of an inverse head and shoulders pattern rejected the price.

From a fundamental perspective, Bitcoin remains bullish while the US dollar’s bearish trend continues. While strengthening lately, the dollar’s move higher is not convincing, as reflected by the EUR/USD exchange rate still hovering around 1.10.

Yesterday, the Fed’s Chair, Jerome Powell, participated in a panel at the ECB Forum in Sintra. He was clear in saying that the Fed did not pause but skipped a rate hike in June.

While his comments were hawkish, so were the comments of other panelists, such as the Bank of England’s Governor or the European Central Bank’s President. Therefore, the dollar weakness may dominate markets during the summer months should investors perceive other central banks as more hawkish than the Fed.

Bitcoin chart by TradingView

Did Bitcoin bottom in late 2022?

One question is on every crypto investor this year – did Bitcoin bottom in late 2022?

Sure enough, the price action following the December 2022 low gives bulls hope. Bitcoin’s price action also suggests that a major bottom might be in place.

An inverse head and shoulders pattern points to more upside. The fact that the market retested the neckline and was rejected by it shows that bulls are still in control. In other words, the price action reinforces the bullish case.

Finally, now that Bitcoin’s price is at the year’s high, there is no significant resistance until $48k. This is the 2022 high, and it looks like the market is building energy to break higher.

The post Bitcoin price update – bullish inverse head and shoulders pattern points to more upside appeared first on CoinJournal.

Very few Bitcoins are actually moving, but the liquidity picture could change soon


Key Takeways

  • Spot volume remains low and liquidity thin in Bitcoin markets
  • Only 2.7% of the supply has moved in the last week; 7% has moved in the last month
  • This compares to 7% of the total supply of Bitcoins which are likely lost 
  • Uncertainty is high due to tightening regulation and the macro climate
  • With institutions filing ETFs and launching exchanges, the liquidity picture may change drastically in the future

Market participants will know that if anything is true about the Bitcoin market over the last year, it’s that it has been incredibly illiquid. 

Market depth was thin anyway by the time November 2022 rolled around. Then came the FTX implosion and an Alameda-sized hole in order books. Bankman-Fried’s trading firm was also one of the largest market makers around, and market depth has never recovered since its demise. 

The effect has worsened in the last few months as a result of the regulatory clampdown in the US. We saw a host of market makers wind back operations in the US, including Jump Crypto and Jane Street in May (ironically, Bankman-Fried worked for the latter before founding Alameda). 

We put together a data dive on this back in March, but in looking at the balance of stablecoins on exchanges below, we can see 60% have left exchanges in just over six months, amounting to $26 billion. 

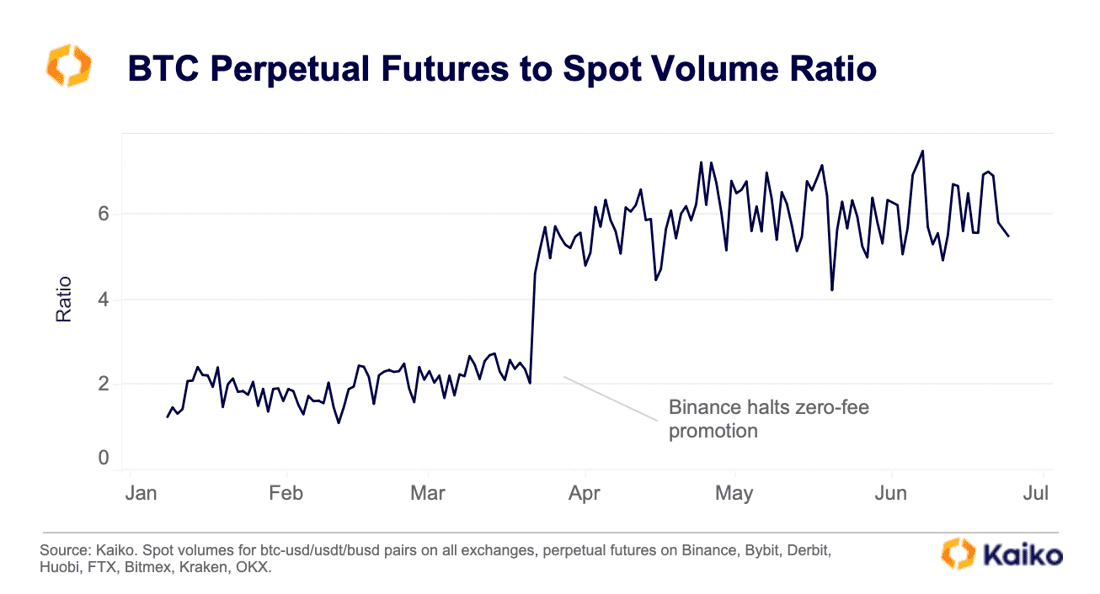
We can also see below that much of the volume earlier in the year was derived from Binance via zero-fee promotions. Once this promotion ceased, the futures-to-spot volume ratio jumped, highlighting that even that thin level of spot volume was propped up somewhat artificially by zero fees (chart via Kaiko).

Indeed, one of the (many) charges facing Binance is that the exchange engaged in “targeted wash trading” to increase volumes. Therefore, the shallow volume could be even shallower in reality. 

By now, we all know this. I want to take a moment to assess the supply side of the equation, however. From day 1, Bitcoin has possessed two qualities which make it ever-so-intriguing: a final capped supply of 21 million coins and a pre-determined schedule at which those coins are released (with the supply cap slated to be hit in the year 2140). 

As of today, 92.4% of the Bitcoin supply has already been released. By pulling some on-chain data, I have plotted below the percentage of coins which have moved in the last month against the total supply. This gives some indication into how many coins are moving due to trading activity. 

The chart shows 1.4 million coins have moved in the last month, equivalent to 7% of the circulating supply. In truth, one month is likely too broad a time horizon. Narrowing it to a (still conservative) one week in the next chart shows around half a million coins moving, around 2.7% on the total supply.  

These charts highlight further how few Bitcoins are actually moving around these days. In fact, if I can use one more chart to illustrate the scarcity at play here, let’s look at this next one which layers in an estimate of lost coins. These lost coins are estimated by Glassnode and are coins which have been inactive since before the launch of the first Bitcoin exchange in July 2010 (as coins from pre-July 2010 are spent, this estimate converges to the real number of lost coins; it’s not a perfect measure, but a good estimate). 

The chart shows that 7.5% of the total supply can be currently estimated as lost (Satoshi Nakamoto’s stash is included here). That means that it is roughly the same number as the amount of coins that have moved in the last month, and triple the number of coins that have moved in the last week. 

Therefore, only a small portion of the supply is moving for Bitcoin. On one hand, this sounds bullish – one oft-repeated mantra within the space is that a dwindling supply will inevitably lead to an uptick in price. But this is only the case if the thin supply is matched by an uptick in demand. 

When we look at order books and market depth over the last nine months, the shallow liquidity is a concern. However, there have been several important developments in the last two weeks that provide hope that this may change. Blackrock, the world’s largest asset manager, filed for a spot Bitcoin ETF, only to be swiftly followed by fellow giant Fidelity. There is also the launch of the exchange EDX, backed by trad-fi giants Fidelity, Schwab and Citadel.

Even the tightening regulatory noose around Binance could help provide a clearer picture for the future of the space and give investors confidence that something is finally being done to clean up the opaque nature of so much of the industry. 

In conclusion, it feels quite likely that we will be looking back upon these uber-thin liquidity conditions in awe in a couple of years’ time. Uncertainty is extreme right now, both with regard to regulation but also the macro picture. There will come a day when that won’t be the case, and things may be very different as a result. But as of right now, it’s thin out there.

The post Very few Bitcoins are actually moving, but the liquidity picture could change soon appeared first on CoinJournal.

Bitcoin correlation with gold drops, highlighting risk-on nature remains


Key Takeaways

  • Bitcoin’s correlation with gold is currently at its lowest level since FTX collapsed in November
  • Our Head of Research writes that while one day Bitcoin may become a store of value, the numbers say it currently trades like an extreme risk-on asset
  • Bitcoin lost 76% of its value amid the pullback in risk assets once central banks around the world transitioned to tight monetary policy amid the inflation crisis
  • Meanwhile, gold traded flat and is currently close to all-time highs
  • Bitcoin’s correlation with growth stocks and riskier sectors of the stock market remains tight

One of the ultimate bull scenarios for Bitcoin is that it morphs into some kind of digital gold. 

For whatever reason, humans have been obsessed with this weird, shiny metal for thousands of years. Stories date back even further, but we have concrete evidence that gold was an important symbol of wealth in Ancient Egypt in 3000 BC, as well as part of everyday life and mythology. 

Bitcoin, on the other hand, was not around in Ancient Egypt. Nor was it around for the Middle Ages, the Great Depression in the early 20th century, a World War (yet?), the inflation and energy crisis of the 1970s, and it even missed most of the subprime mortgage crisis of 2008. 

In fact, Bitcoin was launched in January 2009, the Genesis blocked mined only two months before the stock market bottomed. Over the next twelve years, not only did the stock market recover, but it went absolutely bananas. Between the 2009 trough and the peak at the end of 2021, the S&P 500 multiplied 7X while the Nasdaq jumped nearly 13X. In other words, Bitcoin was launched into one of the most explosive and longest bull markets in history. Until 2022, it had never known anything but basement-level interest rates and up-only markets. 

Gold’s hedge properties are what Bitcoin seeks

Once 2022 came, risk assets sold off. The Nasdaq shed a third of its value; the S&P 500 fell 20%. Bitcoin had dipped plenty before, but make no mistake: this was the first time it was staring a bear market in the wider economy in the face.

 Despite certain enthusiasts claiming Bitcoin would act as a hedge asset, this did not happen. By the end of 2022, Bitcoin was 76% off its high. In the most explosive inflationary environment since the 1970s and Bitcoin’s first bear market, the asset was getting crushed. There was no debate: Bitcoin was trading like a risk-on asset. And today, it still is.  

That is not to say that the narrative could flip in the future. Personally, that is what I view as Bitcoin’s upside: a store of value akin to gold. But while we can debate whether that may one day happen, it is unequivocal that Bitcoin currently trades like a risk-on asset. These are the facts of the case, and these are undisputed, to borrow Kevin Bacon’s phrase from the absolute classic that is A Few Good Men. 

Gold, on the other hand, traded flat during 2022, and is currently trading close to all-time highs. 

Bitcoin and gold correlation dipping

For all the reasons discussed above, the correlation between gold and Bitcoin is particularly interesting to track. Using the 60-Day Pearson indicator, I have plotted it on the below chart. 

Immediately, the past month jumps out. The correlation was a near-perfect 0.86 at the start of June, and had been around this level since late April. And then, it fell. It currently sits at 0.16, the lowest mark since FTX collapsed in November, sending the crypto market into a tailspin. But why?

Well, I don’t really know. And that is kind of the point. Bitcoin, as it tends to do sometimes, is rising at the moment. Most likely, this is due to news of asset managers Blackrock and Fidelity filing ETFs, but maybe it’s just Bitcoin doing its thing. Perhaps it is merely bouncing back from the sharp fall it took after the Binance and Coinbase lawsuits were announced back-to-back two weeks ago. 

But if we stretch out the time horizon on the previous graph, we see that the correlation between gold and Bitcoin bounces around a lot.

It is challenging to put any pattern on that, to say the least. I thought I might try a different metric, so in the next graph I have used 90-Day Pearson instead of 60-Day. Predictably, the trend is less volatile, but there still appears to be no meaningful relationship here. 

I think it’s pretty clear that assessing the correlation coefficients directly proves that there is zero positive relationship between these two assets. 

Federal Reserve holds the key

In truth, I believe this actually says more about gold than Bitcoin. Gold is in a funny place at the moment, trading more off expectations of inflation and interest rate movements rather than current conditions. The correlation between gold and the stock market is therefore higher than what we have typically seen in the past. This is why we are seeing gold often advance when soft CPI numbers are announced, or when dovish Fed comments surface regarding interest rate policy.

If we step back and look at the big picture, it really is not complicated. Bitcoin has gone from $68,00 in November 2021, when money was cheap and risk assets were trading at outrageous valuations, to $15,500 last November, seven months into the swiftest hiking cycle in recent memory and the worst inflation crisis in 50 years. Then, it doubled to $30,000 as inflation numbers fell away and expectations around the length of the hiking cycle softened. 

Along with all the fakeouts and reverberation in between, that is a hell of a lot of movement and clearly trading like an extreme-risk asset. Meanwhile, gold has been far less volatile, relatively range-bound between $1,600 and $2,000 for three years now. 

Again, while Bitcoin may one day seize the crown of an uncorrelated asset, or a portfolio hedge to inflation, that is clearly not the case today. The below chart is the simplest method of all to show this, plotting Bitcoin’s hand-in-hand relationship with the tech-heavy Nasdaq composite since the economy transitioned to this risk-off, tight monetary policy period. 

A few months ago, Bitcoin rose during the banking crisis, sparking some to declare it as decoupling from risk assets and the fiat world. As I wrote back then, this is nothing more than wishful thinking. Rather, it moved off expectations that the Fed would not be able to hike as aggressively in future if banks were going under due to the strain of these higher rates (indeed, soon after, the correlation rose back up).

The latest dip in correlation with gold, falling back down from the ultra-high 0.86ish value it has been for six weeks or so, is similar. There is nothing ambiguous about the situation at the moment – Bitcoin is trading like a risk-on asset. It may one day claim that coveted title of digital gold, but right now it is nowhere near.

The post Bitcoin correlation with gold drops, highlighting risk-on nature remains appeared first on CoinJournal.

SwissOne launches ecosystem fund for IOTA and Shimmer

  • SwissOne Capital launched a major ecosystem fund for IOTA and Shimmer.

  • The fund will invest in the most promising projects in the ecosystem.

IOTA and Shimmer received a boost on Tuesday when SwissOne Capital unveiled the first ecosystem fund to support developers. The fund, which is dedicated to IOTA and Shimmer will invest financial resources to developers working on the ecosystem.

The minimum investment the fund will offer will be 10,000 euros or the equivalent in $MIOTA and $SMR. In a statement, Steffen Bassler, the CEO of SwissOne Capital said:

“We are excited to launch this fund and offer our clients early access to projects building within the Shimmer and IOTA ecosystem. With ShimmerEVM rolling out, we believe this is the perfect time to launch a dedicated fund. We are committed to working with the Tangle Ecosystem Association to ensure that the fund is managed in the best interests of our clients.”

IOTA is one of the pioneers in distributed ledger technology (DLT). It pioneered a technology known as tangle, which is an open, feeless and scalable ledger, which is designed to support frictionless data and value transfer.

Shimmer, on the other hand, is a layer 1 network that provides staging and validation for the IOTA DLT. Like Polkadot’s Kusama, Shimmer makes it possible for developers to build dApps and then test them before moving them to IOTA’s ecosystem. SMR, its native token has over $71 million in market cap and over 249,150 total active addresses.

Shimmer is currently testing its EVM capabilities, as we wrote here. Ethereum Virtual Machine is a piece of software that is able to handle Ethereum smart contracts. It is one of the most popular approaches of improving a network’s interoperability. In a note, the founder of IOTA said:

“With the introduction of EVM-compatible smart contracts, Shimmer and IOTA kick off a new era of growth fueled by crypto-native use cases, primarily in DeFi, NFTs, gaming, and more. We are thrilled to see SwissOne Capital’s commitment to investing in projects across the ecosystem and to see SISO grow alongside the community.”

How to buy IOTA

eToro

Buy MIOTA with eToro today

Plus500

Buy MIOTA with Plus500 today

The post SwissOne launches ecosystem fund for IOTA and Shimmer appeared first on CoinJournal.

Here’s why the Bitcoin Cash (BCH) price has just gone parabolic

  • Bitcoin Cash price has been in a strong bullish trend in the past few days.

  • The coin has surged by over 150% from the lowest level in May.

  • This rally is being supported by the Bitcoin ETF applications.

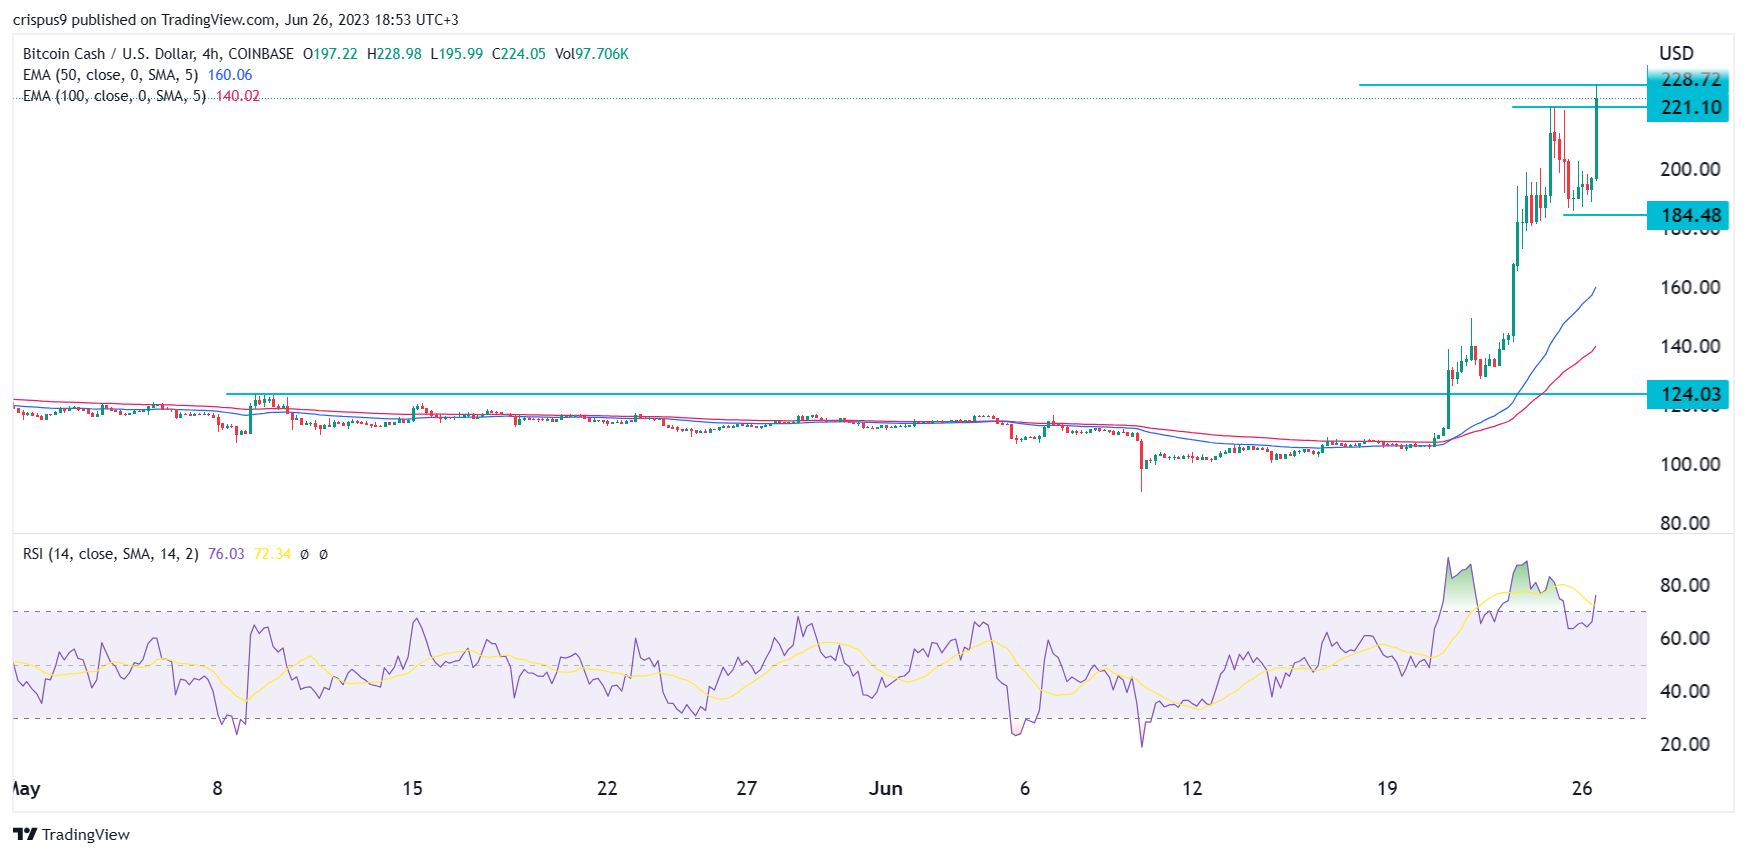
Bitcoin Cash price continued surging on Monday even as BTC and other cryptocurrencies moved sideways. The BCH coin jumped to a high of $228.72, the highest level since May 14th of last year. In all, the coin has jumped by more than 150% from the lowest level in May, making it one of the top-performing cryptocurrencies in the world.

BCH rally continues

Bitcoin and other cryptocurrencies have been in a strong bullish trend in the past few days. This rally is mostly because of the recent crypto news. Companies like Blackrock, WisdomTree, and Invesco announced plans to launch their Bitcoin ETF. If this is accepted, it will likely help many institutional investors allocate funds to Bitcoin.

These ETF proposals do not impact Bitcoin Cash directly. However, analysts believe that these companies will file their Bitcoin Cash spot ETF proposals if the Bitcoin one is accepted. Bitcoin Cash, as with BTC, is seen as a commodity since it is a hard fork of Bitcoin itself.

Other cryptocurrencies that could benefit in all this are Litecoin, Bitcoin SV, and Ethererum Classsic. There are concerns that Ethereum will be avoided because of its staking feature, which SEC believes contravenes securities law.

Bitcoin Cash price also jumped after it became one of the four cryptocurrencies offered by EDX Markets, the new Fidelity, Schwab, and Citadel-backed crypto exchange. The other cryptocurrencies offered by the exchange are Ethereum, Bitcoin, and Litecoin.

Further, Bitcoin Cash is doing well since it has a lower price than Bitcoin itself. The BTC and BCH ratio currently stands at 131, meaning that 1 Bitcoin is worth about 131 BCHs. 

Bitcoin Cash price prediction

The 4H chart shows that the Bitcoin Cash price has been in a strong bullish trend in the past few days. It has jumped above the important resistance point at $124, the highest point on May 9th. The coin has moved sharply above the 25-day and 50-day moving averages (MA).

It has also invalidated the upper part of the double-top pattern at $221.10. This was an important level since it was the highest level last week. The Relative Strength Index (RSI) has moved above the overbought level.

Therefore, there is a likelihood that the BCH price will continue rising as buyers target the next key resistance point at $250. A move below the double-top neckline at $184 will signal that there are more sellers left in the market.

How to buy Bitcoin Cash

The post Here’s why the Bitcoin Cash (BCH) price has just gone parabolic appeared first on CoinJournal.