
Shiba Inu gains while investors grab 50M Shiba Memu tokens on meme craze

  • Shina Inu has risen by over 6% amid positive Shibarium news.

  • Shiba Memu benefits from the meme craze as it raises $1.5 million.

  • Shiba Memu has huge potential from its AI application.

Meme cryptocurrencies continue to attract interest despite crypto markets remaining mixed. A few weeks after launching a presale, investors bought over 50,000,000 tokens of Shiba Memu (SHMU). The AI and blockchain-led project has generated nearly $1.5 million. Is this an indication of the growing popularity of meme cryptocurrencies?

Shiba Inu is the top gainer among the top 20 cryptos

Perhaps underlining the interest in meme cryptocurrencies is Shiba Inu. Unlike Shiba Memu, Shiba Inu has been in the meme space for a while. The cryptocurrency has attracted praise and criticism in equal measure. For critics, Shiba Inu carries little or no value. 

The delayed launch of Shibarium has been a particular source of criticism. Shibarium is expected to give Shiba Inu more utility. This includes powering the project’s metaverse dream. For enthusiasts, Shiba Inu can take on established blockchains and cryptocurrencies. 

As such, Shiba Inu has witnessed wild price swings on changing investor sentiment. However, Shiba Inu is the top-gaining cryptocurrency this week among the top 20 peers. In the past week, the cryptocurrency has added over 6%. The gains are about half its closest top gainer, BNB, with 3.30%.

The gains in Shiba Inu came when the Shibarium Beta Bridge went live for public testing. Enthusiasts have reacted to the developments, which suggest Shibarium is well on course. But meanwhile, Shiba gains underline that investors are still banking on tokens that drive overnight hype. The fast-selling Shiba Memu presale partly underlines this sentiment. 

Why is the Shiba Memu presale in high demand?

 Like any other meme cryptocurrency, Shiba Memu is benefiting from investor demand. These tokens rise at the slightest of news, returning big to its early movers. But Shiba Memu is crafting a niche that investors are banking on.

Shiba Memu is a self-marketing cryptocurrency. It leverages artificial intelligence to market itself and generate hype. By leveraging AI, Shiba Memu aims to become self-sufficient. This creates a unique investment opportunity as it can deliver consistent results. 

Shiba Memu enters the meme space when the application of AI is rising. There is no limit on what AI can do, meaning that Shiba Memu can become more intelligent and powerful. The project also learns every time, and being robotic-led, it can do more than humans. This gives the token a huge potential to explode as AI and blockchain become more pronounced.

What is the investment potential of Shiba Memu?

Meme cryptocurrencies are always an exciting asset class. They always surprise the market, pulling double and triple-digit returns in hours or a few days. In fact, meme tokens have grown so popular that their market cap crossed $20 billion in 2022. The market value was $0 in early 2020.

With the market growth, a huge potential lies in meme tokens like Shiba Memu. That also reflects a changing investment landscape where meme stocks and tokens are growing popular. Shiba Memu could ride the meme frenzy to become a strong and valuable cryptocurrency.

Apart from the market size and dynamics, Shiba Memu is the only meme cryptocurrency that is AI-led. Users can use the project’s AI dashboard to monitor hot and trending topics in creative advertising. This could also be a chance for users to engage the AI itself. They can ask questions, provide feedback, and give suggestions. The engagement could make Shiba Memu user-centric and drive value for the native token.

Shiba Memu price dynamics are unique

The desire to own Shiba Memu at presale is high as this will only be an 8-week affair. Within this period, the price of SHMU will have doubled from $0.011125 to $0.0244. This is because the price of SHMU increases every day at 6 pm GMT. It means investors that buy now are better off than 24 hours later. That potentially explains the fast happening presale.

The post Shiba Inu gains while investors grab 50M Shiba Memu tokens on meme craze appeared first on CoinJournal.
Google Bard sets its Tezos price prediction for August

Tezos price has crawled back in the past few weeks even as the crypto fear and greed index remains in the neutral point. The XTZ coin was trading at $0.845, where it has been at in the past few days. This price is about 27% above the lowest level this year.

Google Bard’s XTZ forecast

Artificial Intelligence (AI) has become a major theme in the market following the success of ChatGPT. As a result, it has become more popular for people to ask AI platforms like Google Bard and Microsoft Assistant about anything. 

Therefore, I asked Google Bard what it thinks about Tezos and how the XTZ token will trade in August. The AI platform said:

“The forecast for Tezos in August is mixed. Some analysts believe that the price of XTZ could reach $1.00 by the end of the month, while others believe that it could fall to $0.75. The overall sentiment for Tezos is bearish, but there are some positive factors that could support the price, such as the upcoming Jakarta upgrade.”

If Google Bard is accurate, then it means that Tezos price could jump by about 20% from the current level. On the other hand, if the XTZ price retreat to $0.75, it means that the coin will drop by about 10%.

Tezos price analysis

Tezos, one of the best-known players in the blockchain industry, has faced numerous challenges. For one, the company has a minimal market share in key industries like decentralized finance (DeFi) and non-fungible tokens (NFT). 

Tezos has total value locked (TVL) of more than $73 million, making it the 35th biggest chain in the world. It has also seen its market share in the NFT industry diminish. 

Data by CryptoSlam shows that the total Tezos NFT sales in the past 24 hours stood at just $47k, making it the 12th biggest player in the world. Remember, Tezos has spent millions in advertising, including by sponsoring RedBull Racing.

I also expect that the Jakarta upgrade will have no impact on the Tezos price. As we saw in June, the Nairobi upgrade have minimal impacts on the coin.

How to buy Tezos

eToro

eToro is a multi-asset investment platform with more than 2000 assets, including stocks, ETF’s, indices, commodities and Cryptoassets. eToro offers over 60+ Cryptoassets to invest or invest in their CryptoPortfolio where investors can benefit from the accumulated growth of Bitcoin, Ethereum, XRP, Litecoin and other leading cryptocurrencies. eToro users can connect with, learn from, and copy or get copied by other users.

Buy XTZ with eToro today

Binance

Binance has grown exponentially since it was founded in 2017 and is now one of, if not the biggest cryptocurrency exchanges on the market.

Buy XTZ with Binance today

The post Google Bard sets its Tezos price prediction for August appeared first on CoinJournal.

Bitcoin Cash price prediction as volatility and volume slumps

  • Bitcoin Cash, like other cryptocurrencies, remained in consolidation in July.

  • There are signs of rotation moving from digital currencies to stocks.

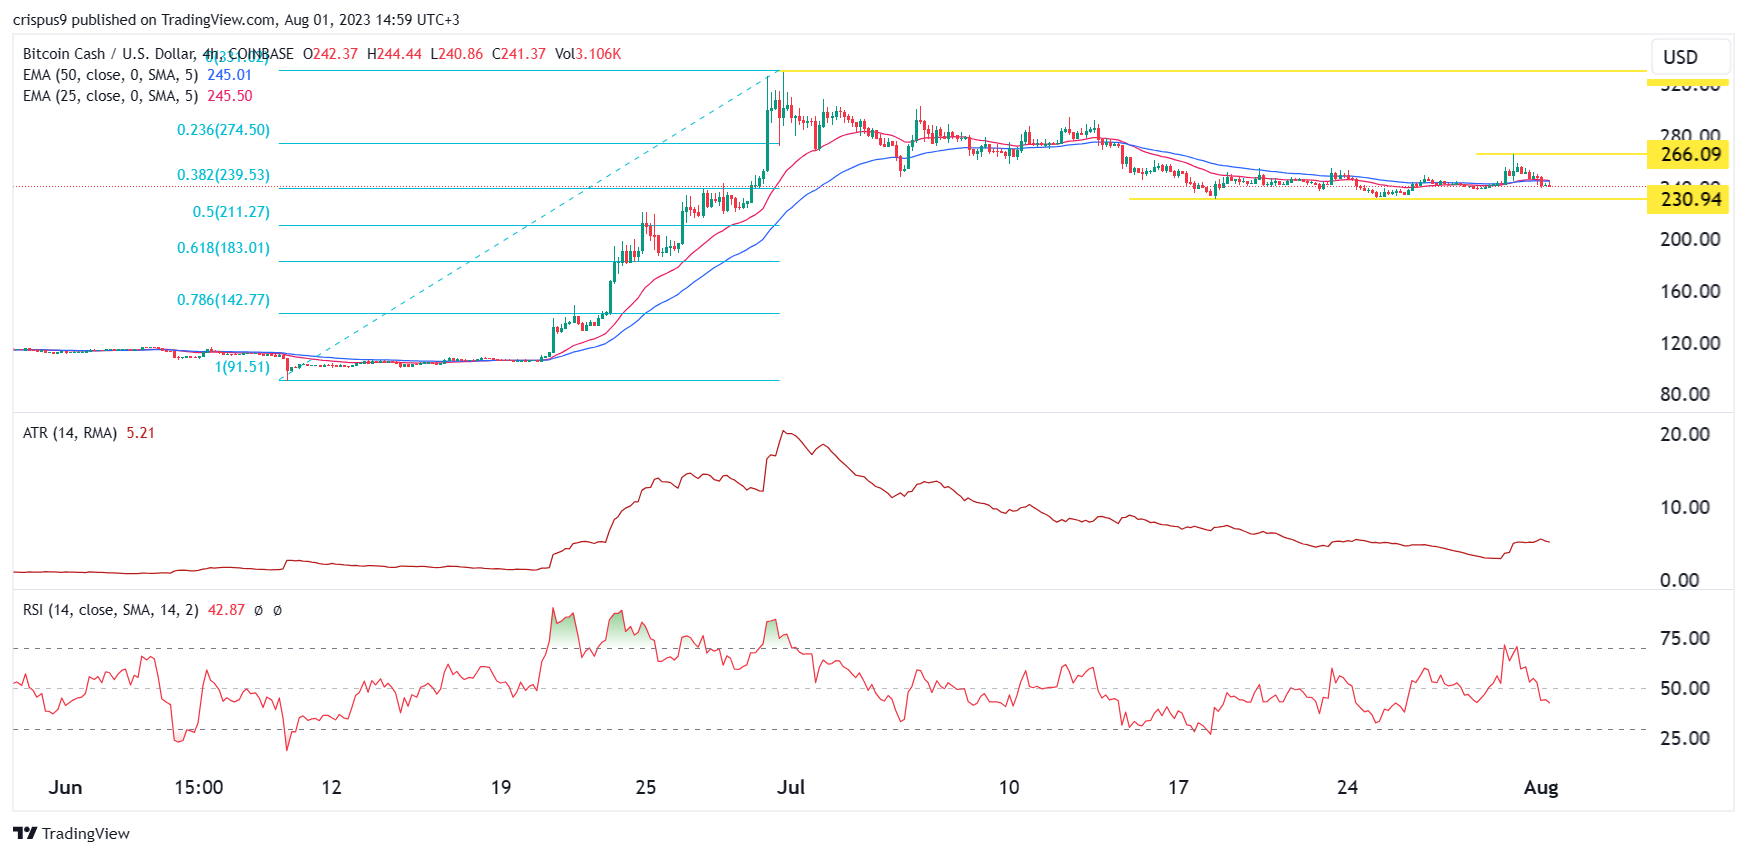
Bitcoin Cash (BCH) price had a difficult performance in July as the fear and greed index remained neutral at 50. The coin dropped to a low of $230 in July, down from the monthly high of $330.53. 

Rotation from crypto to stocks

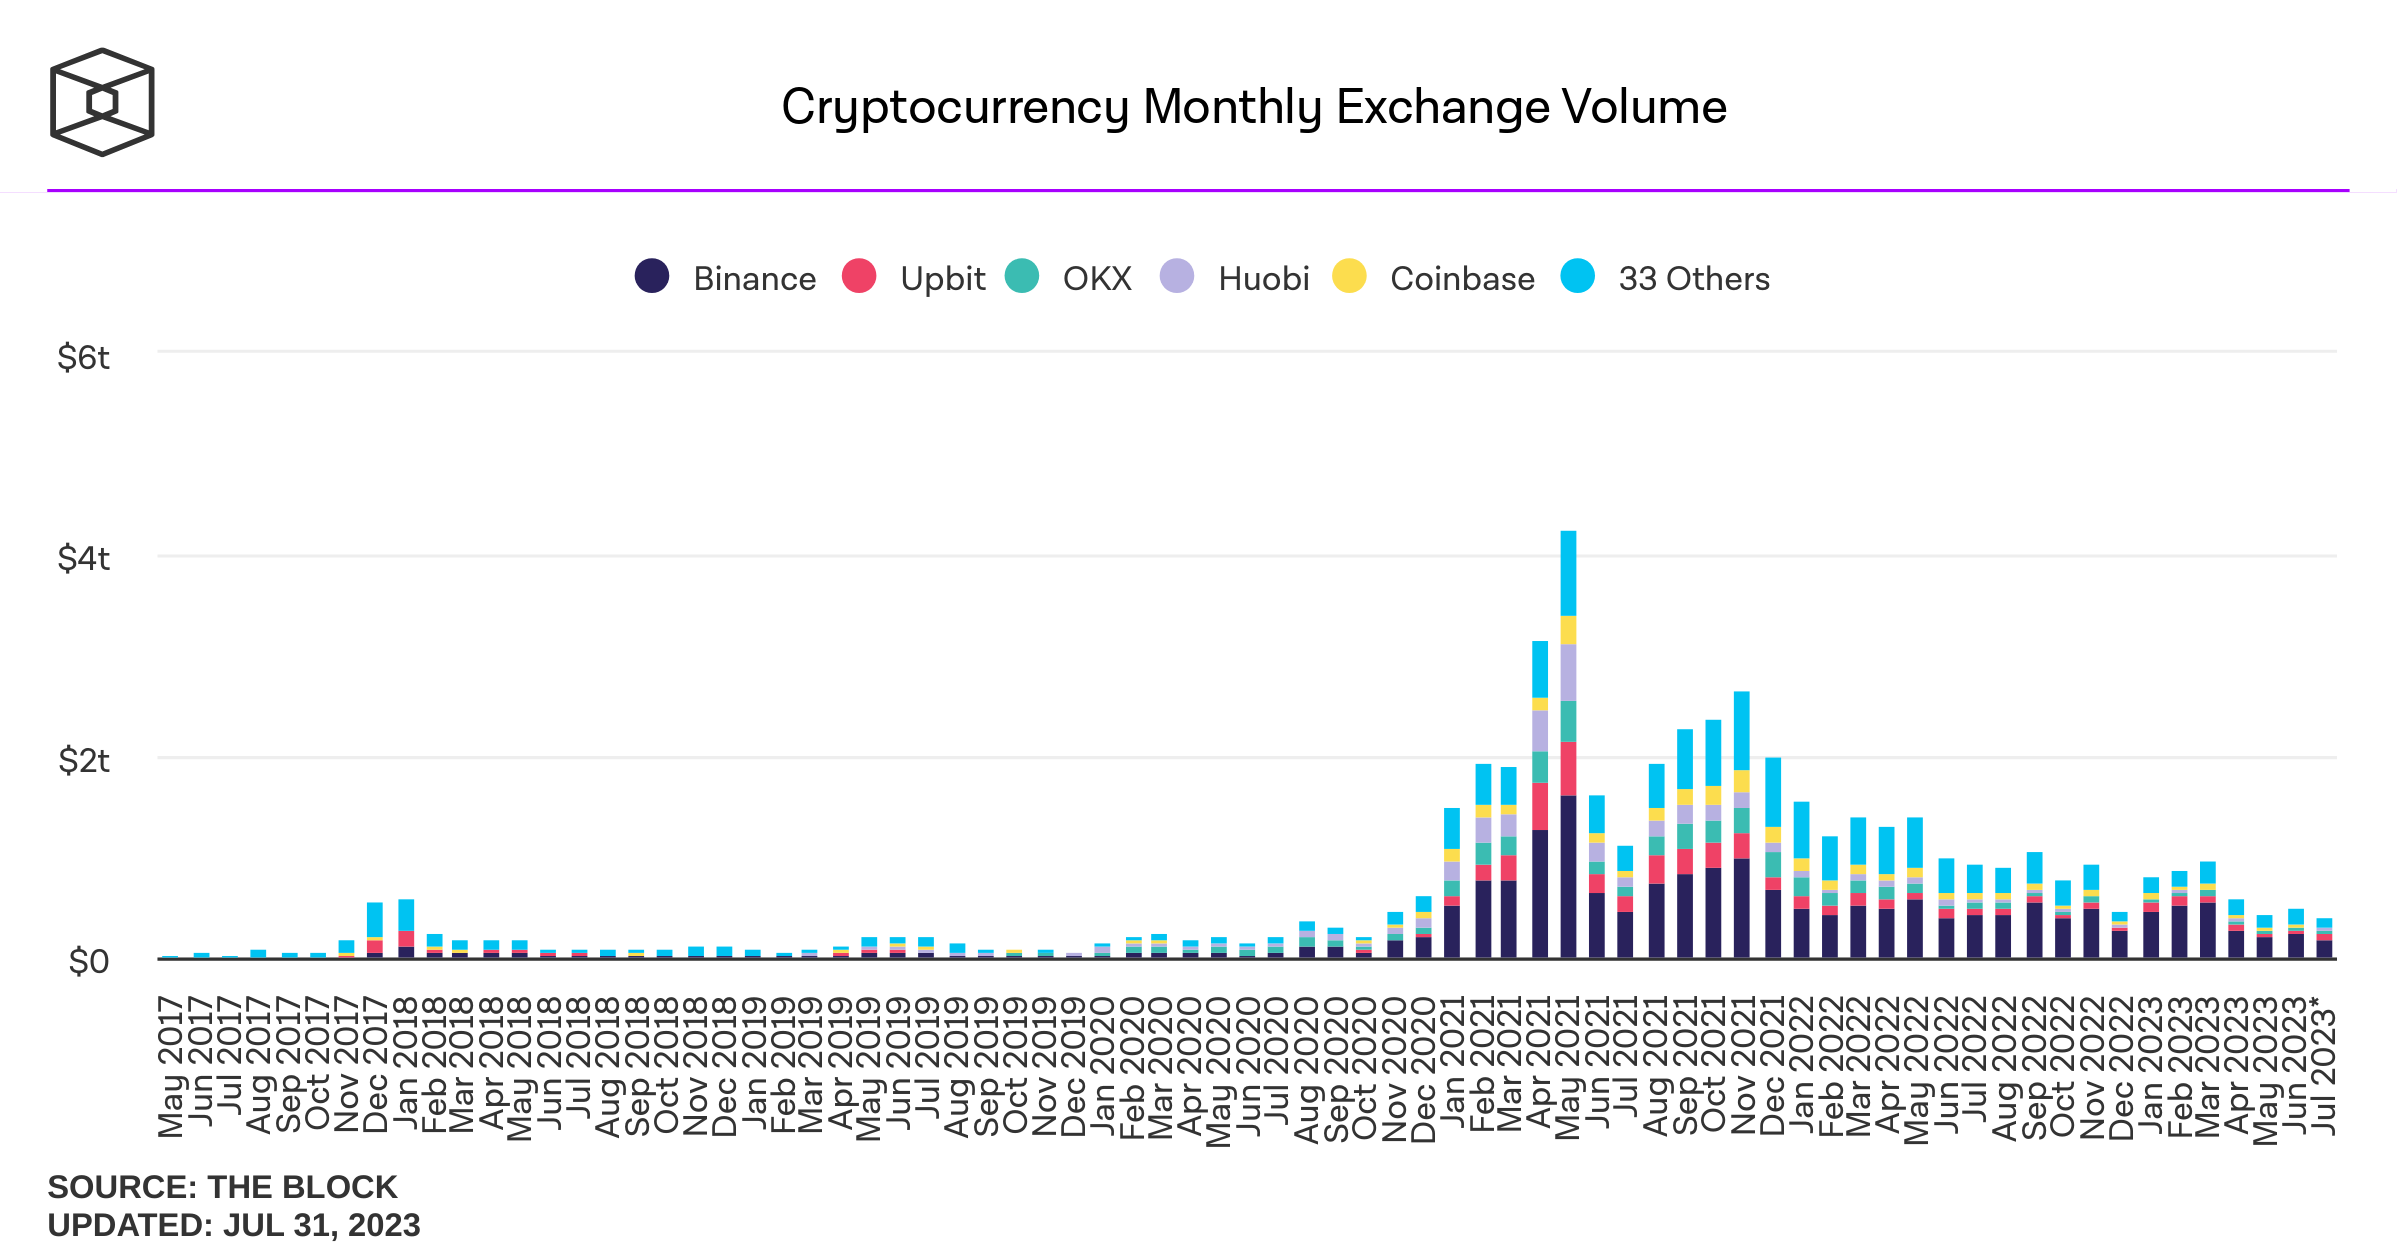
Bitcoin Cash price remained in a tight range as demand and volatility retreated. Data shows that the volume of cryptocurrencies traded in exchanges dropped sharply in July. This happened even after a number of important catalysts happened during the month.

For example, data published by the Bureau of Labor Statistics (BLS) showed that the America’s consumer price index (CPI) dropped from 4.1% to 3.0%. The closely watched personal consumption expenditure (PCE) index dropped from 4.0% to 3.1%. 

These numbers mean that the country’s inflation is falling at a faster pace than expected. As a result, investors believe that the Federal Reserve has completed hiking interest rates. It hiked them by 0.25% last Wednesday to the highest level in 22 years.

Another important crypto news in July was the partial victory by Ripple in its long-running case with the Securities and Exchange Commission (SEC). In her judgment, the judge ruled that XRP was not a financial security.

Therefore, Bitcoin Cash price likely retreated as investors moved from cryptocurrencies to stocks. The Nasdaq 100 index and S&P 500 indices surged to the highest level in months, with the former soaring by 42% this year. As a result, there is a likelihood that many crypto investors moved their funds to stocks.

Bitcoin Cash price prediction

The 4H chart shows that the BCH price has moved sideways in the past few weeks. It has moved to the 50-period and 25-period moving averages. Bollinger Bands have narrowed. The coin has moved above the key support level at $230.94, the lowest level in July.

The Relative Strength Index (RSI) has moved below 50 while the Average True Range (ATR) has retreated. ATR is one of the most popular measures of volatility. 

Therefore, there is a likelihood that the indicator will remain in this consolidation phase in the coming days. A drop below the support at $230 in a high environment will push it to the next support at $200. A move at $266 will open the possibility of the Bitcoin Cash price rising to $300.

How to buy Bitcoin Cash

eToro

eToro is a multi-asset investment platform with more than 2000 assets, including stocks, ETF’s, indices, commodities and Cryptoassets. eToro offers over 60+ Cryptoassets to invest or invest in their CryptoPortfolio where investors can benefit from the accumulated growth of Bitcoin, Ethereum, XRP, Litecoin and other leading cryptocurrencies. eToro users can connect with, learn from, and copy or get copied by other users.

Buy BCH with eToro today

Bitstamp

World’s longest-standing crypto exchange. Since 2011 Bitstamp has been providing a secure and reliable trading venue to over four million individuals and a range of institutional partners.

Buy BCH with Bitstamp today

The post Bitcoin Cash price prediction as volatility and volume slumps appeared first on CoinJournal.

Crypto’s correlation with stocks rising again following temporary deviation


Key Takeaways

  • Crypto had moved in line with stocks and other risk assets throughout the interest rate tightening cycle
  • This relationship weakened in June amid the crypto regulatory crackdown
  • The correlation has recently picked up again, however
  • Going forward, relationship may change again as the market anticipates the tightening cycle is coming to a close

We know that within the digital asset space, the different cryptocurrencies are highly correlated. As a generalisation, it is fair to say that many altcoins tend to trade like levered bets on Bitcoin. 

Going beyond the asset class and assessing correlations with other asset types becomes more interesting. One of the most intriguing trends to track is the correlation between Bitcoin and stocks. If we want to assess Bitcoin through a macroeconomic lens, its relationship with other asset classes is of vital importance. 

The last eighteen months have thrown this relationship into a new light, as correlations have been extremely high amid one of the fastest interest rate tightening cycles in recent history. With liquidity sucked out of the economy, risk assets were hammered last year, including Bitcoin. 

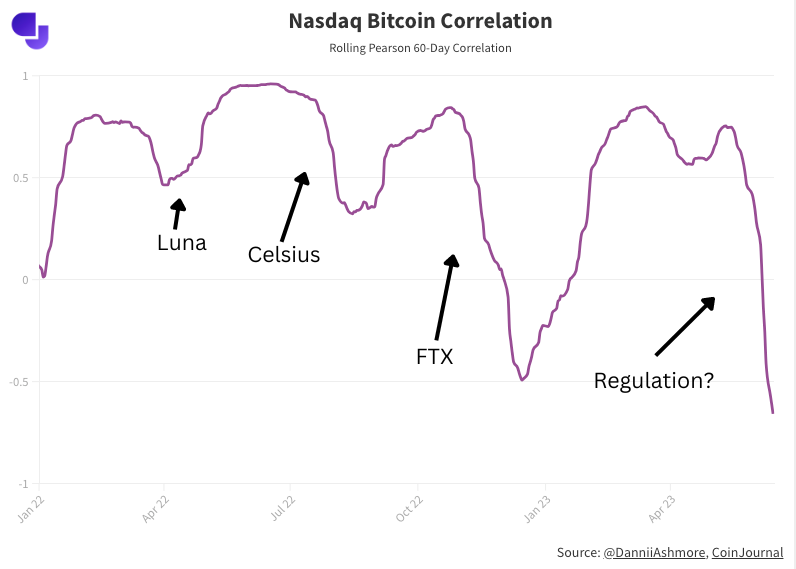
Compared to the tech-heavy Nasdaq, Bitcoin’s correlation has been persistently high throughout this period, bar a few noticeable instances. As displayed on the below chart from an analysis we compiled six weeks ago, the collapses of Luna, Celsius and FTX saw deviations in this relationship. 

These explain themselves, as dramatic crypto-specific episodes that had no effect on stocks. However, the more recent deviation was bigger than any: coming in June amid the regulatory crackdown (chart is taken from June 15th, a week after the Binance and Coinbase lawsuits). 

In fact, this deviation brought the Nasdaq’s correlation with Bitcoin to a five-year low. If we now re-run this chart, we see the correlation has picked back up again, rising to 0.5 and trending upwards.
 

This highlights what we already knew: the deviation is only temporary. It came following a month where the Nasdaq jumped 10% off softer forecasts around the future path of interest rate hikes, while Bitcoin fell 9% over the same time period as lawmakers tightened their squeeze on the industry, suing the two largest exchanges and confirming several tokens constituted securities.  

The climate has picked up for crypto since. Ripple won an important case (or, partially won, but the result was undoubtedly positive for the space), while a slew of spot ETF applications have also served to increase optimism. 

While the deviation was always going to be temporary, going forward in the medium-term, things could get more interesting. This is because, finally, the market is anticipating that the majority of interest rate hikes are in the rearview window, with perhaps only one more still to be endured, if even. 

This could release the shackles which have been around Bitcoin’s ankles, and it remains to be seen how the asset will henceforth move in relation to the stock market. We know that the correlation picked up as soon as the Federal Reserve began hiking interest rates; correlations go to 1 in a crisis, and there is a flight to quality – risk assets suffer in that scenario, and that is exactly what we saw. 

There is every chance that both stocks and Bitcoin will continue to trade in tandem, but if/when this tightening cycle ends, it will at least give the market a fresh opportunity to trade them whilst global liquidity is not being pulled off the table. 

Regardless of the relationship between the duo, the below chart shows just how dependent Bitcoin has been on yields – the two-year treasury yield, plotted on an inverse scale, has moved exceptionally closely with Bitcoin, ever since the latter’s all-time high in November 2021. 

How will Bitcoin’s relationship with gold change?

It is Bitcoin’s relationship with gold that provides an equal amount of intrigue, given the former’s designs on becoming some sort of digital equivalent of the latter. Should Bitcoin become a store of value, it will need to become a little more boring with regard to price movements – something gold is well known for. 

However, correlation between the two assets has dipped, moving in the opposite direction to that of stocks. From rising markedly this year, it has fallen sharply in the last month. 

If Bitcoin is to achieve what so many want to do – become an uncorrelated asset capable of offering a portfolio hedge properties – it must flip the script here. Its relationship with stocks will need to loosen, while it will need to get closer to the way gold trades. 

Having said that, Bitcoin has been around only 14 years, and has traded with reasonable liquidity for far less than that. It is still finding its feet, and it remains early – certainly compared to gold, which has been around for thousands of years. 

The post Crypto’s correlation with stocks rising again following temporary deviation appeared first on CoinJournal.

Bitcoin volatility at three-year low as crypto markets lull


Key Takeaways

  • Crypto volatility has been dropping all year, with Bitcoin’s volatility now at three-year lows
  • Volume is also dropping, as the calm markets are not welcomed by traders
  • Despite downward-trending volatility, crypto remains highly volatile when compared to other asset classes

Crypto markets are known for violent volatility, capable of both spiking and collapsing in the blink of an eye. 

Thus far this year, however, that hasn’t been the case. Volatility has been trickling steadily downward across the space. Assessing the realised volatility of Bitcoin over a rolling one-month window, the metric is currently at a three-year low. 

This comes despite Bitcoin having had a bumper year thus far, the asset currently up 76%, treading water around the $30,000 mark. In the past, Bitcoin has oscillated wildly, but this run-up from the low of $15,500 late last year has been distinguished by a steady climb rather than the turbulent ups and downs we have come to expect. 

The pattern is not unique to the world’s biggest crypto, either – volatility is falling across the board. The easy way to illustrate this is by looking at Ether. Historically, the price of ETH has been more volatile than BTC, but the divergence has narrowed this year, and Ether is now trading with similar volatility to its big brother. 

This relative calm in crypto markets is good on one level, given one of Bitcoin’s most-cited criticisms is its extreme volatility, which most agree it will need to overcome should it ever take the status of a reputable store of value. 

Not everyone is a winner, though. Traders rely on volatility and hence these serene times are not exactly a boon. If we look at spot trading volume, the drawdown has been steep. Granted, there are myriad factors at play here, including regulation, a drawdown in prices, lockdowns ending, scandals (FTX and the SEC lawsuits) and so on, but the lack of volatility is not helping. 

The below chart from The Block shows quite how far spot volume has fallen. 

Even derivatives trading volume, which had been more stout, has fallen off since April – likely a better gauge for traders than assessing spot volume. Liquidity is not as much of a concern in derivatives markets as it has become in spot markets, but the last few months have begun to see some thinning out there, too. 

While the falling volatility is notable, it should be noted that crypto remains a league above trad-fi markets with regard to this metric. Even this three-year low still translates to an annualised volatility of 25% for Bitcoin, which would not be deemed low-risk by any stretch of the imagination. 

To put this up in lights, comparing Bitcoin to gold is always illustrative. Gold is the store of value which has been around for thousands of years, the shiny metal known for its inflation-hedging abilities and lack of correlation to risk assets. For many, Bitcoin’s vision is to claim the title of some sort of digital gold. 

The below chart displays the current gulf between these assets – even after the dampening down in crypto volatility this year, it’s on a completely different planet to gold. 

Alternatively, one can simply compare the daily returns of the assets, which conveys the same thing. 

Thus, while crypto volatility is currently sluggish, it has a long way to go before it matches gold. More importantly, there is no guarantee that this volatility will stay low. Quite the opposite – given the low liquidity in the space, less capital is needed to move crypto markets than has been the case previously. 

In light of this, it feels like the downward trend in volatility (exacerbated in the last couple of months by a classic summer lull in trading) should return. Not to mention the fact that with the interest rate hiking cycle coming to a close, markets could be at an inflection point. It is always hard to predict the future in crypto, but it feels unlikely that digital assets’ volatility will stay at these uncharacteristically low levels for long. 

The post Bitcoin volatility at three-year low as crypto markets lull appeared first on CoinJournal.