Should you buy LTC as it consolidates at key resistance?

  • Litecoin is currently trading at $60.94, a 1.76% dip in the past day

  • The pair is in a consolidation amid bullish indicators

  • Investors should wait for it to clear above the level

Cryptocurrencies are currently on a retracement following an industry-wide recovery. Bitcoin and Ethereum are down 3.8% and 1.92% in the past day. Litecoin’s LTC/USD dipped 1.76% in the same period.

Created in 2011, Litecoin is one of the earliest blockchains. It was forked from bitcoin as an improvement of the proof-of-work network. The platform is more scalable with a faster block time and a larger token supply. It also uses the Scrypt hashing algorithm to reduce energy consumption.

Despite being a hard fork of Bitcoin, LTC has failed to stage a recovery similar to that of the latter. LTC has gained a paltry 4% in the past month compared to 25% in BTC. This takes into consideration the wide market cap difference between the two. While bitcoin has a valuation of $454 billion, LTC is at a fraction of that with $4.3 billion.

Currently, LTC/USD is changing hands for $60.94. Its trading volume is down 17.39% at $437,281,262. Aside from the dynamics in price and volumes, LTC has important technical levels to watch.

LTC consolidates at the $61 resistance level
Source: TradingView

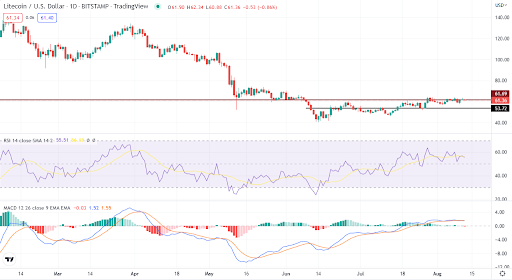
According to the daily chart above, LTC is consolidating around $61 resistance. The token’s attempts to break above the level have been resisted three times since June 25. Nonetheless, the chart shows that the technical indicators favor the bulls, and the token could break above. 

The RSI is currently at 55. Although the momentum indicator can be interpreted as neutral, more traders are buying the token than selling it. The MACD is above the signal lines with the histograms on the green. However, investors should exercise patience until the token clears above the resistance.

Bottom line

Litecoin has strong fundamentals around efficiency and faster transaction speeds. Its native LTC token is consolidating at an important resistance level amid strong bullish momentum. Patience is recommended until the tokens clear the level.

The post Should you buy LTC as it consolidates at key resistance? appeared first on CoinJournal.

Hedera Hashgraph prediction as price reclaims the $0.074 level

Hedera HBAR Coin Logo

  • Hedera Hashgraph is a smart contract platform that uses an algorithm for fast transactions

  • HBAR has reclaimed the $0.074 level after 10% gains in the week

  • HBAR could consolidate, but $0.074 remains the reference support

Hedera Hashgraph HBAR/USD has surged by more than 10% in the past 7 days. The gains have propelled the token to higher levels, reclaiming a major resistance. If trading HBAR, it is important to watch key levels where the price may face indecision.

Hedera Hashgraph is a blockchain that promises to deliver secure and fast transactions. The blockchain aims to achieve the objective through a distributed consensus algorithm. Hedera also seeks to enable anyone to deploy applications on the platform for true decentralization.

Hedera Hashgraph may not be the strongest cryptocurrency this year. Since bottoming at $0.06 in mid-July, it has been making very slow gains. That is despite most other cryptocurrencies staging strong recoveries. Nonetheless, recent recoveries may be a tip of what is about to come for the token.

Hedera Hashgraph begins recovery, but momentum is weak

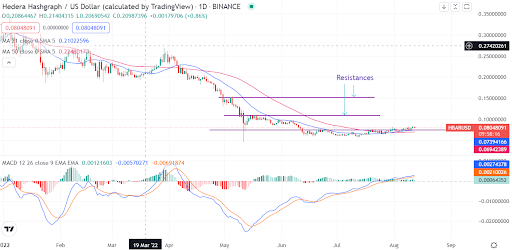
Source – TradingView

From the daily chart outlook, the 21-day and 50-day moving averages have joined a support for HBAR. The 21-day MA has closed above the 50-day MA as bullish momentum builds. The MACD indicator also points to building momentum. The price is well supported above $0.074, suggesting that HBAR has set new reference support. The token is moving along an uptrend.

Concluding thoughts

If considering buying HBAR, the $0.074 should be the reference level. Nonetheless, with the weak momentum, the token could continue to consolidate. Consequently, HBAR is not the best token for short-term buyers. Dip and long-term buying are recommended.

If HBAR keeps $0.074 intact, the next levels to watch are $0.10 and $0.15. The cryptocurrency could also face some resistance at $0.09.

The post Hedera Hashgraph prediction as price reclaims the $0.074 level appeared first on CoinJournal.

Is Uniswap about to go lower after a MACD crossover?

  • Uniswap was one of the strongest tokens in July on strong fundamentals

  • The Uniswap protocol proposes a new foundation to support growth

  • UNI is holding a key level, but bear weakness could heighten

After a strong rally recently, Uniswap UNI/USD bull run is weakening. A more than 3.40% drop in the last seven days illustrates the weakening momentum. However, UNI has kept a key level, sending mixed signals about the next potential move.

Uniswap’s gains in July were connected to improved sentiment in the crypto sector. The price surge, in particular, came from the projected Ethereum merge. That boosted DeFi tokens such as Uniswap. Another development in the month was the listing of the token on Robinhood. UNI hit a high of $9.8 on July 28 following the monthly rally. The price was from a low of $4.0 at the beginning of the month.

The latest development was the creation of the Uniswap Foundation. Announced in early August, the foundation would support the growth of the protocol. It will champion the creation of a $60 million fund to fund various projects. Uniswap creator Hayden Adams expects the foundation to build a protocol that “thrives.” The development is yet to cause any impact on UNI but underlines the protocol’s long-term map plan.

UNI holds $8.4 support intact despite MACD crossover

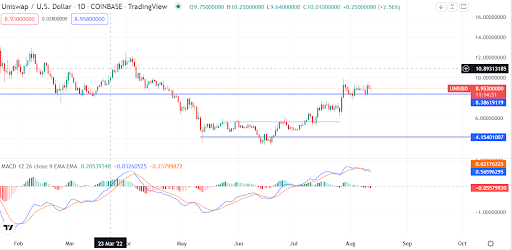
Source – TradingView

From the technical outlook, the MACD line crossed below the signal line. The crossover comes after UNI consolidated and weakened slightly above the $8.4 support. The cryptocurrency has also maintained the uptrend in a system of higher highs and higher lows.

Concluding thoughts

The MACD crossover sends mixed signals for UNI traders. However, as long as the token keeps $8.4 support, it has a chance to go higher. Investors should watch for bullish signs. If the token crashes below $8.4, that will be set on course for further correction. The next level is $6.5 and $5.6.

The post Is Uniswap about to go lower after a MACD crossover? appeared first on CoinJournal.

EWT price prediction as Energy Web Token jumps

The EWT price jumped sharply on Friday as demand for the coin rose. The Energy Web Token rose to a high of $4.56, which was the highest level since May this year. It has risen by more than 85% from the lowest level this year, giving it a market cap of over $170 million. 

What is Energy Web Token?

The world is facing an urgent need to solve the ongoing climate crisis. One way this is happening is through vast investments in electric vehicles and the overall switch to clean energy, 

Energy Web is an organization that is seeking to have an impact in the sector. It builds operating systems for energy grids with the goal of powering the zero-carbon economy. 

In the past few years, the company has deployed its operating systems for energy grids in more than 100 energy participants. For example, in Australia, it runs Energy Demand and Generation Exchange (EDGE). The product helps the company deploy Distributed Energy Resource (DERs). 

Energy Web has also developed EW Zero, an ope source tool for purchasing renewables and carbon removal. Further, it has built an e-mobility dashboard for Elia Group that helps to exchange data from EVs, charging stations, and grid operators. 

In total, Energy Web has over 50 projects in 25 countries. Some of the top companies that use its solution are Protocol Labs, Google, Volkswagen, and Filecoin.

EWT is the native token for Energy Web platform. It is used by participants in the ecosystem to provide utility. The EWT price jumped sharply after the company was mentioned by Blackrock, the biggest asset manager in the world with over $10 trillion in assets. The company said:

“BlackRock is encouraged that organizations such as RMI and Energy Web are developing programs to bring greater transparency to sustainable energy usage in bitcoin mining, and will follow progress around those initiatives.”

EWT price prediction

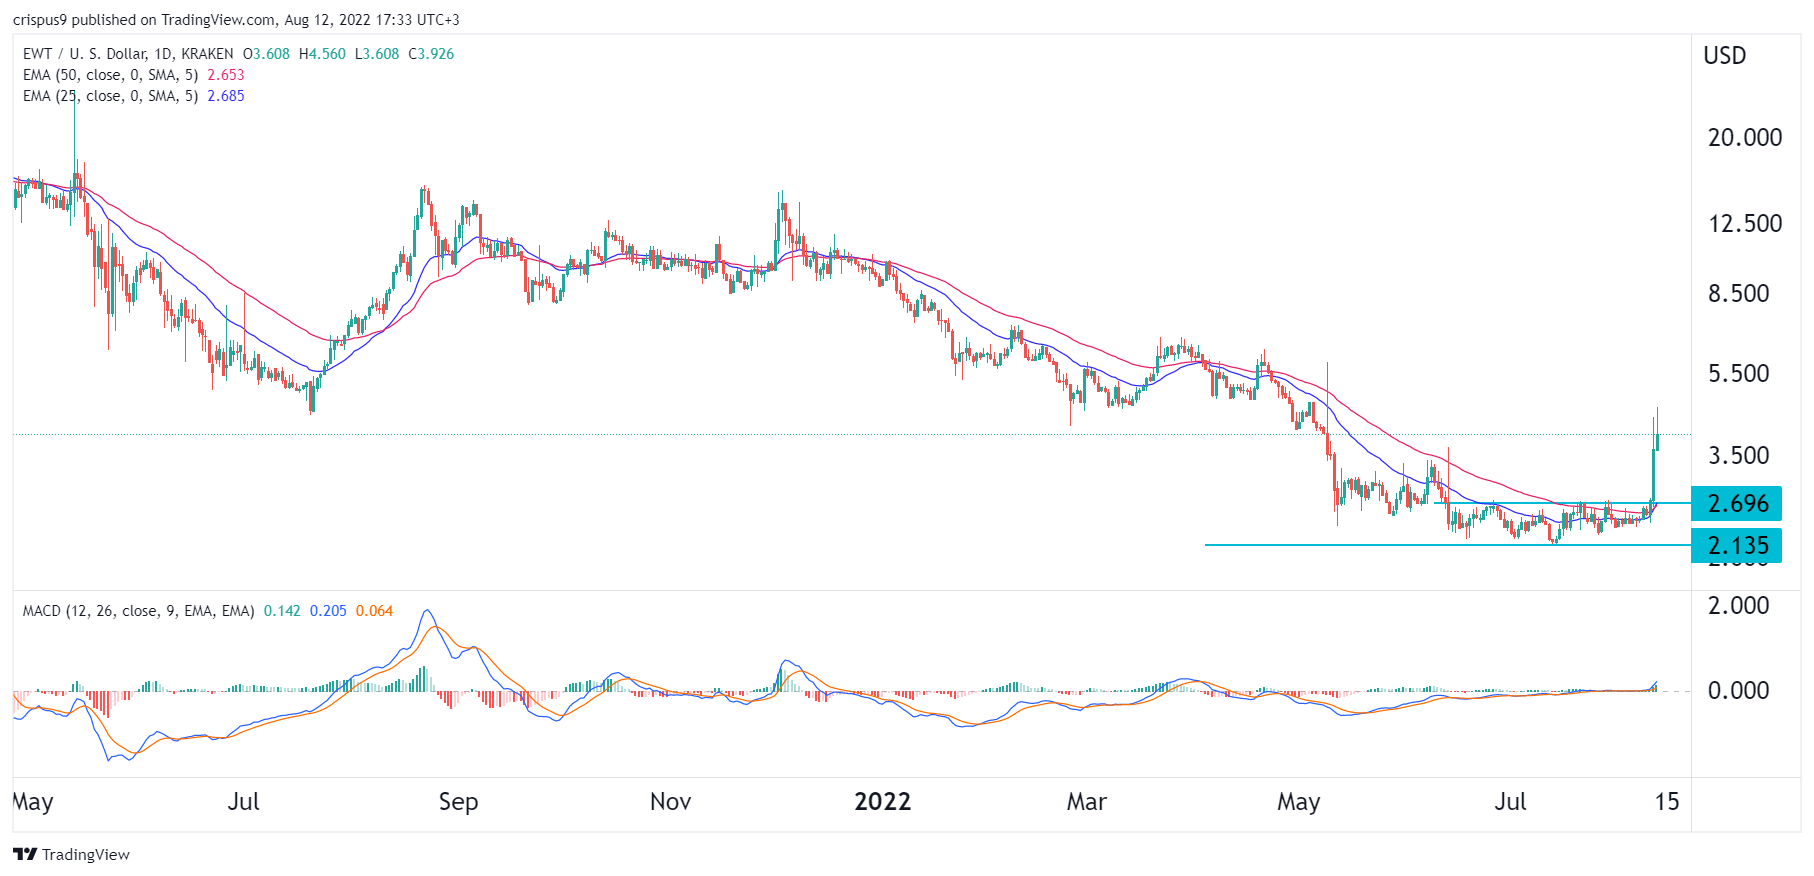
The four-hour chart shows that the EWT price found a strong support at $2.13 this year. It struggled to move below the level several times this week. The coin has managed to move above the 25-day and 50-day moving averages while the MACD has moved slightly above the neutral point. 

Therefore, the Energy Web Token will likely resume the downward trend as the Blackrock hype fades. If this happens, the next key support to watch will be at $2.70, which was the highest point on July 21st.

The post EWT price prediction as Energy Web Token jumps appeared first on CoinJournal.

Here’s why the Huobi Token price went parabolic and what next

Huobi Token price went parabolic on Friday after Bloomberg reported that the company’s founder was seeking to sell majority of his stake. The HT price surged to a high of $5.90, which was the highest level since June 13th of this year. This price was about 35% above the lowest level this year, giving it a market cap of over $813 million.

Huobi to be sold?

Huobi Global is a leading blockchain exchange that was established by Leon Li, a Chinese entrepreneur. The company runs an exchange that processes over $1 billion worth of transactions on a daily basis. It has millions of customers and competes with the likes of Coinbase and Binance.

According to Bloomberg, Li is in talks to sell 60% of his stake in the company. Such a deal will value the entire company at over $3 billion. This means that Li will raise about $1 billion from the sale. It will be the biggest buyout in an industry that is facing significant pressure.

Sam Bankman-Fried’s FTX is one of the companies that could acquire Huobi. If a deal closes, it will give the company a leg-up in the vast Asian market. Bloomberg also said that Justin Sun is also a potential acquirer, a statement that he rejected. Further, it is unclear whether the company’s sale will involve that of Huobi Technology, a publicly traded company.

Like other popular crypto exchanges like OKX, FTX, and Gate.io, Huobi Global has its own token known as HT. The token works to incentivize people to use its platform. Still, a purchase of Huobi will not have an impact on the token. The token’s price action is usually dependent on the overall market action in the crypto industry.

Huobi Token price prediction

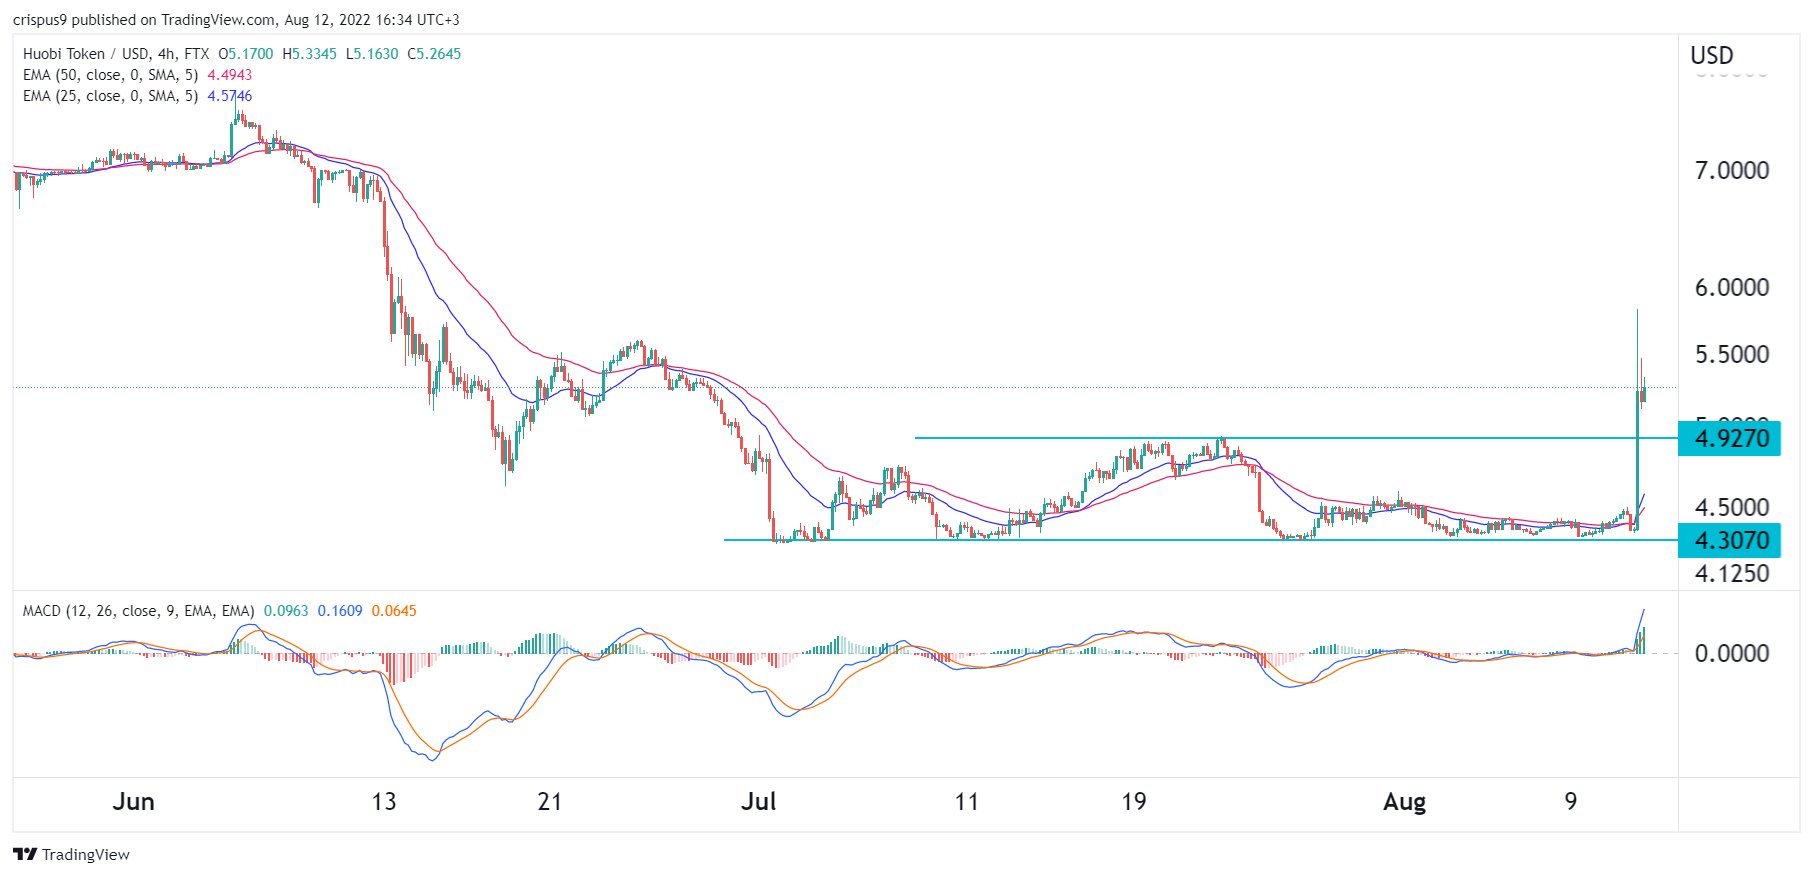
The daily chart shows that the HT price found a strong support at $4.3070 this year. It struggled to move below that level several times. Additionally, the coin lagged that of other cryptocurrencies during the recovery.

Huobi Token managed to move above the important resistance level at $4.92, which was the highest point on July 23rd. It also rose above the 25-day and 50-day moving averages. Therefore, while the acquisition rumours are positive for the coin, there is a likelihood that the price will drop and retest the support at $4.927.

The post Here’s why the Huobi Token price went parabolic and what next appeared first on CoinJournal.