UFT price: What is UniLend Finance and Why Did it Just Soar?

UFT price went parabolic on Friday as demand and volume for the token rose. UniLend Finance’s token climbed to a high of $0.400, which was the lowest level since April of this year. It has jumped by over 475% from its lowest level in 2022, giving it a market cap of more than $22 million.

What is UniLend Finance?

UniLend Finance is a relatively small but fast-growing blockchain project that is in the decentralized finance (DeFi) industry. It was launched a few years ago to compete with larger platforms like Compound, Aave, and Maker.

The idea was to create a platform where users can trade more assets than those offered in those large projects. By so doing, the developers aimed to create a platform that has thousands of assets. To achieve that, they created a system that allows permissionless listing and one that allows lending and borrowing and trading among users.

There are several reasons why the UFT price has jumped in the past few weeks. First, the platform has continued to grow its ecosystem through partnerships. Early this week, UFT was listed on DEXTools, where users can easily track UFT pools in real time. 

It also reached a partnership with UpBots, which describes itself as a gateway for cryptocurrencies. Some of the other most recent partners are Algo Blocks and Life Labs. It now has over 100 partners, including Binance. Unilend Finance price is also jumping as investors wait for the upcoming Omnis mainnet launch. 

UFT price prediction
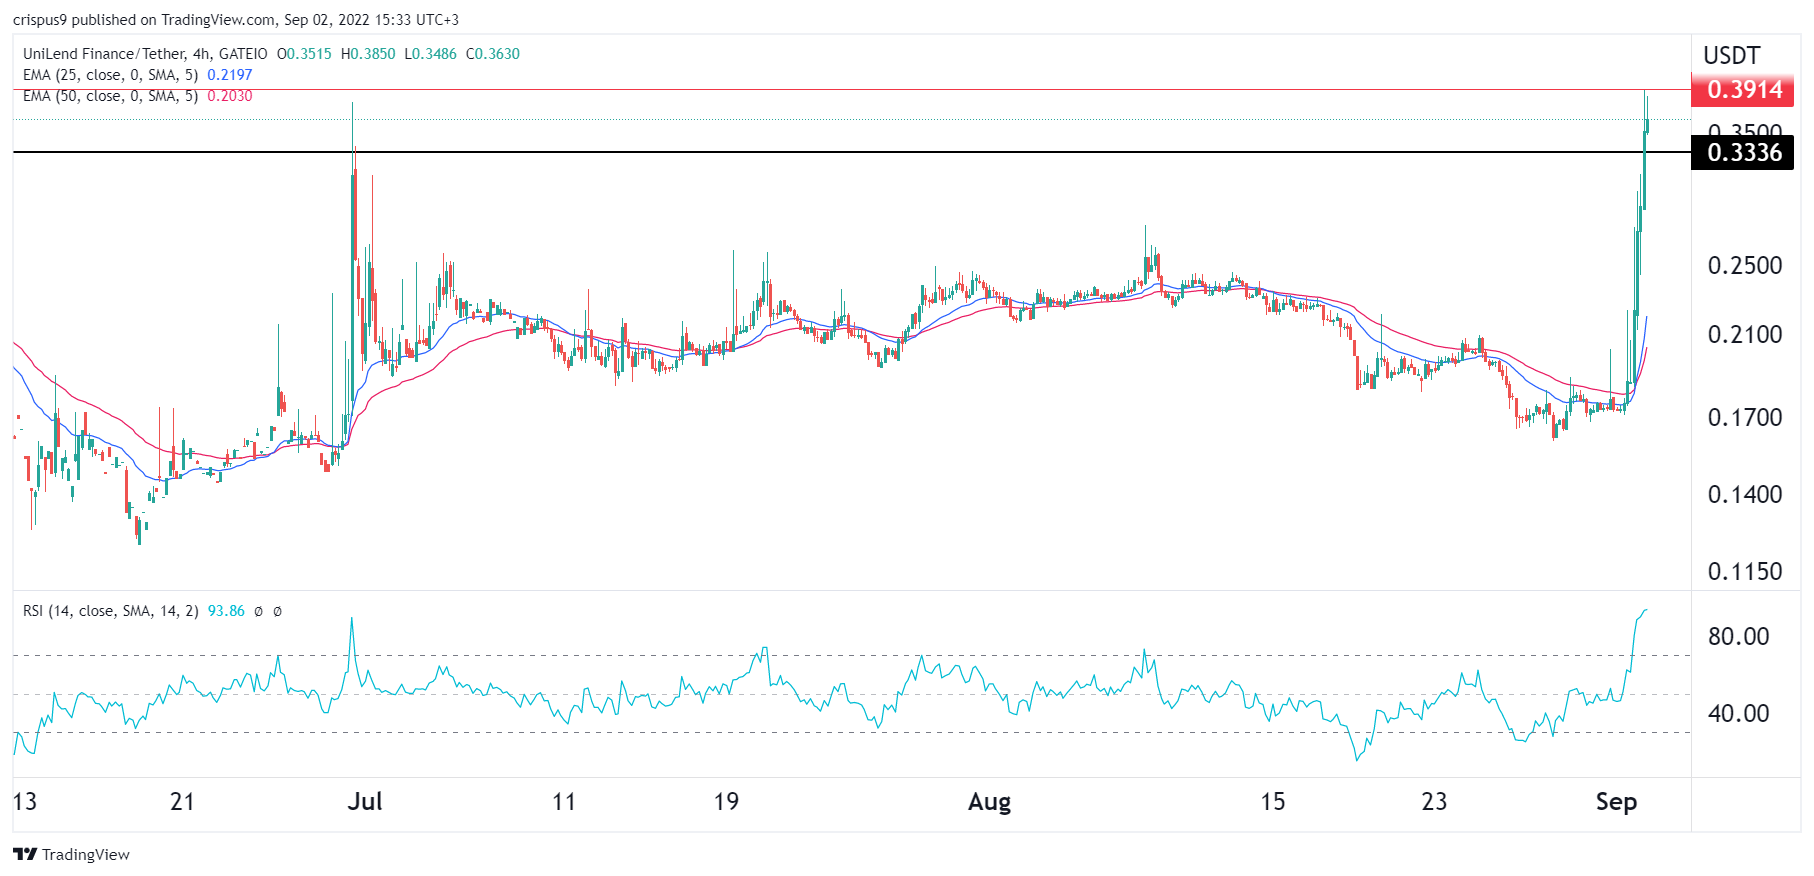
The four-hour chart shows that the UFT price has been in a bearish trend in the past few days. It then went parabolic on Thursday and Friday as the developers launched several partnerships. As it rose, it managed to move above the important resistance level at $0.3335, which was the highest point on May 26. 

As expected, the coin managed to rally above the 25-day and 50-day moving averages while the Relative Strength Index (RSI) moved to the extreme overbought level. The same is true with other oscillators like the Money Flow Index (MFI) and Stochastic have moved to their overbought levels.

Therefore, there is a likelihood that the coin will pull back sharply in the coming days. If this happens, the next reference level to watch will be at $0.25, which is about 30% below the current level.

The post UFT price: What is UniLend Finance and Why Did it Just Soar? appeared first on CoinJournal.

MATIC is up by 6% today following Robinhood support

MATIC is up by more than 6% today as the cryptocurrency market looks to end the week on a positive note.

MATIC, the native token of the Polygon network, is the best performer amongst the top 20 cryptocurrencies by market cap. The coin has added more than 6% to its value in the last 24 hours, outperforming the broader market. 

The broader crypto market is also recovering from its recent decline and could end the week on a positive note. The total market cap now stands around $990 billion, up by more than 1% today.

Bitcoin maintains its position above $20k and is up by more than 1% over the last 24 hours. Ether is eyeing the $1,600 resistance point after adding 3% to its value today.

MATIC’s positive performance comes after it announced that Robinhood had launched support for deposits and withdrawals of MATIC on the Polygon Proof-of-Stake (PoS) chain.

The Polygon team said the move is expected to bring all of the benefits of Ethereum’s Layer-2 (L2) solutions to Robinhood users for the first time. Some of these benefits include faster transactions and lower fees as compared to Ethereum.

Key levels to watch

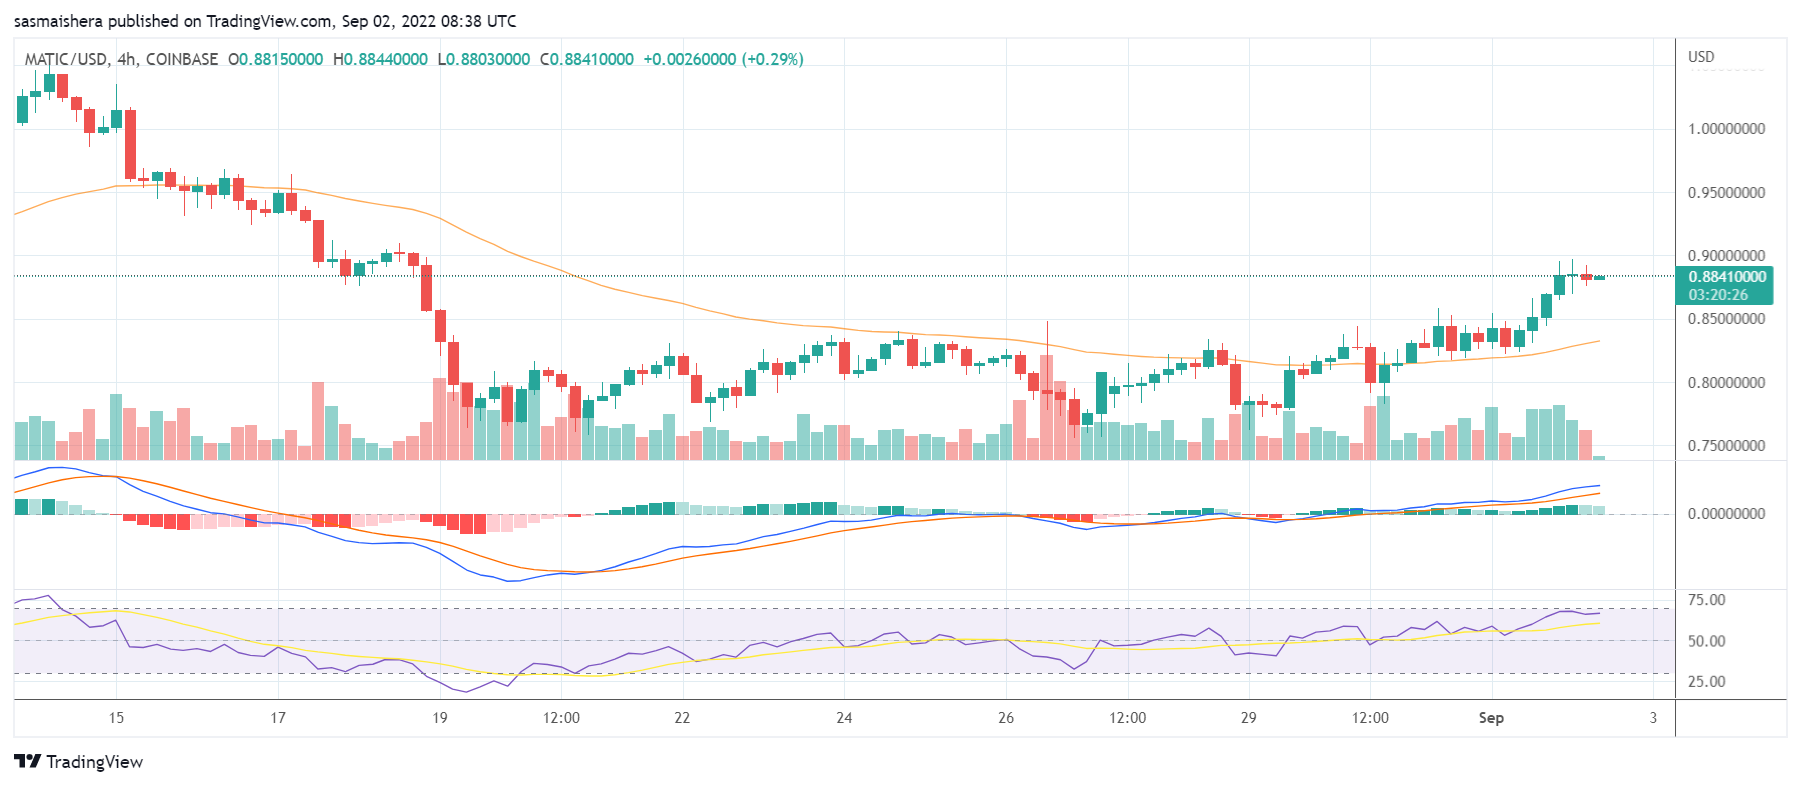
The MATIC/USD 4-hour chart is positive, as Polygon has been performing well over the past 24 hours. The technical indicators show that MATIC’s metrics are improving following a slump earlier this week.

The MACD line is above the neutral zone, indicating bullish momentum for MATIC. The 14-day RSI of 65 shows that MATIC could be heading into the overbought region if the positive momentum is maintained.

At press time, MATIC is trading at $0.8853 per coin. If the bulls remain in control, MATIC could surge past the first major resistance level at $0.9489. 

However, unless there is an extended bullish run, MATIC could find it hard to break past August’s high of $1.057 in the near term. 

The post MATIC is up by 6% today following Robinhood support appeared first on CoinJournal.

Litecoin price prediction: LTC could crash to $40 in September

Litecoin price was in a tight range on Thursday as investors started to reposition their assets for September. The LTC coin rose slightly to a high of $55.80, which was slightly above this week’s low of $52.36. Its market cap stands at over $3.2 billion.

Hawkish Federal Reserve

Litecoin price has been under pressure as investors focus on the hawkish tone by the Federal Reserve. In a statement at the Jackson Hole Symposium at Wyoming, Jerome Powell insisted that the bank will continue hiking interest rates in the coming months.

His sentiment was shared by other Federal Reserve officials like Charles Evans and Neel Kashkari. In a statement on Wednesday this week, Cleveland Fed’s Loretta Mester said that the bank will continue hiking and also maintain high interest rates until inflation moves to 2%.

Historically, cryptocurrencies like Bitcoin and LTC tends to underperform in periods of a hawkish Federal Reserve. This also explains why cryptocurrencies and stocks have continued their bearish trend in the past few months. Indeed. American stocks have fallen in the past five straight days.

Litecoin price has also underperformed because of the sluggish demand for the coin. With cryptocurrencies down by more than 50% this year, many users of LTC have stayed away. This is evidenced by on-chain data that show weak demand in the ecosystem.

Meanwhile, the coin has lagged because of the significantly strong US dollar. The US dollar index has jumped to the highest level in over 20 years. Litecoin and other cryptocurrencies have an inverse correlation with the US dollar.

Litecoin price prediction

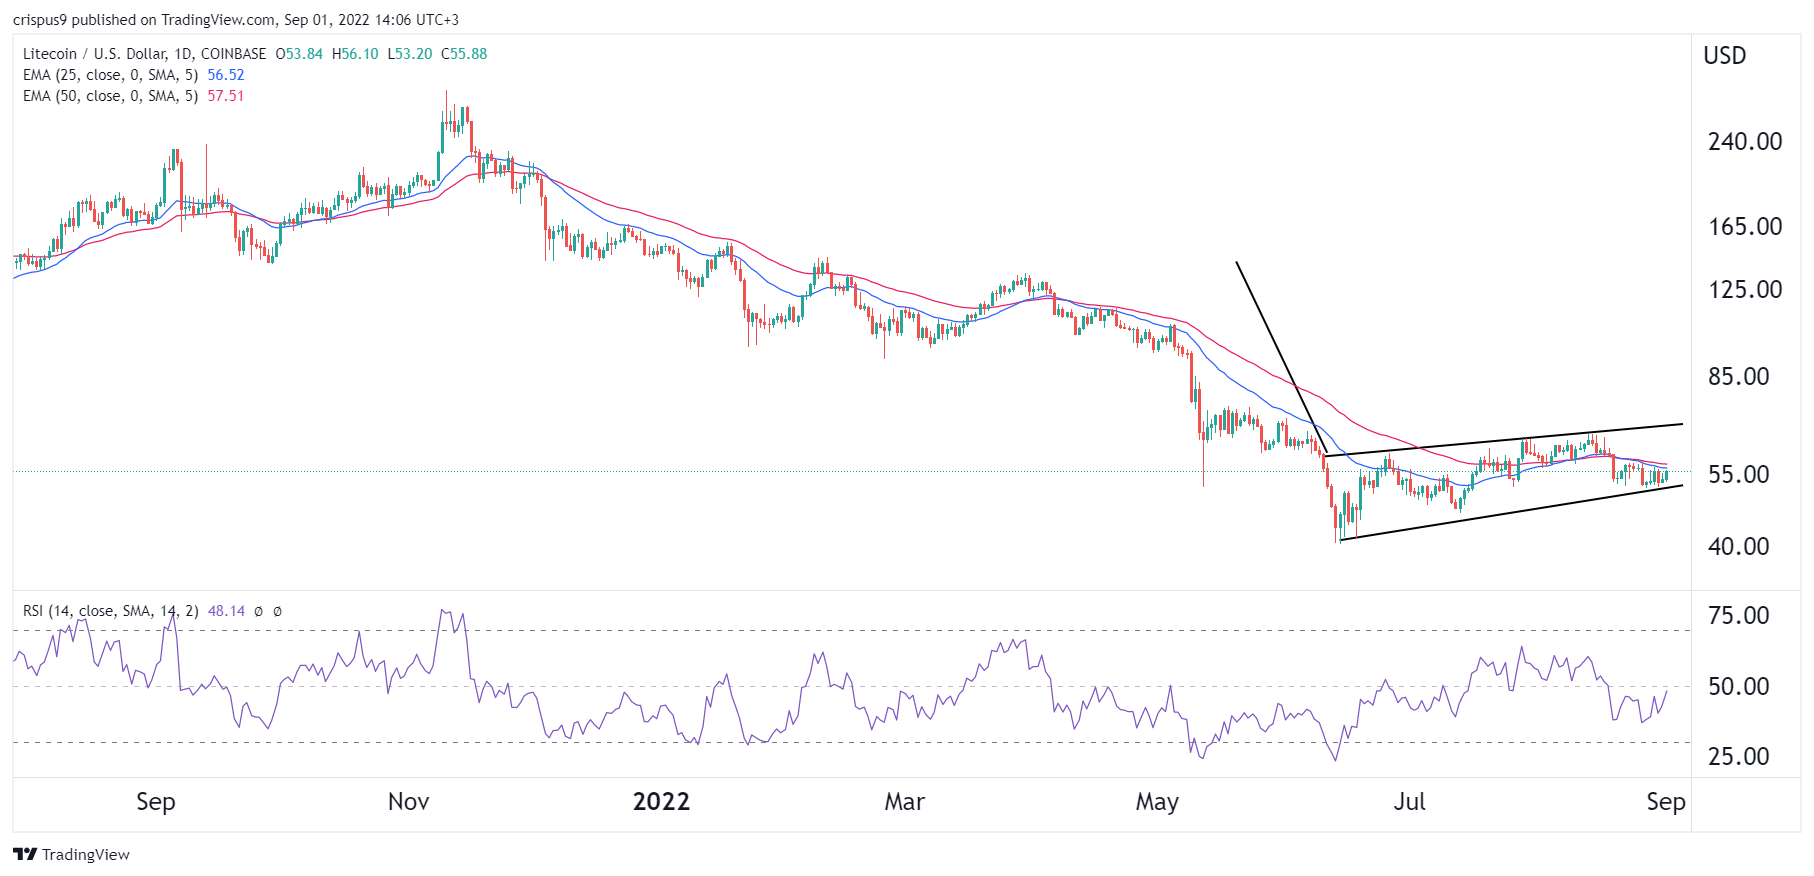
The daily chart shows that the LTC price has been under pressure in the past few months. It has fallen by 86% from the highest level in 2021. A closer look shows that the coin has formed a bearish flag pattern, which is usually a bearish sign. 

It has moved below the 25-day and 50-day moving averages while the Relative Strength Index (RSI) has moved below the neutral point at 50. Therefore, there is a likelihood that the coin will have a bearish breakout in September. If this happens, the next key support level to watch will be at $40.

The post Litecoin price prediction: LTC could crash to $40 in September appeared first on CoinJournal.

Mirror Protocol price is in a recovery mode. Is MIR a good buy?

Mirror Protocol price bounced back on Thursday as cryptocurrencies in the Terra ecosystem jumped. The MIR token rose to a high of $0.20, which was about 32% above the lowest level this year. Its market cap jumped to about $15 million, which is lower than the all-time high of over $700 million.

What is Mirror Protocol and why is it rising?

Mirror Protocol was once one of the leading platforms in the blockchain industry in the Terra ecosystem. It is a platform decentralized finance (DeFi) that allowed people to trade financial derivatives in all assets like currencies, stocks, and commodities.

Therefore, instead of using a regulated broker like Robinhood, users can easily buy these financial assets in Mirror Protocol. It used Band Protocol’s oracle system to provide these price feeds.

On August 15, Band Protocol announced that it will cease providing price feeds for Terra Protocol and its products like Mirror Protocol. It attributed this situation to the collapse of UST, the heart of the Terra Chain. 

In addition, Band Protocol noted that Mirror Protocol’s team had failed to respond to its queries about its future. The statement added that:

“Users’ safety is the top priority for Band as an infra developer and we cannot support protocols if we’re unsure. Community members are encouraged to contact the Mirror team directly for any enquiry.”

Therefore, without these price feeds, and without any communication from Mirror, it means that the project is no longer running. In the past, Mirror was actually accused of being a pyramid scheme.

MIR price is bouncing back as investors cheer the strong performance of both Terra Luna Classic and Terra Classic USD. LUNC has jumped by more than 80% in the past 24 hours while USTC has soared by 51% in the same period. Similarly, Anchor Protocol and LUNA prices have jumped by more than 25%. 

Is Mirror Protocol a good buy?

In my view, I believe that MIR is one of the worst cryptocurrencies to buy. For one, its ecosystem has almost died now that Band Protocol is no longer providing price feeds. In addition, it is tied to Terra Classic and USTC, coins that are no longer valuable. As you recall, Terra USD was the heart of Terra’s ecosystem because it was pegged at $1.

Therefore, the current Mirror Protocol price rally is likely because of a pump and dump that is common in the crypto market.

The post Mirror Protocol price is in a recovery mode. Is MIR a good buy? appeared first on CoinJournal.

Chiliz is up by 3.5% on Thursday: Here is why

Chiliz is one of the best-performing cryptos amongst the top 50 cryptocurrencies in the market today.

CHZ, the native token of the Chiliz network, is one of the top performers amongst the leading 50 cryptocurrencies by market cap. CHZ has added more than 3.5% to its value over the last 24 hours. 

The positive performance comes as the broader crypto market underperforms. The broader crypto market has lost more than 2% of its value over the past few hours. As a result, the total crypto market cap is now around $975 billion.

Bitcoin, the world’s leading cryptocurrency, is down by 1.7% so far today and risks dropping below the $20k psychological level if the trend continues. Ether is down by 3% and is currently trading at $1,551 per coin.

CHZ’s positive rally comes after the Chiliz exchange announced its support for the upcoming Ethereum Merge. 

The team said in the event of a new chain fork/token, they will evaluate whether to support the distribution and withdrawal of the forked tokens if they meet the exchange’s requirements. 

The Chiliz team will announce the timeline for such supported tokens if required in a separate announcement.

Key levels to watch

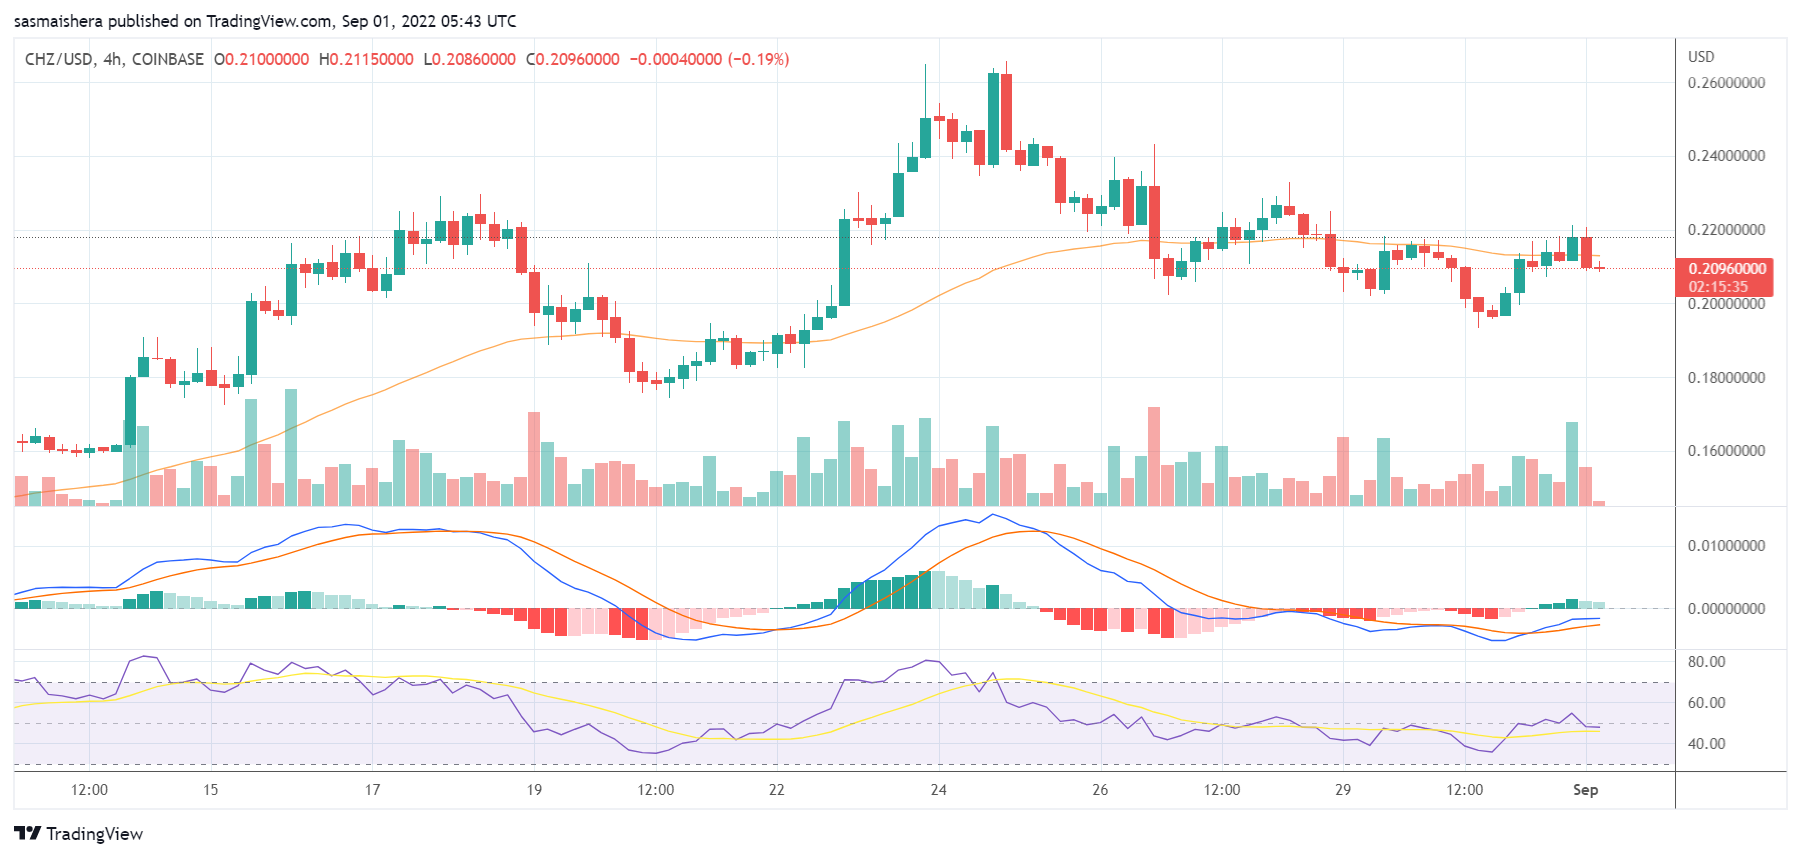
The CHZ/USD 4-hour chart remains bearish despite Chiliz performing positively over the last 24 hours. CHZ has been underperforming in recent days, but its technical chart is now improving.

The MACD line remains below the neutral zone, indicating that the bears are still in control. However, it could enter the positive region if the positive momentum is sustained. 

The 14-day RSI of 49 shows that CHZ is no longer in the oversold territory. At press time, CHZ is trading at $0.2092 per coin. If the rally continues, CHZ could surge past the first major resistance level at $0.2343 today.

However, it would need the support of the broader crypto market to surpass last week’s high of $0.2625.

The broader market remains bearish, and this could affect CHZ’s performance in the near term. CHZ could lose the $0.1954 support level before the end of the day if the bearish sentiment thickens in the broader crypto market. 

The post Chiliz is up by 3.5% on Thursday: Here is why appeared first on CoinJournal.