Bitcoin volatility at three-year low as crypto markets lull


Key Takeaways

  • Crypto volatility has been dropping all year, with Bitcoin’s volatility now at three-year lows
  • Volume is also dropping, as the calm markets are not welcomed by traders
  • Despite downward-trending volatility, crypto remains highly volatile when compared to other asset classes

Crypto markets are known for violent volatility, capable of both spiking and collapsing in the blink of an eye. 

Thus far this year, however, that hasn’t been the case. Volatility has been trickling steadily downward across the space. Assessing the realised volatility of Bitcoin over a rolling one-month window, the metric is currently at a three-year low. 

This comes despite Bitcoin having had a bumper year thus far, the asset currently up 76%, treading water around the $30,000 mark. In the past, Bitcoin has oscillated wildly, but this run-up from the low of $15,500 late last year has been distinguished by a steady climb rather than the turbulent ups and downs we have come to expect. 

The pattern is not unique to the world’s biggest crypto, either – volatility is falling across the board. The easy way to illustrate this is by looking at Ether. Historically, the price of ETH has been more volatile than BTC, but the divergence has narrowed this year, and Ether is now trading with similar volatility to its big brother. 

This relative calm in crypto markets is good on one level, given one of Bitcoin’s most-cited criticisms is its extreme volatility, which most agree it will need to overcome should it ever take the status of a reputable store of value. 

Not everyone is a winner, though. Traders rely on volatility and hence these serene times are not exactly a boon. If we look at spot trading volume, the drawdown has been steep. Granted, there are myriad factors at play here, including regulation, a drawdown in prices, lockdowns ending, scandals (FTX and the SEC lawsuits) and so on, but the lack of volatility is not helping. 

The below chart from The Block shows quite how far spot volume has fallen. 
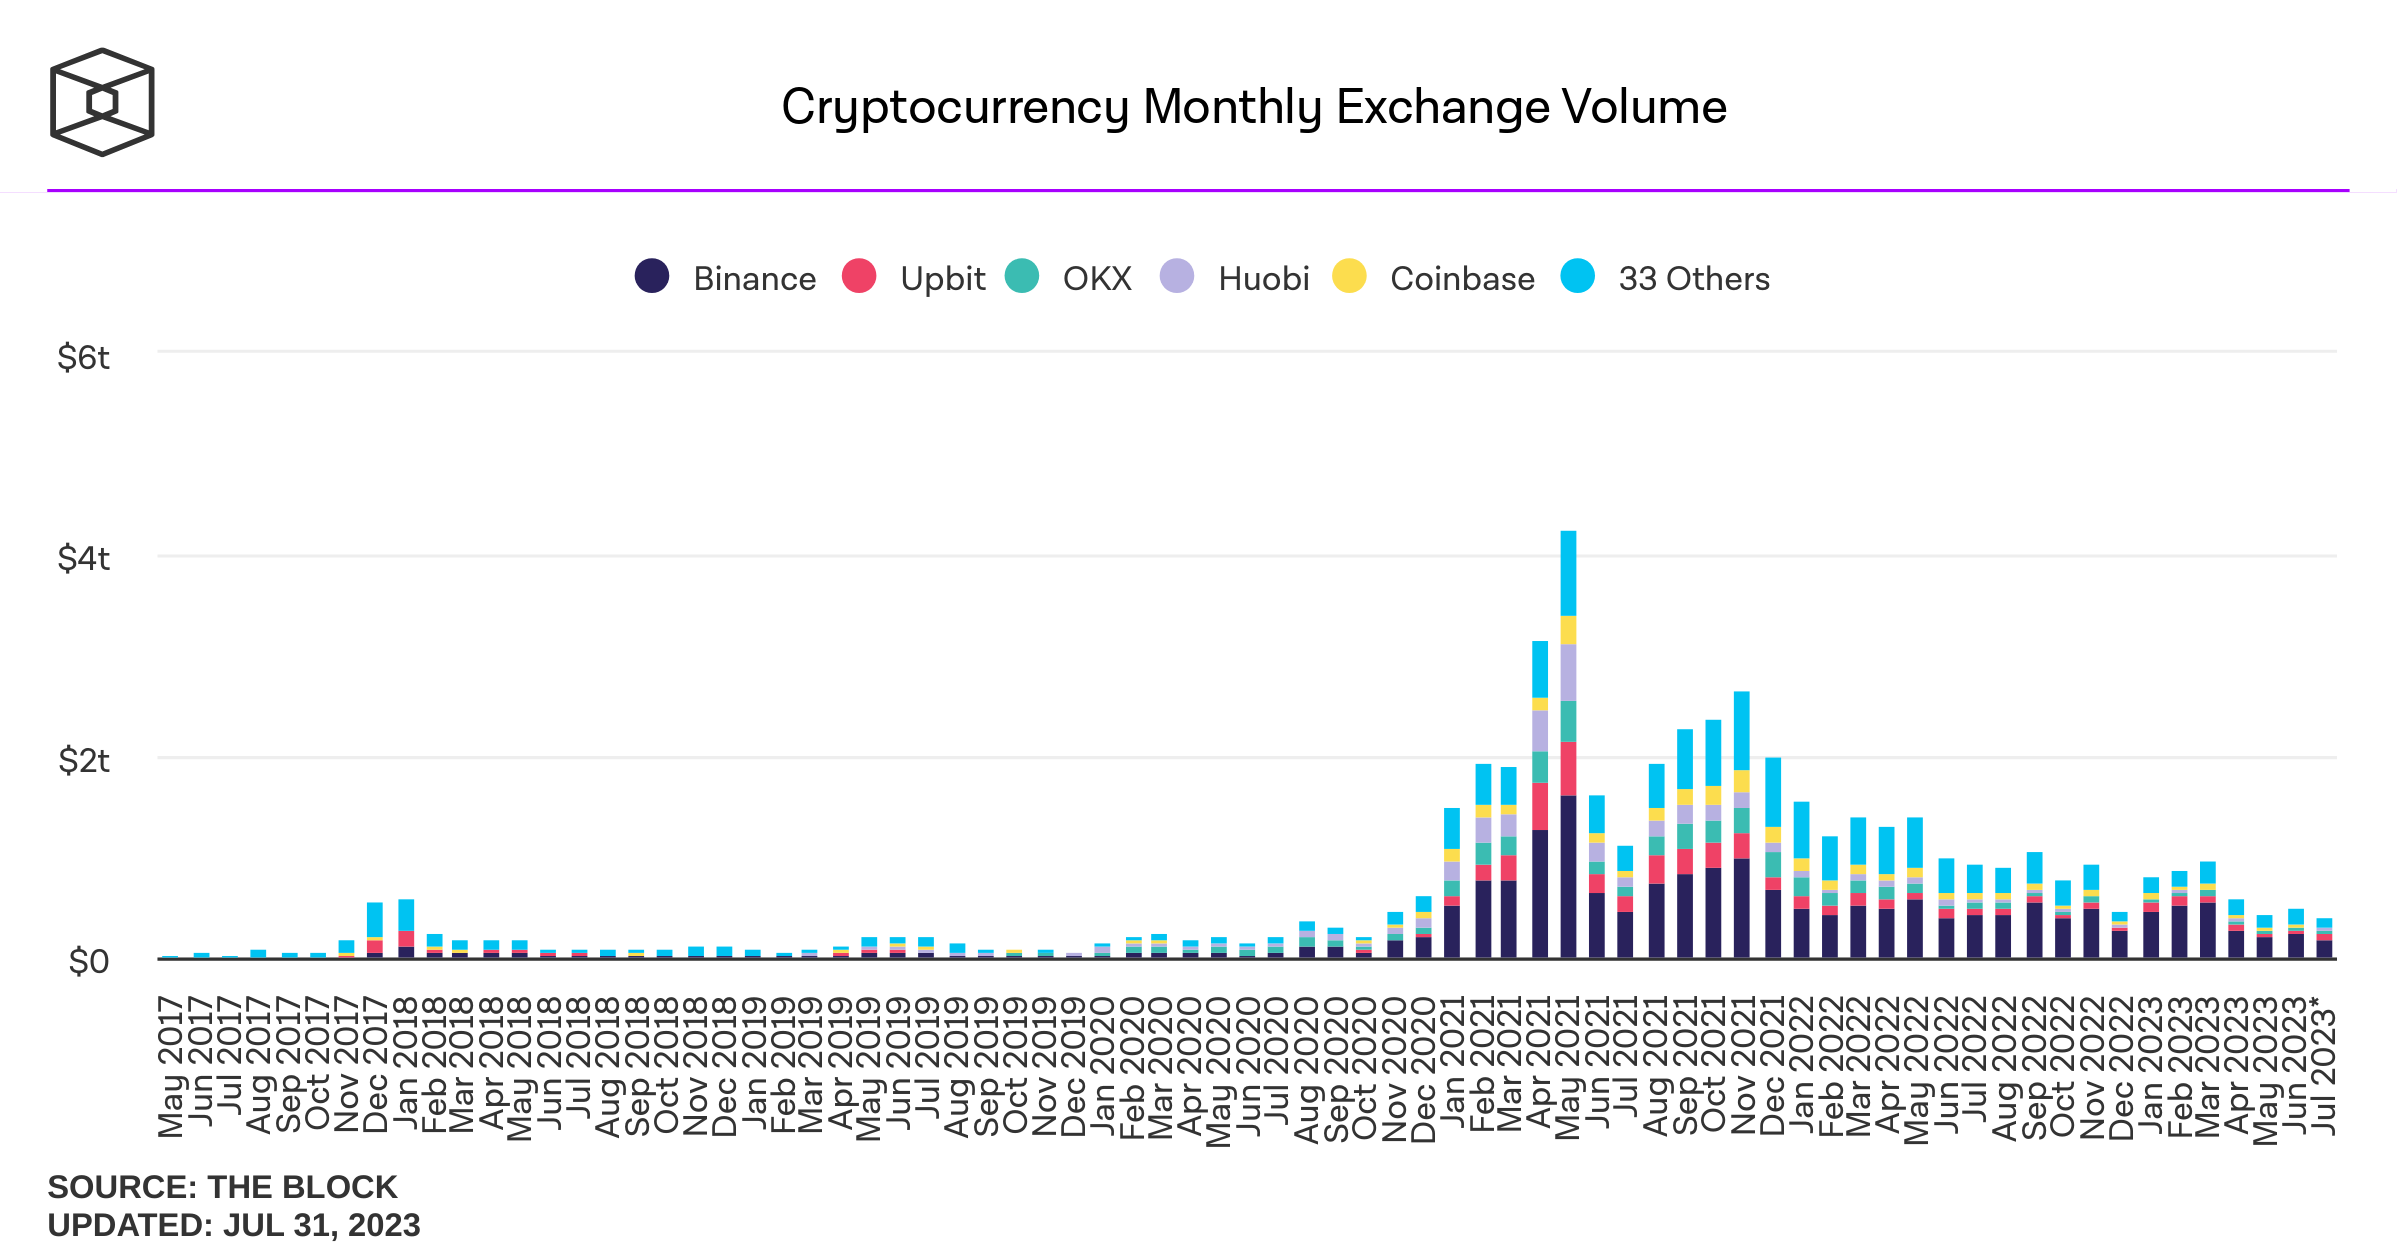
Even derivatives trading volume, which had been more stout, has fallen off since April – likely a better gauge for traders than assessing spot volume. Liquidity is not as much of a concern in derivatives markets as it has become in spot markets, but the last few months have begun to see some thinning out there, too. 

While the falling volatility is notable, it should be noted that crypto remains a league above trad-fi markets with regard to this metric. Even this three-year low still translates to an annualised volatility of 25% for Bitcoin, which would not be deemed low-risk by any stretch of the imagination. 

To put this up in lights, comparing Bitcoin to gold is always illustrative. Gold is the store of value which has been around for thousands of years, the shiny metal known for its inflation-hedging abilities and lack of correlation to risk assets. For many, Bitcoin’s vision is to claim the title of some sort of digital gold. 

The below chart displays the current gulf between these assets – even after the dampening down in crypto volatility this year, it’s on a completely different planet to gold. 

Alternatively, one can simply compare the daily returns of the assets, which conveys the same thing. 

Thus, while crypto volatility is currently sluggish, it has a long way to go before it matches gold. More importantly, there is no guarantee that this volatility will stay low. Quite the opposite – given the low liquidity in the space, less capital is needed to move crypto markets than has been the case previously. 

In light of this, it feels like the downward trend in volatility (exacerbated in the last couple of months by a classic summer lull in trading) should return. Not to mention the fact that with the interest rate hiking cycle coming to a close, markets could be at an inflection point. It is always hard to predict the future in crypto, but it feels unlikely that digital assets’ volatility will stay at these uncharacteristically low levels for long. 

The post Bitcoin volatility at three-year low as crypto markets lull appeared first on CoinJournal.
BNB/USD vulnerable as a bearish flag formation points to a move below $200

  • BNB/USD forms a possible bearish flag pattern
  • The US dollar strength is not responsible for the BNB/USD bearishness
  • $200 provides support for now

Bitcoin rallied in 2023 and holds onto its gains. Most other major cryptocurrencies did so too, but some exceptions exist. 

One is Binance Coin (BNB). 

Sure enough, it rallied at the start of the year, following Bitcoin’s lead. But then it gave up all of its gains – and some more. 

One cannot blame the US dollar’s strength as the cause for the BNB/USD decline. After all, the dollar’s strength is not visible in other cryptocurrencies. 

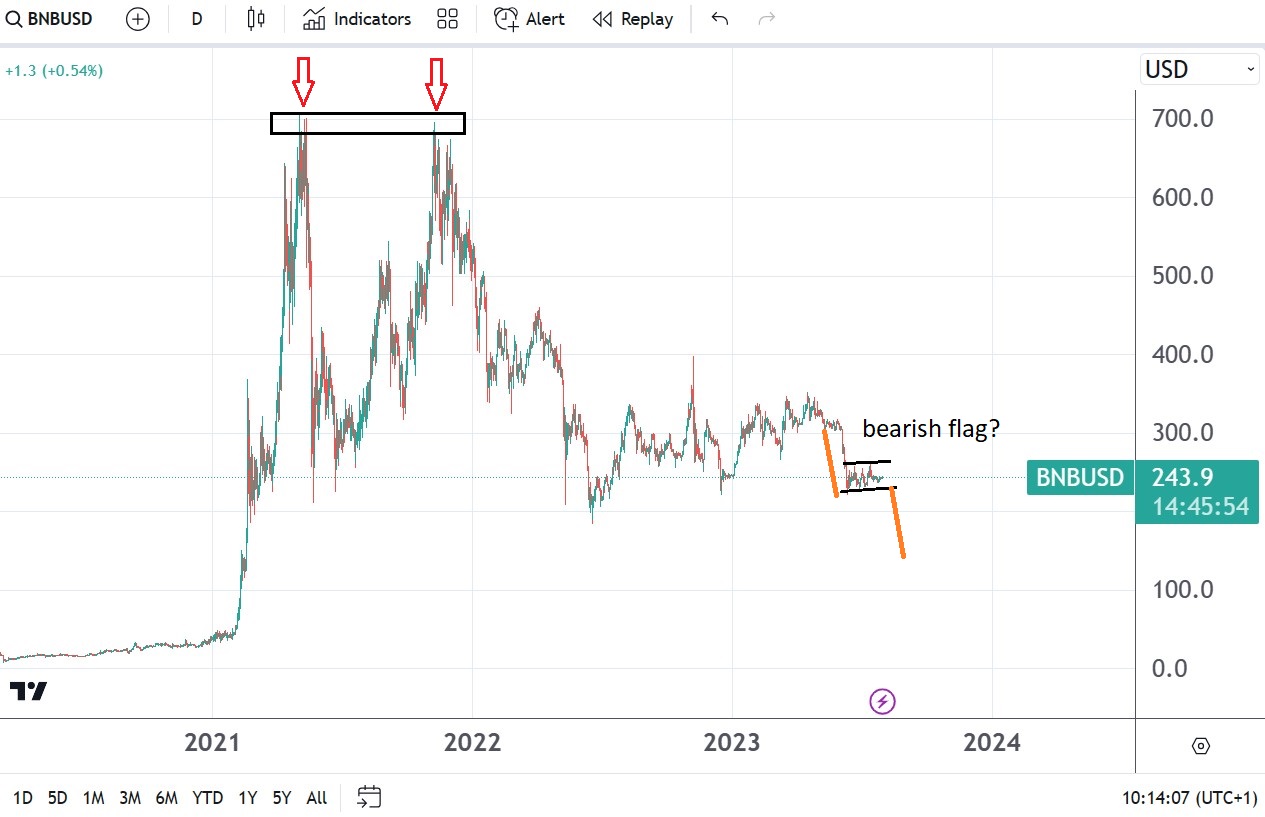
Instead, it appears to be the Binance Coin that trades with a bearish tone. That is particularly true if one looks at the technical picture, which shows the bearish pressure building as the market nears the $200 support level. 

Binance Coin chart by TradingView

A bearish flag pattern suggests that BNB/USD will break the $200 support level

A bearish flag pattern is a continuation pattern forming in a downtrend. The consolidation area follows a steep decline, and the breakout or the measured move equals the distance that the market traveled prior to the consolidation. 

If, indeed, BNB/USD formed a bearish flag pattern, then the support in the $200 area should give way. The pattern’s measured move, seen in orange above, points to $150 and lower. 

What should worry investors is the inability of the market to bounce while other cryptocurrencies hold near their yearly highs. It points to other factors weighing on the market, different than the US dollar’s strength. 

The post BNB/USD vulnerable as a bearish flag formation points to a move below $200 appeared first on CoinJournal.

ETH/USD price forecast as July comes to an end

  • Ethereum is consolidating around the yearly highs
  • $2,000 proves to be stiff resistance
  • ETH/USD price action holds between a $1,000 range since May 2022

There is only one trading day left in July, and the cryptocurrency market is consolidating. That is particularly true of major cryptocurrencies such as Bitcoin or Ethereum, as they both hover around their yearly highs against the US dollar. 

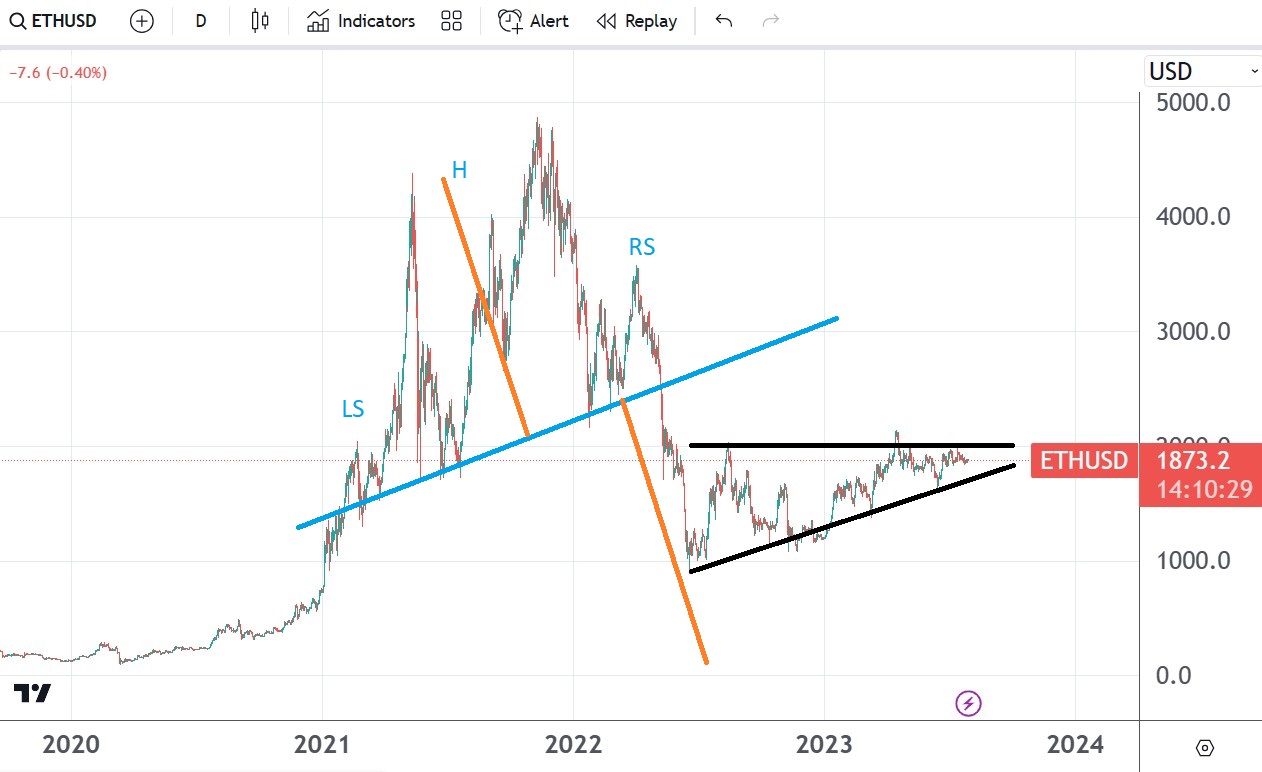
Ethereum found strong resistance at the $2,000 area in 2023, just as it found strong support at $1,000 last year. The question now is whether resistance holds and the price will be sent back to $1,000? Or will bulls manage to push over resistance, and the rally will continue in the last months of the year? 

ETH/USD remains bullish while the price holds above $1,000

The rally in the cryptocurrency market seen in 2023 triggered enthusiasm among cryptocurrency investors. However, without more follow-through, the bullish sentiment will dissipate soon. 

Ethereum chart by TradingView

A quick look at the chart above reveals a $1,000 range since May 2022. More precisely, the market moved between $1,000 and $2,000, clearly with an upside bias but failing to make a meaningful break higher. 

Since touching the $1,000 support level in 2022, ETH/USD started a series of higher highs and higher lows, typical in bullish formations. Because the higher lows formed against horizontal resistance, it looks like the market builds energy to break higher. However, the bullish bias should hold only if the price does not break the higher lows series. 

If it does, the focus suddenly turns to the $1,000. A clear break there brings back the previous head and shoulders pattern with a measured move much lower than $1,000. 

The post ETH/USD price forecast as July comes to an end appeared first on CoinJournal.

3 economic events to move the cryptocurrency market next week

  • Key US economic data is due this week
  • An increase in the US dollar’s volatility should move the cryptocurrency market too
  • The NFP report is the highlight of the week

The final week of July is ahead of us, and cryptocurrency traders might want to consider what happens with the US dollar. After all, Bitcoin’s consolidation around $30k in the past few weeks brought little or no activity in the market. 

Therefore, should the US dollar’s volatility rise in the week ahead, Bitcoin’s volatility may rise too. Consequently, the entire cryptocurrency market will be more active if Bitcoin’s volatility rises. 

So here are three events that might move the US dollar consider next week: 

  • ISM Manufacturing and Services PMI 
  • ADP Employment Change 
  • Non-Farm Payrolls

ISM Manufacturing and Services PMI

The PMI data is calculated monthly and interpreted in relation to the 50 level. A print bigger than 50 shows an expanding sector, while one above 50 shows an expanding sector. 

The United States is a service-based economy, so the services sector tends to have more weight for the US dollar. However, this week, the focus will be on the manufacturing data because it is forecast to come out below the 50 level. Any positive surprises should see the US dollar bouncing higher. 

ADP Employment Change

July’s ADP Employment Change or the private payroll numbers will be released on Wednesday. Market participants look at the private payrolls in anticipation of the all-important Non-Farm Payrolls report due two days later. 

This week, the market expects the US economy to have added 195k new jobs in July. Details matter because the ADP and NFP numbers often reflect the same thing. 

Non-Farm Payrolls

Because next Friday is the first Friday of the new month, the NFP report for the month of July is due. The market expects the US economy to have added 200k new jobs in July and the unemployment rate remained steady at 3.6%.

The post 3 economic events to move the cryptocurrency market next week appeared first on CoinJournal.

ADA/USD price forecast following the Fed’s July interest rate decision

  • Fed’s July decision did not impact the cryptocurrency market
  • Despite rallying in 2023, ADA/USD dipped below the 2022 lows
  • A double bottom pattern might be in place, and a move above $0.55 would confirm the reversal pattern

Three central banks announced their interest rate decisions this week, and the Federal Reserve was one of them. For those trading cryptocurrencies denominated in US dollars, the Fed’s decision marked one of the most important events of the summer. 

Following the decision to “skip” a rate hike in June, the Fed signaled that it would hike the rates in July, despite the clear improvements in the fight against inflation. Accordingly, the market priced in a rate hike, and the Fed delivered. 

As such, all the attention was on what the Fed will signal moving forward – more tightening or the fact that it had reached the terminal rate? Every detail was important for the US dollar as its volatility directly impacts cryptocurrency traders. 

As it turned out, the Fed did hike the funds rate by another 25 basis points and did not signal that the current cycle ended. Therefore, the outcome of the Fed’s meeting might be viewed as hawkish for the US dollar, and so, it is no wonder that the cryptocurrency market continued its consolidation and experienced less volatility following the Fed meeting than the traditional currency market. 

Cardano chart by TradingView

ADA/USD unable to break above horizontal resistance

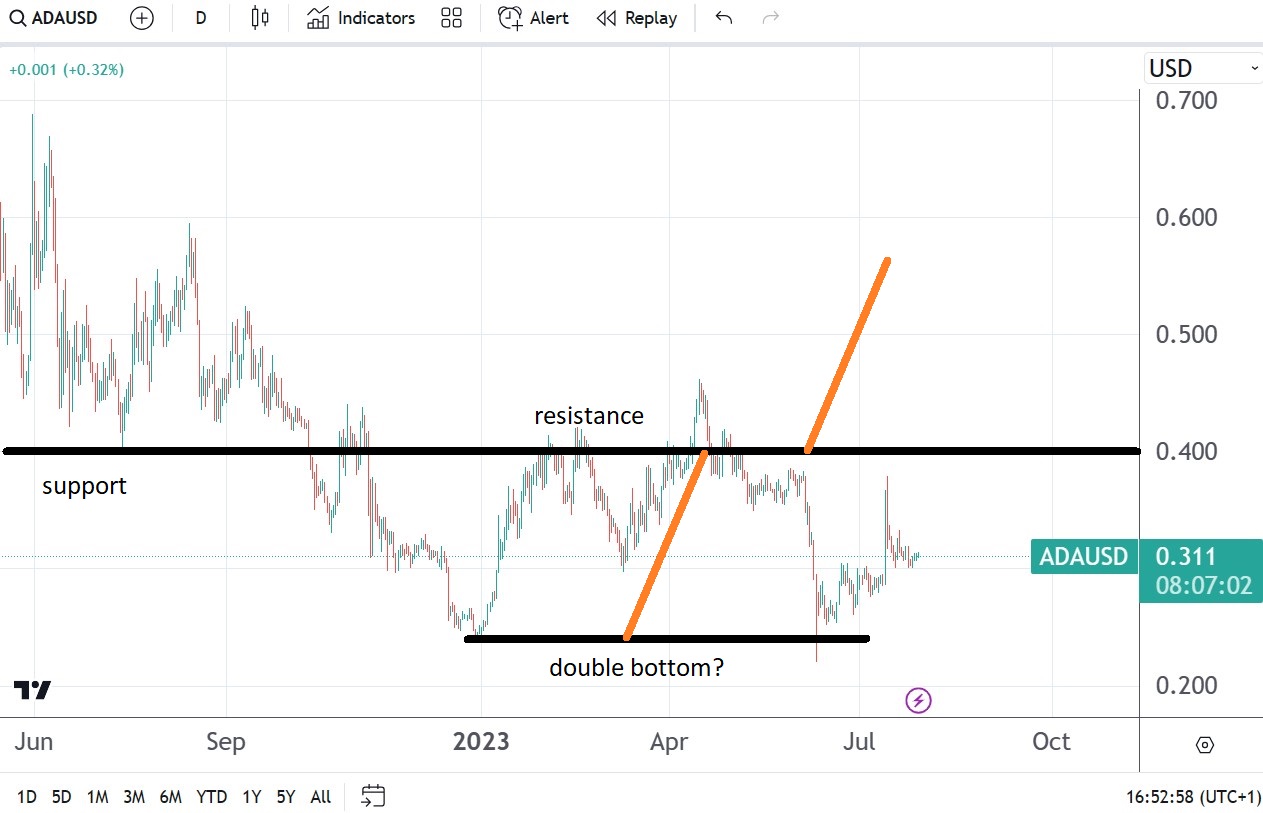
Cardano (ADA) rallied in 2023 as Bitcoin and other major cryptocurrencies bounced from their 2022 lows. In doing so, the market met little or no resistance until the $0.4 area. This is an area where ADA/USD found support in the past, and now support turned into resistance.

For several months now, ADA/USD was not able to break and hold above resistance – every time sellers emerged. So heavy was the selling pressure that the market even dropped below the 2022 lows. 

Naturally, this week’s Fed decision was important because it might be that ADA/USD formed a double bottom with the last attempt to the lows. While the Fed’s decision did not trigger a lower dollar, the bias remains somehow bullish for ADA/USD because of the possible double bottom. 

Therefore, if ADA/USD climbs above $0.4, more buyers might step in to trade the pattern’s measured move, seen in orange above. It points to $0.55, and on such a market move, the bearish bias might finally be left behind. 

The post ADA/USD price forecast following the Fed’s July interest rate decision appeared first on CoinJournal.