Shiba Inu breaks out from an ascending triangle as price pumps

  • Shiba broke past a key resistance over the weekend

  • Several developments are helping Shiba Inu 

  • SHIB is gearing to go higher, but before then, a correction could occur

Shiba Inu SHIB/USD was a top trending cryptocurrency on Monday. Momentum has been building for the cryptocurrency signaling increased buyer interest. The Monday jump takes SHIB above a key resistance as more investors circle. 

Several developments could explain the breakout in SHIB. One is the expected Shibarium TestNet. Previously, developers said that the anticipated Shibarum Public Beta testNet was set for launch in Q3 2022. The quarter ends in September. However, the community remained optimistic that the Testnet upgrade was set to launch between August 15 and 21. 

Another development that sparked interest in SHIB is the upcoming online game. Also known as Shiba Eternity, the game promises to help Shiba Inu shed its meme tag. To some other extent, Shiba Inu is also believed to be fueled by gains in Ethereum. Shiba Inu is Ethereum-based, and the anticipated shift to Proof-of-Stake may boost the token. The move is expected sometime in September. SHIB investors could be reading between the lines ahead of the upgrade.

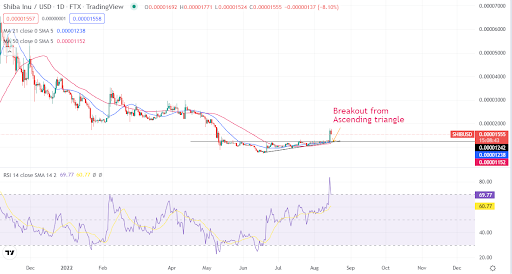
SHIB breaks out and rises above an ascending triangle 
Source – TradingView

From the daily chart, Shiba Inu token broke above the resistance at $0.000012. The resistance and the trendline formed an ascending triangle. The token is currently retreating from an overbought region.

The breakout sets SHIB up to the next resistance at $0.00002. However, SHIB could slide to retest the support at $0.000012. Investors should take advantage of the retracement.

Summary

Shiba Inu broke from an ascending triangle as investors bought the token. A range of positive developments boosted the meme token. SHIB is retracing, but the upside remains in place. The next resistance is $0.00002.

The post Shiba Inu breaks out from an ascending triangle as price pumps appeared first on CoinJournal.


Zipmex gets a three months moratorium extension to resolve liquidity issues

The Singapore High Court has given Zimplex crypto exchange a three months moratorium extension to resolve its liquidity issues.

Zimplex, a leading South Asian crypto exchange, has been going through tough times that resulted in an abrupt halting of client withdrawals last month before allowing limited withdrawals a week later. The exchange later filed for bankruptcy protection in Singapore seeking protection from creditors.

In its petition, Zipmex Group was requesting a six-month moratorium extension for its five entities: Zipmex Asia, Zipmex, Zipmex Thailand, Zipmex Australia, and Zipmex Indonesia to avoid any potential creditor lawsuits. However, the court has granted it just over three months to address its liquidity issues. The extension was extended to December 2.

Zimplex joins Vauld, which like Zimplex had halted withdrawals in July and received a three months moratorium extension earlier this month from the Singapore High Court.

Zimplex’s liquidity crisis

Zimplex liquidity crisis was triggered by its exposure to Celcius and Babel Finance, two crypto lenders that have been on the verge of insolvency. Both Celsius and Babel Finance have halted withdrawals to date.

Zimplex is currently working on resolving its financial crisis in the hope of re-enabling fund transfers between its Trade and Z wallets soon. In particular, Zimplex is presently seeking to raise funds and it recently said it signed a memorandum of understanding with two investors.

The Z wallet from which clients are currently not allowed to withdraw assets allows users to use the ZipUp+ feature to deposit crypto holdings and earn rewards. It also allows users to deposit and withdraw fiat currency and trade and store cryptocurrencies.

The post Zipmex gets a three months moratorium extension to resolve liquidity issues appeared first on CoinJournal.

Bitcoin could top the $25k resistance level in the coming days

The cryptocurrency market is having a poor start to the week but could recover and rally higher over the next few days.

The cryptocurrency market is currently trading in the red zone, starting this week in a poor fashion. 

The total market cap still stands above $1.1 trillion despite the broader cryptocurrency market losing more than 2% of its value.

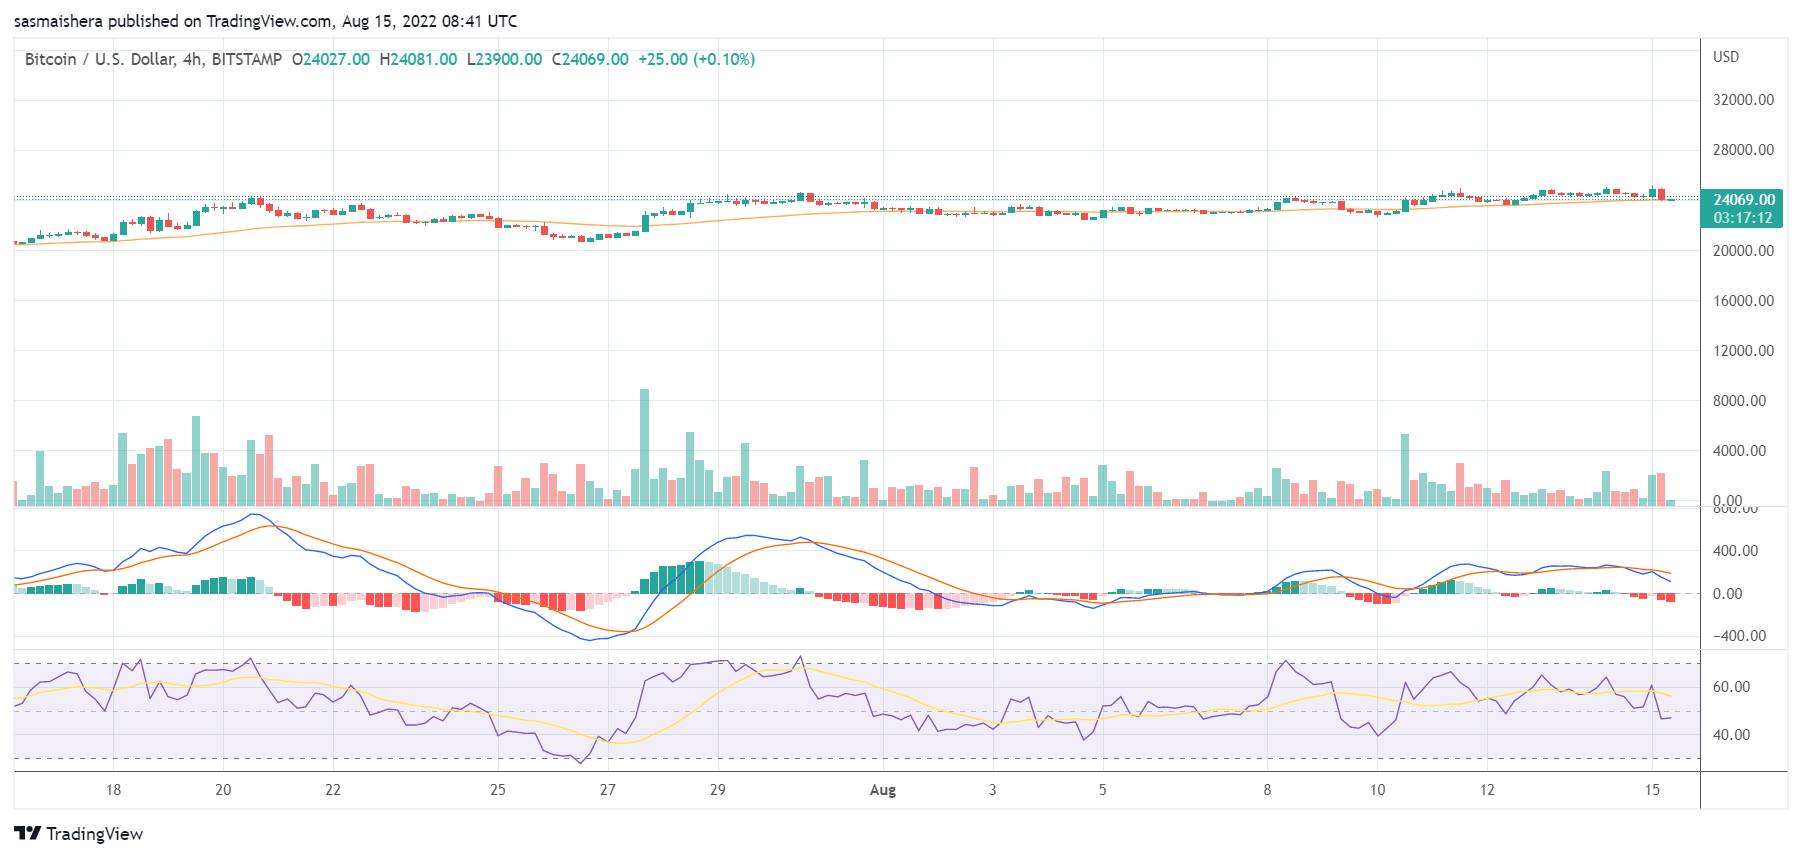
Bitcoin is struggling to defend its position above the $24k support level after losing more than 3% in the last 24 hours. Despite the poor performance, BTC could surge past the $25k resistance level over the next few days.

Bitcoin remains the world’s leading cryptocurrency and has maintained its price above the $20k psychological level in recent weeks. BTC has suffered to move past the $25k resistance level but could attempt to do so over the next few days.

Moving past the $25k resistance level could allow BTC to target the $30k psychological level in the near term.

Key levels to watch

The BTC/USD 4-hour chart remains bullish despite Bitcoin underperforming over the last 24 hours. The technical indicators show that BTC could bounce back from its ongoing slump.

The MACD line remains above the neutral zone, indicating bullish momentum for Bitcoin. The 14-day relative strength index of 48 shows that Bitcoin is still not in the oversold region despite its poor performance.

At press time, BTC is trading at $24,060 per coin. If the bearish trend continues, BTC could drop below the $23,539 support level over the next few hours or days. However, BTC should maintain its position above the $22,900 support level in the near term.

The bulls might regain control of the market and push BTC past the $24,879 resistance level before the end of the day. BTC could comfortably stay above the $25k psychological level in the short term as the general outlook of the market remains bullish.

The post Bitcoin could top the $25k resistance level in the coming days appeared first on CoinJournal.

Should you buy LTC as it consolidates at key resistance?

  • Litecoin is currently trading at $60.94, a 1.76% dip in the past day

  • The pair is in a consolidation amid bullish indicators

  • Investors should wait for it to clear above the level

Cryptocurrencies are currently on a retracement following an industry-wide recovery. Bitcoin and Ethereum are down 3.8% and 1.92% in the past day. Litecoin’s LTC/USD dipped 1.76% in the same period.

Created in 2011, Litecoin is one of the earliest blockchains. It was forked from bitcoin as an improvement of the proof-of-work network. The platform is more scalable with a faster block time and a larger token supply. It also uses the Scrypt hashing algorithm to reduce energy consumption.

Despite being a hard fork of Bitcoin, LTC has failed to stage a recovery similar to that of the latter. LTC has gained a paltry 4% in the past month compared to 25% in BTC. This takes into consideration the wide market cap difference between the two. While bitcoin has a valuation of $454 billion, LTC is at a fraction of that with $4.3 billion.

Currently, LTC/USD is changing hands for $60.94. Its trading volume is down 17.39% at $437,281,262. Aside from the dynamics in price and volumes, LTC has important technical levels to watch.

LTC consolidates at the $61 resistance level

Source: TradingView

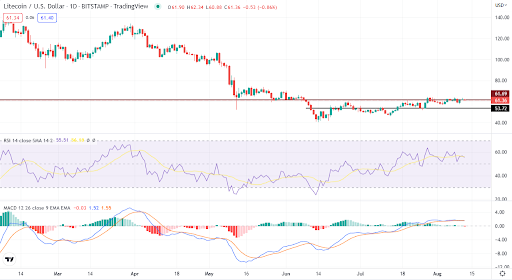
According to the daily chart above, LTC is consolidating around $61 resistance. The token’s attempts to break above the level have been resisted three times since June 25. Nonetheless, the chart shows that the technical indicators favor the bulls, and the token could break above. 

The RSI is currently at 55. Although the momentum indicator can be interpreted as neutral, more traders are buying the token than selling it. The MACD is above the signal lines with the histograms on the green. However, investors should exercise patience until the token clears above the resistance.

Bottom line

Litecoin has strong fundamentals around efficiency and faster transaction speeds. Its native LTC token is consolidating at an important resistance level amid strong bullish momentum. Patience is recommended until the tokens clear the level.

The post Should you buy LTC as it consolidates at key resistance? appeared first on CoinJournal.

Hedera Hashgraph prediction as price reclaims the $0.074 level

Hedera HBAR Coin Logo

  • Hedera Hashgraph is a smart contract platform that uses an algorithm for fast transactions

  • HBAR has reclaimed the $0.074 level after 10% gains in the week

  • HBAR could consolidate, but $0.074 remains the reference support

Hedera Hashgraph HBAR/USD has surged by more than 10% in the past 7 days. The gains have propelled the token to higher levels, reclaiming a major resistance. If trading HBAR, it is important to watch key levels where the price may face indecision.

Hedera Hashgraph is a blockchain that promises to deliver secure and fast transactions. The blockchain aims to achieve the objective through a distributed consensus algorithm. Hedera also seeks to enable anyone to deploy applications on the platform for true decentralization.

Hedera Hashgraph may not be the strongest cryptocurrency this year. Since bottoming at $0.06 in mid-July, it has been making very slow gains. That is despite most other cryptocurrencies staging strong recoveries. Nonetheless, recent recoveries may be a tip of what is about to come for the token.

Hedera Hashgraph begins recovery, but momentum is weak

Source – TradingView

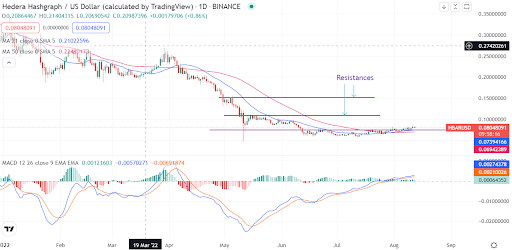
From the daily chart outlook, the 21-day and 50-day moving averages have joined a support for HBAR. The 21-day MA has closed above the 50-day MA as bullish momentum builds. The MACD indicator also points to building momentum. The price is well supported above $0.074, suggesting that HBAR has set new reference support. The token is moving along an uptrend.

Concluding thoughts

If considering buying HBAR, the $0.074 should be the reference level. Nonetheless, with the weak momentum, the token could continue to consolidate. Consequently, HBAR is not the best token for short-term buyers. Dip and long-term buying are recommended.

If HBAR keeps $0.074 intact, the next levels to watch are $0.10 and $0.15. The cryptocurrency could also face some resistance at $0.09.

The post Hedera Hashgraph prediction as price reclaims the $0.074 level appeared first on CoinJournal.