BTC and ETH hold onto support as VC exec maintains bullish prediction

  • Chris Burniske says Ethereum could outperform Bitcoin in March due to the Shanghai upgrade.
  • Burniske is a partner at crypto-focused VC Placeholder and formerly of ARK Invest (crypto division).
  • According to the investor, pullbacks are likely to remain “within current uptrend.”

Chris Burniske, partner at venture capital firm Placeholder and former head of crypto ARK Invest, is bullish on crypto going into March.

The investor believes the recent flip in sentiment has not resulted in deeper rot for major cryptocurrencies, despite the weakness seen across stocks amid investor anxiety over interest rates.

In a tweet posted this weekend, Burniske said the outlook is mostly bullish as recent pullbacks have been largely mild.

“From where I sit, I’m surprised crypto hasn’t pulled back more given weakness in equities and upward repricing in rates — bullish,” he noted.

Ex-ARK Invest head of crypto shares Ethereum and Bitcoin price predictions

Bitcoin and Ethereum have both retreated from year-to-date highs, from above $25k and $1.7k respectively. 

As noted above, the leading digital assets by market capitalization have given up the recent gains amid continued jitters over US inflation data. Buy-side volume has also tanked on shifting sentiment around the regulatory environment in the United States returned sell-off pressure across the markets.  

But while Bitcoin has retraced to support around $23,000 and Ethereum continues to hover around $1,600, the crypto bull says any further losses in the short term are likely to be “within the current uptrend.”

“To those saying some version of “just wait,” sure we could pull back a bit more, but calls for new lows anytime soon are silly. Pullbacks are consolidation within the current uptrend, imo,” the investor added.

In terms of price prediction for the top two coins, Burniske thinks Ethereum will outperform Bitcoin in March. According to him, ETH is likely to gain fresh momentum from the highly anticipated Shanghai upgrade, which is expected to drive staking flows. 

The outlook is supported by on-chain data, which shows new value sent to the ETH 2.0 deposit contract continues to rise. 

Crypto analytics firm Santiment recently shared a chart showing that the number of newly staked coins rose a 5-month high count earlier this week.

The post BTC and ETH hold onto support as VC exec maintains bullish prediction appeared first on CoinJournal.
Litecoin price analysis: Can LTC ride the Metalpha partnership to break $100?

  • Litecoin price was hovering around $93.90 early Sunday, up 2% in 24 hours.
  • The Litecoin Foundation recently announced a major partnership with Metalpha Technology Holdings.
  • LTC price is just above the 50D EMA, and must hold above here if bulls have to take charge.

Litecoin price rose above $94 on Sunday as the cryptocurrency picked up some gains following the dump to lows of $91 on Friday.

While the gains are modest and LTC is still over 5% in the red on the weekly chart, the positive trend in the past 24 hours highlights the potential for bulls to successfully retest the key resistance zone above $96.

LTC price prediction after Litecoin Foundation and Metalpha partnership

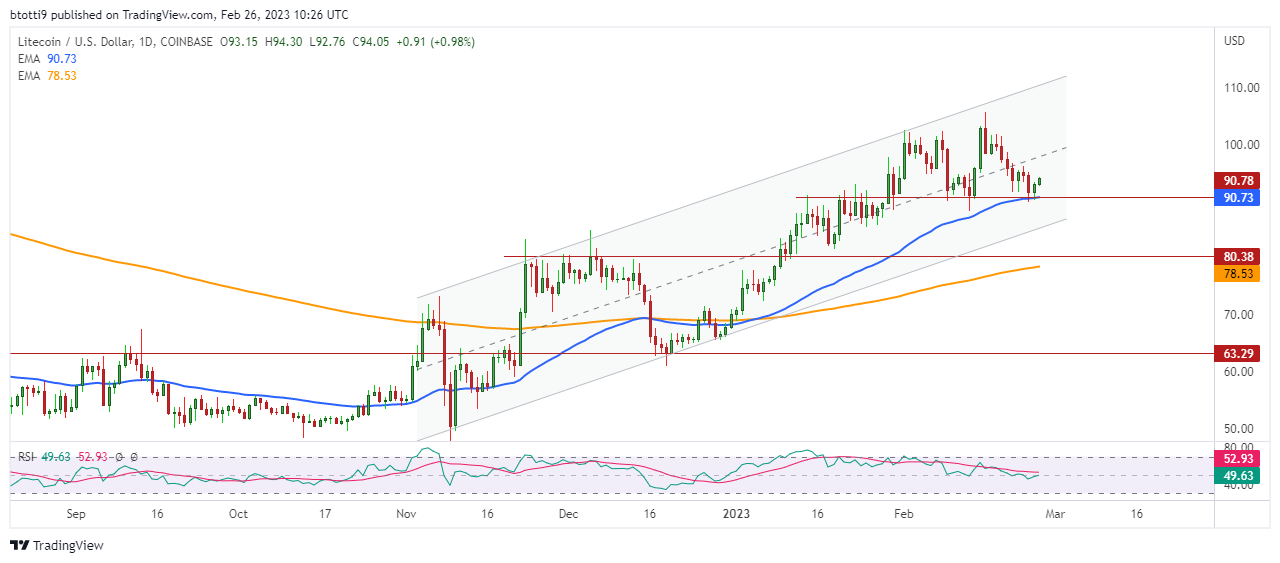
To strengthen the short-term bullish outlook, bulls need to retest and break resistance at the middle line of the ascending channel (daily chart). That means moving to the price range between $97 and $100. The channel’s upper trendline offers resistance around $110. 

As predicted last week, LTC price could see a 40% jump if it breaks the $100-110 confluent zone, with potential gains to above $130.

Helping this positive short-term outlook could be the resilience in the broader crypto market as Bitcoin attempts to hold major support above $23k, with a retest of $25k possible.

More than that, it could be the bullish outlook from the likely institutional pull of Litecoin, particularly following this week’s partnership with Nasdaq-listed wealth manager Metalpha Technology  Holding Ltd (NASDAQ: MATH.)

The partnership could prove pivotal for Litecoin miners as well promote the adoption of LTC as a global payment network. This is because Litecoin will collaborate with the crypto-focused firm to promote sustainable mining and offer hedging solutions for miners. The plan is to lower carbon emissions amid a push for renewable energy.

Metalpha will also help bring financial derivative products to the Litecoin network, the Litecoin Foundation said in a press announcement.

Litecoin chart showing key price points. Source: TradingView

The bullish perspective might however be undone if LTC/USD moves lower and break support at $90.

As seen in the daily chart above, the 50-day exponential moving average (EMA) currently provides an immediate buffer zone.

If price penetrates this level on the downside, LTC could drop to the $80.38 line, below which the 200-day EMA is at $78.52. December 2022 lows around $63 is another key level that bears might be eyeing.

The post Litecoin price analysis: Can LTC ride the Metalpha partnership to break $100? appeared first on CoinJournal.

Polkadot price prediction: DOT ahead of ETHDenver 2023

  • Polkadot joins the ETHDenver BUIDLing event on 28 February.
  • DOT price is down on Friday as broader markets fall following US PCE data.
  • The technical outlook for DOT price suggests bulls need to hold above $6.35 or bears could take control.

Polkadot will next week be one of the highlight projects at the ETHDenver 2023 summit.

While the Web3 BUIDLathon event will see the largest gathering of enthusiasts, developers and engineers in the broader Ethereum ecosystem, blockchain enthusiasts will no doubt be keen on the sharded blockchain protocol that’s Polkadot.

Polkadot’s announcement today confirmed the ecosystem will join the ETHDenver 2023 BUIDLing summit starting on 28 February. Apart from panel talks and a conference program, there will be community side events and interactive activities.

The event will run through March 5 and could be key to the DOT price action.

Polkadot price analysis

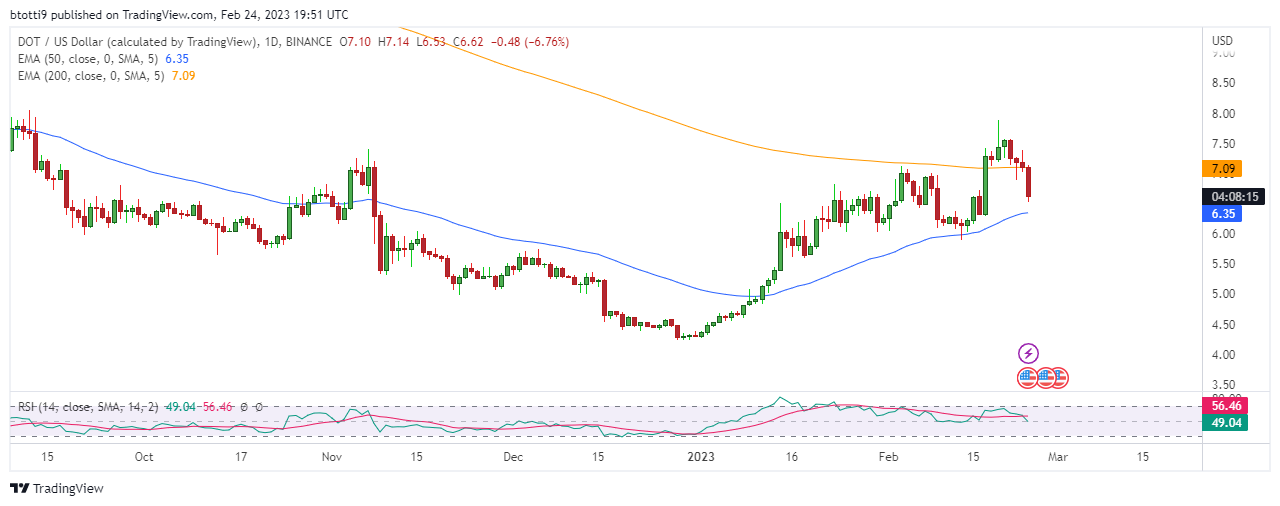
DOT is trading around $6.64, down about 6% in the past 24 hours and only 4% up in the past week. The token has formed a downtrend line since the flip negative that began on 19 February when the DOT/USD pair hit a 30-day high around $7.74.

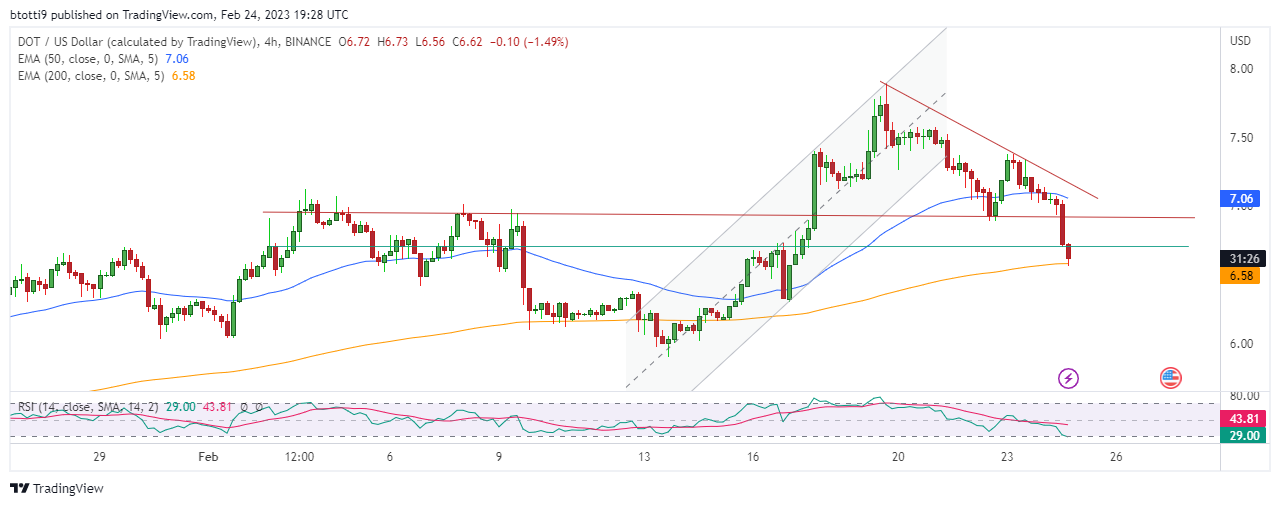
The technical breakdown from the resistance line of the ascending channel has DOT currently at risk of free-falling, with the demand zone at $6.90 and then $6.71 gone on the 4-hour chart. If bulls fail to hold the area around $6.35, the price could plummet to the main support line at $6.00.

Polkadot price analysis 4-hour chart. Source: TradingView

Price is also below the 50 day Exponential Moving Averages (EMA), which is now the immediate resistance line. DOT is also just off the 200-day EMA as seen in the 4-hour chart. 

A breakdown beyond this line could confirm a bearish flip as suggested by the sloping Relative Strength Index (RSI).

Polkadot price chart. Source: TradingView

DOT is also in oversold territory on the daily chart, with the 50 EMA currently providing the main support line around $6.35. However, a bounce off the lower trendline of the ascending channel suggests bulls still have a chance of pushing DOT higher.

Whether this happens during the ETHDenver summit or later may nonetheless depend on the overall market outlook, particularly what Bitcoin price does over the next few days.

The post Polkadot price prediction: DOT ahead of ETHDenver 2023 appeared first on CoinJournal.

Bitcoin bounces off $23k support as stocks fall on hot PCE data

  • Bitcoin and crypto prices fell as markets reacted to January PCE data.
  • The Fed’s favourite inflation measure came in hot, jolting markets lower with S&P 500 declining nearly 1.4% and Dow dropping about 400 points.
  • Crypto analyst Rekt Capital says BTC price remains in positive territory as long as bulls hold support above $23k.

Bitcoin price continues to struggle after the rejection from the $25k resistance, but today’s dip comes as the market reacts to hotter-than-expected Personal Consumer Expenditure (PCE) data.

As stocks got whacked on Friday, with the S&P 500 falling nearly 1.5% and the Dow Jones Industrial Average dropping 400 points, BTC price retreated under $24k to hit lows of $23,130 across major exchanges.

Crypto, Wall Street drops on CPE data

The CPE is the Federal Reserve’s most preferred inflation measure and sentiment has shifted on the latest data release as investor jitters fill up again. 

The Fed uses the CPE price index to assess how sharply prices have risen within the US economy, and data shows prices spiked 0.6% in January and 5.4% year-over-year. Core CPE also came in hot, at 4.7% against the forecast 4.3% to suggest inflation remains an issue.

“Inflation remains too high. We’re going to have to do more to get back to 2%,” said Cleveland Federal Reserve President Loretta Mester. “I see a little more impetus in the inflation measures than my colleagues. We’re going to have to bring interest rates above 5% and hold there for a time,” she added during an interview with CNBC.

Bitcoin price outlook

The reaction on Wall Street also cascaded into the crypto market, with BTC price declining below a key support line recently highlighted as a “confluent support zone.” The uncertainty around the Fed’s interest rates saw most stocks scorched in early trades, a scenario also replicated in crypto with Ethereum dropping below $1,600.

For Bitcoin’s short-term price outlook, popular crypto trader and analyst Rekt Capital says bulls could remain in control if BTC holds above $23k. However, a bearish outlook would materialize if price breaks lower.

“BTC Weekly retest of the confluent area that is the Lower High and Monthly Range High resistance is now in progress. Price needs to hold here for the retest to be successful. However, Weekly Close below this area would be a bearish sign,” the analyst noted.

The post Bitcoin bounces off $23k support as stocks fall on hot PCE data appeared first on CoinJournal.

Bitcoin supply on exchanges lowest since 2017 bull market peak, but why? On-chain report


Key Takeaways

  • 11.8% of the Bitcoin supply is currently on exchanges, the lowest mark since 2017
  • Supply of Bitcoin on exchanges has been consistently falling since March 2020, when crypto bottomed ahead of the explosive pandemic bull run
  • Originally, people pulled Bitcoin to participate in vibrant crypto ecosystem, with high volumes and activity and much scope for yield
  • Today, volumes and interest have fallen, but pattern of Bitcoin fleeing exchanges has continued, albeit for different reasons
  • Bitcoins leaving exchanges in recent months are likely due to fears over security and transparency, heightened after FTX collapsed

“Not your keys, not your coins”. 

One of the oldest sayings in crypto. And after a year that saw one of the biggest exchanges around shockingly gamble away customer assets in secret, many will wish they had paid it more attention. 

Now, people are listening. Although in truth, this has been happening all throughout the pandemic. The balance of bitcoins on exchanges is now down to 2.27 million – that is the lowest mark since March 2018, a month which saw “God’s Plan” by Drake being played on the radio over and over and over and over again. 

The mark is even lower when compared to the overall supply. There is currently 11.8% of the Bitcoin supply on exchanges. This is the lowest mark since December 2017. 

Crypto fans will remember December 2017 as the month that Bitcoin went absolutely bananas. I remember exactly where I was when I saw that Bitcoin had breached the $20,000 mark for the first time; it felt like a seminal moment. 

It marked the top, incidentally, with the orange coin at $7,500 seven weeks later. Within a year, it wasn’t far above $3,000. It was a long and barren bear market with fortunes not turning around until COVID hit in 2020. 

Where is the Bitcoin going?

I say “not your keys, not your coins”, but this isn’t the only thing driving the movement of coins off exchanges. 

As the above charts show, the Bitcoin supply on exchanges has been coming down since March 2020. This is also the month that COVID kicked off. Since I’ve been in crypto, I also believe it was the scariest time of all – Bitcoin plunged from close to $10,000 to $5,000 in a gruesome 48 hour stretch as markets around the world tried to figure out what exactly this COVID-19 thing was. 

But after this, the bull market kicked into gear. So, why has Bitcoin on exchanges been falling throughout this period?

The truth is, ironically, that it could be for the exact opposite of the matra behind “not your keys, not your coins”, at least in part. This is due to the rise of crypto lending platforms during the bull run – firms like Celsius, BlockFi, Voyager Digital and so on.

These platforms offered a nice yield on Bitcoin, and this attracted billions of dollars of inflows. Now, you may notice one thing about those names: today, they are all bankrupt. Which means that, obviously, coins currently leaving exchanges in recent months are for other reasons. 

So there could be a dual explanation here: during the bull run, coins were leaving exchanges for yield on centralised platforms. Or they were leaving exchanges for DEXs, or other destinations. Crypto was booming at this time; there were no shortage of things to do or yield to earn. 

Today, however, volumes have been decimated. Looking at total value locked within DeFi, it is down to $50 billion, having been up to $180 billion in December 2021. That is a fall of 72%. Simply put, prices are down, volumes are down and interest in general is down. 

This fallen volume and interest have likely reduced the pull of Bitcoin off exchanges. But this drop may have been replaced by people pulling Bitcoin at a similar rate, but for an entirely different reason: to be secure, and to send to cold storage. You can thank Sam and the various other scandals for this. 

The post Bitcoin supply on exchanges lowest since 2017 bull market peak, but why? On-chain report appeared first on CoinJournal.