ConsenSys releases “Diligence Fuzzing,” tool for testing smart contract vulnerability

  • More than $471.43 million was lost through Web3 security vulnerabilities in the first half of 2023.
  • The Diligence Fuzzing has been integrated with the smart contract toolkit Foundry.
  • The tool features a free version for developers who wish to test it out before making any payments.

The blockchain technology company ConsenSys has announced the public release of its “Diligence Fuzzing” smart contract testing tool. The new tool generates “random and invalid data points” to identify contract flaws prior to the smart contract launch.

The launch is very timely seeing that decentralized finance hacks cost over $2.8 billion in 2022. ConsenSys claims that as a result of these losses, developers are adopting more sophisticated testing tools to assist in identifying vulnerabilities before attackers do.

Previously, developers had to request access to the closed beta version of the new tool before using it. As of August 1 after the release of the “Diligence Fuzzing” tool, this approval procedure is no longer required.

Diligence Fuzzing is now integrated with Foundry’s smart contract toolkit, and it offers a free version for developers to try out.

How does the “Diligence Fuzzing” work?

According to ConsenSys security services lead Liz Daldalian, developers using the “Diligence Fuzzing” tool can annotate their contracts using a machine language called “Scribble,” which is also developed by ConsenSys. After doing this, the fuzzing tool will interpret the annotations and produce “unexpected” inputs so as to test whether the smart contract can be forced to produce unintended actions.

ConsenSys security researcher Gonçalo Sá has, however, stated that the “Diligence Fuzzing” tool is not a “black box fuzzer” and that it does not produce completely random data. Instead, Gonçalo says that the fuzzing tool acts as a “grey-box fuzzer” that understands the smart contract’s current state to limit the types of data produced, thus increasing the tool’s efficiency.

The post ConsenSys releases “Diligence Fuzzing,” tool for testing smart contract vulnerability appeared first on CoinJournal.

Bitcoin Cash price prediction as volatility and volume slumps

  • Bitcoin Cash, like other cryptocurrencies, remained in consolidation in July.

  • There are signs of rotation moving from digital currencies to stocks.

Bitcoin Cash (BCH) price had a difficult performance in July as the fear and greed index remained neutral at 50. The coin dropped to a low of $230 in July, down from the monthly high of $330.53. 

Rotation from crypto to stocks

Bitcoin Cash price remained in a tight range as demand and volatility retreated. Data shows that the volume of cryptocurrencies traded in exchanges dropped sharply in July. This happened even after a number of important catalysts happened during the month.

For example, data published by the Bureau of Labor Statistics (BLS) showed that the America’s consumer price index (CPI) dropped from 4.1% to 3.0%. The closely watched personal consumption expenditure (PCE) index dropped from 4.0% to 3.1%. 

These numbers mean that the country’s inflation is falling at a faster pace than expected. As a result, investors believe that the Federal Reserve has completed hiking interest rates. It hiked them by 0.25% last Wednesday to the highest level in 22 years.

Another important crypto news in July was the partial victory by Ripple in its long-running case with the Securities and Exchange Commission (SEC). In her judgment, the judge ruled that XRP was not a financial security.

Therefore, Bitcoin Cash price likely retreated as investors moved from cryptocurrencies to stocks. The Nasdaq 100 index and S&P 500 indices surged to the highest level in months, with the former soaring by 42% this year. As a result, there is a likelihood that many crypto investors moved their funds to stocks.

Bitcoin Cash price prediction

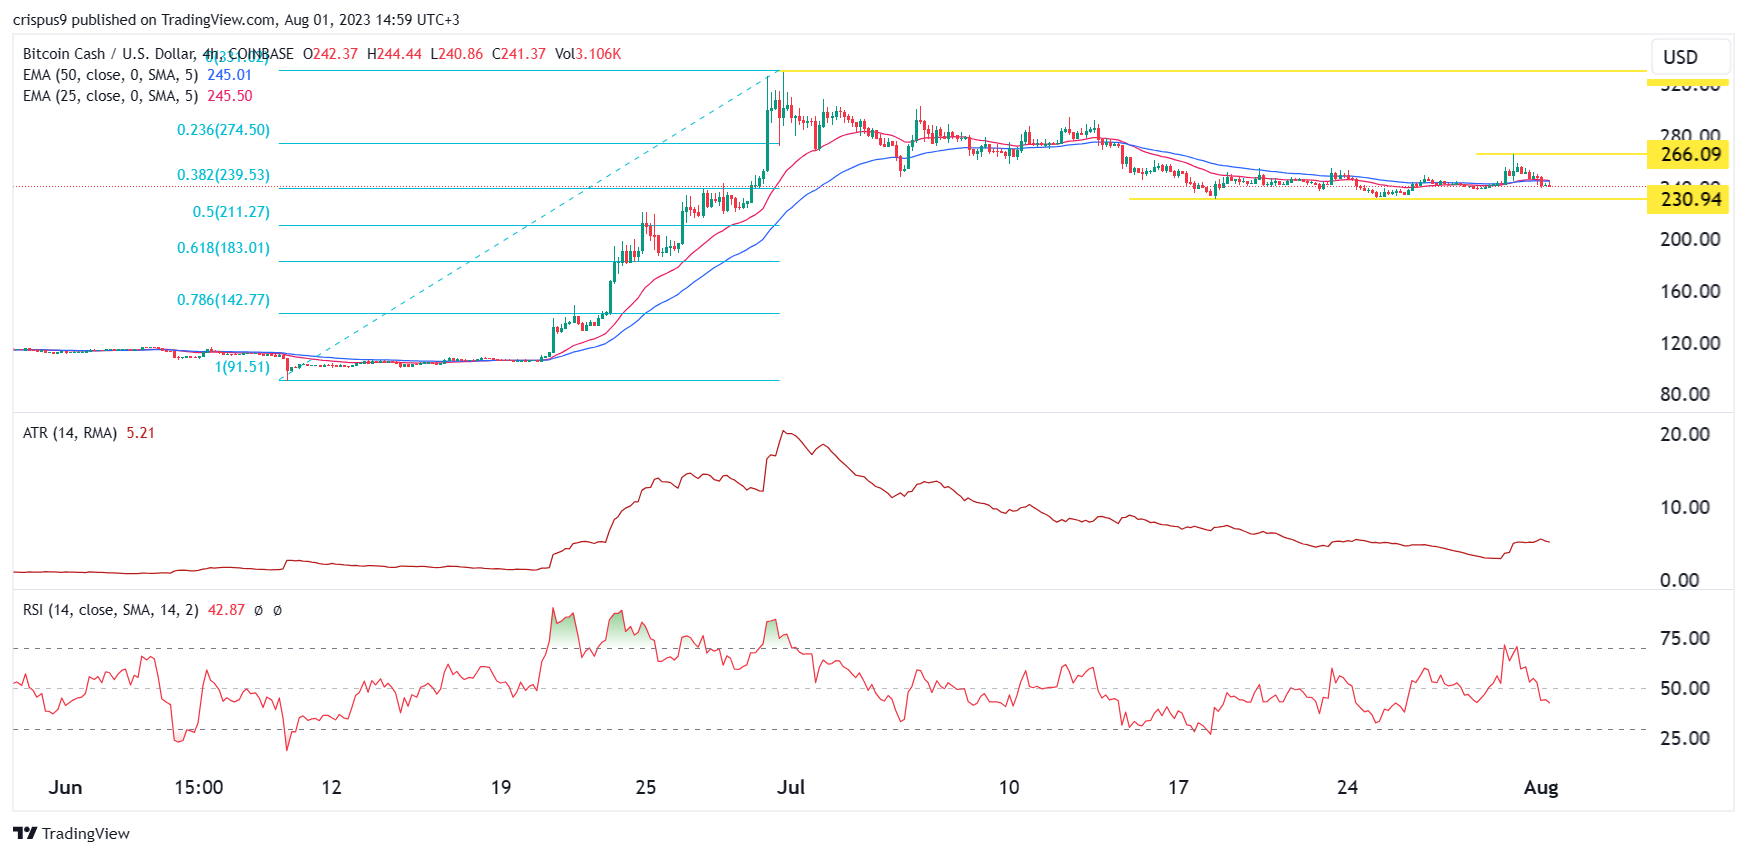
The 4H chart shows that the BCH price has moved sideways in the past few weeks. It has moved to the 50-period and 25-period moving averages. Bollinger Bands have narrowed. The coin has moved above the key support level at $230.94, the lowest level in July.

The Relative Strength Index (RSI) has moved below 50 while the Average True Range (ATR) has retreated. ATR is one of the most popular measures of volatility. 

Therefore, there is a likelihood that the indicator will remain in this consolidation phase in the coming days. A drop below the support at $230 in a high environment will push it to the next support at $200. A move at $266 will open the possibility of the Bitcoin Cash price rising to $300.

How to buy Bitcoin Cash

eToro

eToro is a multi-asset investment platform with more than 2000 assets, including stocks, ETF’s, indices, commodities and Cryptoassets. eToro offers over 60+ Cryptoassets to invest or invest in their CryptoPortfolio where investors can benefit from the accumulated growth of Bitcoin, Ethereum, XRP, Litecoin and other leading cryptocurrencies. eToro users can connect with, learn from, and copy or get copied by other users.

Buy BCH with eToro today

Bitstamp

World’s longest-standing crypto exchange. Since 2011 Bitstamp has been providing a secure and reliable trading venue to over four million individuals and a range of institutional partners.

Buy BCH with Bitstamp today

The post Bitcoin Cash price prediction as volatility and volume slumps appeared first on CoinJournal.

FTX claimants to hold equity securities and tokens in the rebooted exchange

  • The new FTX CEO is working tirelessly to have the FTX crypto exchange launched.
  • FTT token holders will not receive any distributions from the rebranded FTX exchange.
  • FTX claimants will, however, own interests in the newly established offshore FTX Company.

The newly appointed CEO of FTX Trading Ltd., John J. Ray III, has unveiled a new draft strategy to “reboot” the defunct FTX cryptocurrency exchange.

In the proposal, which was unveiled on Monday, FTX.com claimants are allowed to own equity securities, tokens, or other types of interests in the newly established offshore company.

What will happen to FTT holders?

The new plan describes the debtors’ approach to grouping claimants into different categories. Users of the offshore FTX.com exchange will be referred to as “Dotcom customers,” while those using the FTX US will be called “U.S. customers.”

The Dotcom Customer Pool, the U.S. Customer Pool, and General Pool are the three main recovery pools that are suggested to be created on the new exchange. All fiat, digital, and other specified assets connected to FTX.com and FTX US will be included in these pools.

The newly created company, which was established in collaboration with outside investors, will run a “rebooted” offshore platform that won’t be available to American investors.

Each Dotcom customer will receive a pro-rata share of the proceeds from a pool of assets tied to the FTX.com exchange. However, the new plan indicates that claims from FTT holders, the collapsed exchange’s native token, “will be cancelled and extinguished as of the Effective Date and holders will not receive any distribution.”

Furthermore, claims from non-customers, like the regulatory penalties and taxes claims, will be subordinated.

The development comes a few days after FTX and Genesis agreed to an in-principle settlement to resolve claims by the two companies in the bankruptcy proceedings.

FTX 2.0 impending launch

The idea of restarting the collapsed FTX exchange was first suggested by the new FTX boss in January. The new management had targeted to relaunch in Q2, 2023.

According to a court document filed in May, Ray has been actively investigating the steps needed to restart the business and reviewing and completing the “FTX 2.0” materials to be distributed to investors.

Following the recent development and the anticipation of the FTX reboot, the FTT token has been climbing. At press time the FTT token price was trading at $1.41 up 5% in the last 24 hours.

The post FTX claimants to hold equity securities and tokens in the rebooted exchange appeared first on CoinJournal.

Crypto’s correlation with stocks rising again following temporary deviation


Key Takeaways

  • Crypto had moved in line with stocks and other risk assets throughout the interest rate tightening cycle
  • This relationship weakened in June amid the crypto regulatory crackdown
  • The correlation has recently picked up again, however
  • Going forward, relationship may change again as the market anticipates the tightening cycle is coming to a close

We know that within the digital asset space, the different cryptocurrencies are highly correlated. As a generalisation, it is fair to say that many altcoins tend to trade like levered bets on Bitcoin. 

Going beyond the asset class and assessing correlations with other asset types becomes more interesting. One of the most intriguing trends to track is the correlation between Bitcoin and stocks. If we want to assess Bitcoin through a macroeconomic lens, its relationship with other asset classes is of vital importance. 

The last eighteen months have thrown this relationship into a new light, as correlations have been extremely high amid one of the fastest interest rate tightening cycles in recent history. With liquidity sucked out of the economy, risk assets were hammered last year, including Bitcoin. 

Compared to the tech-heavy Nasdaq, Bitcoin’s correlation has been persistently high throughout this period, bar a few noticeable instances. As displayed on the below chart from an analysis we compiled six weeks ago, the collapses of Luna, Celsius and FTX saw deviations in this relationship. 

These explain themselves, as dramatic crypto-specific episodes that had no effect on stocks. However, the more recent deviation was bigger than any: coming in June amid the regulatory crackdown (chart is taken from June 15th, a week after the Binance and Coinbase lawsuits). 
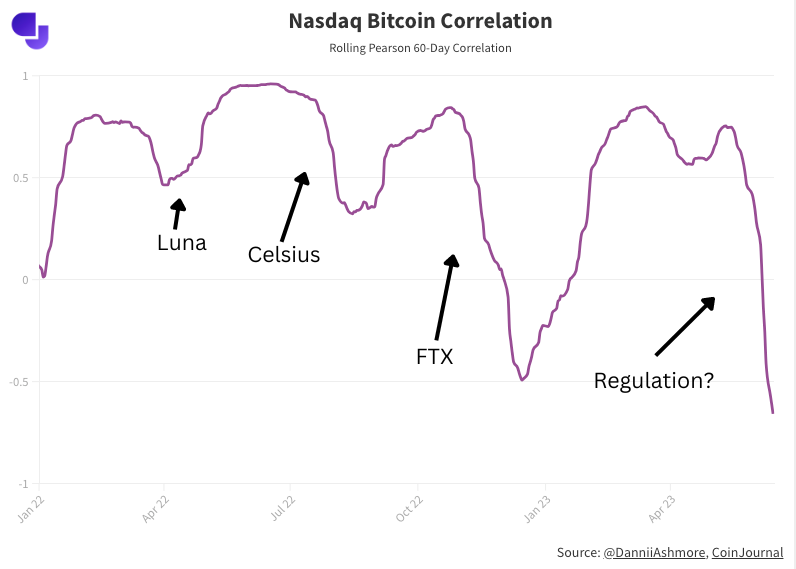
In fact, this deviation brought the Nasdaq’s correlation with Bitcoin to a five-year low. If we now re-run this chart, we see the correlation has picked back up again, rising to 0.5 and trending upwards.


This highlights what we already knew: the deviation is only temporary. It came following a month where the Nasdaq jumped 10% off softer forecasts around the future path of interest rate hikes, while Bitcoin fell 9% over the same time period as lawmakers tightened their squeeze on the industry, suing the two largest exchanges and confirming several tokens constituted securities.  

The climate has picked up for crypto since. Ripple won an important case (or, partially won, but the result was undoubtedly positive for the space), while a slew of spot ETF applications have also served to increase optimism. 

While the deviation was always going to be temporary, going forward in the medium-term, things could get more interesting. This is because, finally, the market is anticipating that the majority of interest rate hikes are in the rearview window, with perhaps only one more still to be endured, if even. 

This could release the shackles which have been around Bitcoin’s ankles, and it remains to be seen how the asset will henceforth move in relation to the stock market. We know that the correlation picked up as soon as the Federal Reserve began hiking interest rates; correlations go to 1 in a crisis, and there is a flight to quality – risk assets suffer in that scenario, and that is exactly what we saw. 

There is every chance that both stocks and Bitcoin will continue to trade in tandem, but if/when this tightening cycle ends, it will at least give the market a fresh opportunity to trade them whilst global liquidity is not being pulled off the table. 

Regardless of the relationship between the duo, the below chart shows just how dependent Bitcoin has been on yields – the two-year treasury yield, plotted on an inverse scale, has moved exceptionally closely with Bitcoin, ever since the latter’s all-time high in November 2021. 

How will Bitcoin’s relationship with gold change?

It is Bitcoin’s relationship with gold that provides an equal amount of intrigue, given the former’s designs on becoming some sort of digital equivalent of the latter. Should Bitcoin become a store of value, it will need to become a little more boring with regard to price movements – something gold is well known for. 

However, correlation between the two assets has dipped, moving in the opposite direction to that of stocks. From rising markedly this year, it has fallen sharply in the last month. 

If Bitcoin is to achieve what so many want to do – become an uncorrelated asset capable of offering a portfolio hedge properties – it must flip the script here. Its relationship with stocks will need to loosen, while it will need to get closer to the way gold trades. 

Having said that, Bitcoin has been around only 14 years, and has traded with reasonable liquidity for far less than that. It is still finding its feet, and it remains early – certainly compared to gold, which has been around for thousands of years. 

The post Crypto’s correlation with stocks rising again following temporary deviation appeared first on CoinJournal.

Chainlink price prediction: Here’s what top analyst says about LINK

  • Chainlink (LINK) traded to highs of $8.44 before retreating amid broader market uncertainty.
  • A top crypto analyst says LINK seeing a weekly close below the macro downtrend line portends fresh losses. 
  • The “Macro Breakout is postponed” the analyst noted on Monday. 

Chainlink posted an impressive run in the week of July 13-21, notching a +20% gain in a single day on July 20 as it hit a three-month high of $8.44. On-chain volume spiked to over $347 million as traders poured into the altcoin amid positive network developments.

Chainlink price analysis

LINK bulls appeared to be on the way to retesting a key technical level just under $10, with price poised to break a multi-year macro downtrend. 

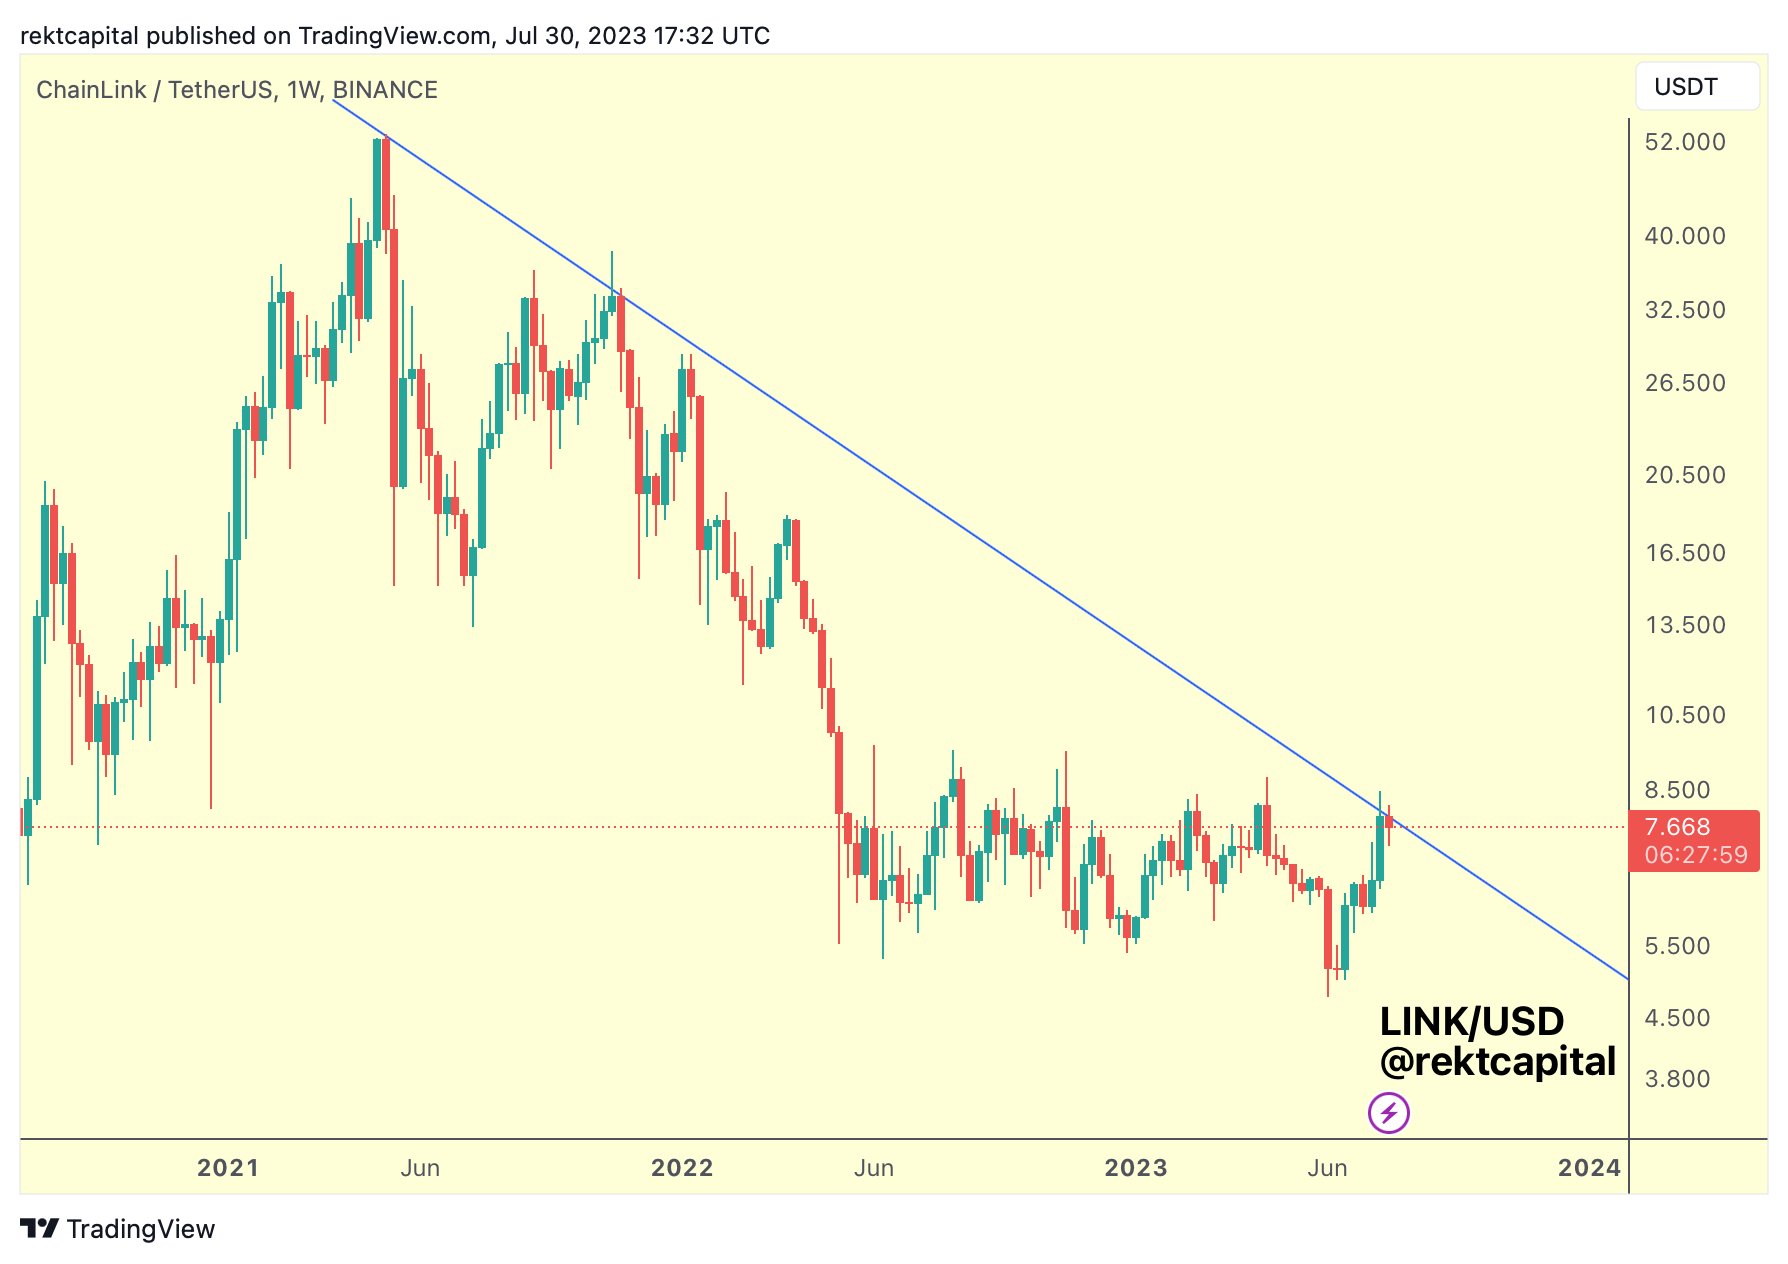
Crypto analyst Rekt Capital highlighted this on Friday, identifying a potential weekly close above the macro downtrend line as a likely indicator of bullish strength.

As can be seen in the chart below, Chainlink price has recoiled from the crucial hurdle with a weekly close below. According to the analyst, the scenario where the would-be macro breakout has fizzled out (at the moment.)

“$LINK has ultimately performed its new Weekly Close below the Macro Downtrend. As a result, the Macro Breakout is postponed. Unless #LINK is able to reclaim this Macro Downtrend as support, price is positioning itself up for a rejection from here,” Rekt Capital shared on X (fka Twitter).

Chainlink weekly price chart showing LINK new weekly close. Source: Rekt Capital.

LINK currently trades near $7.60, largely flat in the past 24 hours. Investors have seen gains recorded over the past week cut to just 1%. LINK/USD is up 20% in the past 30 days.

If prices fall below $7.00, the next major support zone could be around $5.00. On the upside, $8.50 and $10 are key supply zones. 

Here’s something else the analyst points out about Chainlink price performance.

The post Chainlink price prediction: Here’s what top analyst says about LINK appeared first on CoinJournal.