
Solana price prediction: What next for SOL after 110% upside in Q1 2023?

  • Solana price is up 110% in the past three months.
  • SOL closed in the red in February and is likely to end March 4% lower, but January ended with SOL 140% up.
  • Crypto intelligence firm Messari has highlighted Solana’s growth potential as network navigates away from recent outages and other challenges.

Solana price is negative on the monthly time frame in March, with SOL/USD at $20.88 currently seeing the token down 3% in the past 30 days. Notably, Solana price remains 80% down this past year and about 91% off its all-time highs of $260 reached in November 2021.

However, the cryptocurrency is set for its best quarterly returns in nearly two years. This is despite all the downside pressure amid network challenges since late last year, with SOL’s returns over the past three months well over 100%.

Messari highlights Solana growth potential

Crypto market intelligence firm Messari recently highlighted Solana’s growth even as FUD spread, noting that trying to compare the blockchain to some L2s in terms of TVL was missing the point.

“Comparing Solana’s TVL to other emerging chains doesn’t tell the full story. Usage has been driven by non-TVL dominant use cases like derivatives, NFTs, & DePIN networks. If Solana decides to turn on incentives, we could quickly see volume approach parity with the top L2s,” Messari researchers wrote.

According to Messari, Solana developers are focused on simplifying the deployment of innovative DeFi strategies, automation of on-chain instructions, and deployment of Web3-native websites among others. The pivot towards these efforts could prove key to the Solana ecosystem, with greater adoption very much likely.

What next for Solana price?

TradingView data shows the 3-month candle for SOL/USD is currently poised at +110%. It’s the best quarterly return since Q2, 2021, when the price of Solana rose almost 300% as bullish momentum catapulted cryptocurrencies higher.

Looking at the monthly chart, Solana returns are highest in January with a monthly close at $23.93 giving it 30-day gains of 140%. The last time SOL/USD posted more gains on the monthly timeframe was in August 2021 when prices jumped 195%.
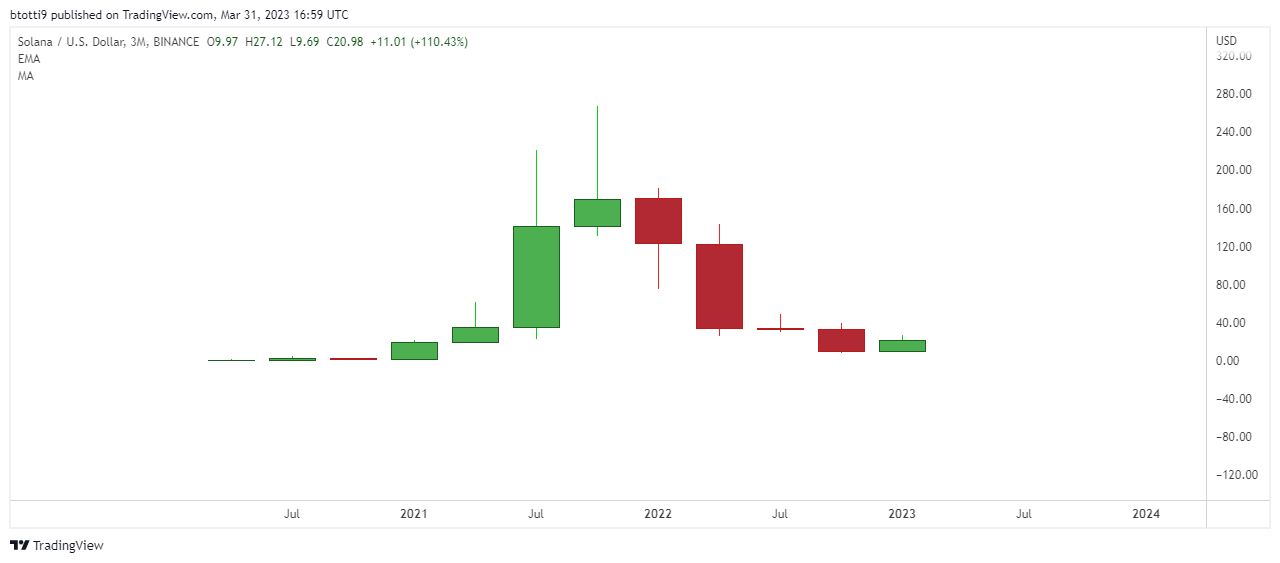
Solana price on the 3-month chart. Source: TradingView

February and March were not so profitable for bulls, with prices down 9% in the second month of 2023. A look at the weekly chart for SOL suggests a slight advantage for sellers with the weekly RSI below the 50 line and prices facing an uphill task towards $40.

On the downside, a breakdown below $20 could risk new dump to the 16.

The post Solana price prediction: What next for SOL after 110% upside in Q1 2023? appeared first on CoinJournal.
Crypto prices: Bitcoin to end first quarter on a bullish note

The cryptocurrency market cap was around $1.24 trillion as Bitcoin price reclaimed the $28,500 level, with crypto poised to end the first quarter of 2023 higher. BTC price was up 24% in the past 30 days, and 83% up year-to-date.

Crypto analyst Rekt Capital says Bitcoin is poised for a historic quarterly close, which could inform upward impetus over the next several months.

Meanwhile, bullish momentum over the past three months has also seen Ethereum price jump nearly 64% YTD. ETH with a daily close at current prices will see it end March 15% higher. The outlook for most top altcoins is the same, with XRP, Binance Coin (BNB), Polygon (MATIC) and Cardano (ADA) set to end Q1, 2023 higher.

Bitcoin and tech stocks higher YTD

While the US stock market opened higher on Friday, with equities buoyed by the latest economic data, the overall gains across tech stocks pale when compared to Bitcoin. For instance, the S&P 500 was 6.75% up YTD at 11:30 am ET, the Dow Jones Industrial Average was 0.4% down over the period and the tech-heavy Nasdaq Composite was 16.7% up.

However, Bitcoin and some tech stocks have outperformed most other assets this quarter. As noted above, BTC/USD is 83% up YTD and will likely close the quarter with more than 80% in gains. Tesla (TSLA) was 86% up at the time of writing, while Meta Platforms (META) was +63% YTD.

The Apple (AAPL) stock was +30% YTD on Friday, while Amazon (AMZN) had gained more than 20% this quarter.

The post Crypto prices: Bitcoin to end first quarter on a bullish note appeared first on CoinJournal.

Ethereum Classic price: ETC looks primed for sharp 22% decline

  • Ethereum Classic price is down 2.5% in the past 24 hours.
  • ETC has failed to ride broader market sentiment, currently poised near $20.
  • A breakdown amid increased sellig could push ETC/USD down 22% to lows of $16.

Ethereum Classic (ETC) has not had a good March as has some of the top cryptocurrencies, including the top two of Bitcoin (BTC) and Ethereum (ETH).

As BTC flirted with resistance around $29,000 on Thursday, and ETH price consolidated near $1,800, Ethereum Classic price looked primed for fresh losses at $20. ETC is flat on the weekly time frame and negative this past 30 days.

ETC price: bulls need to hold $20 or risk double digit decline

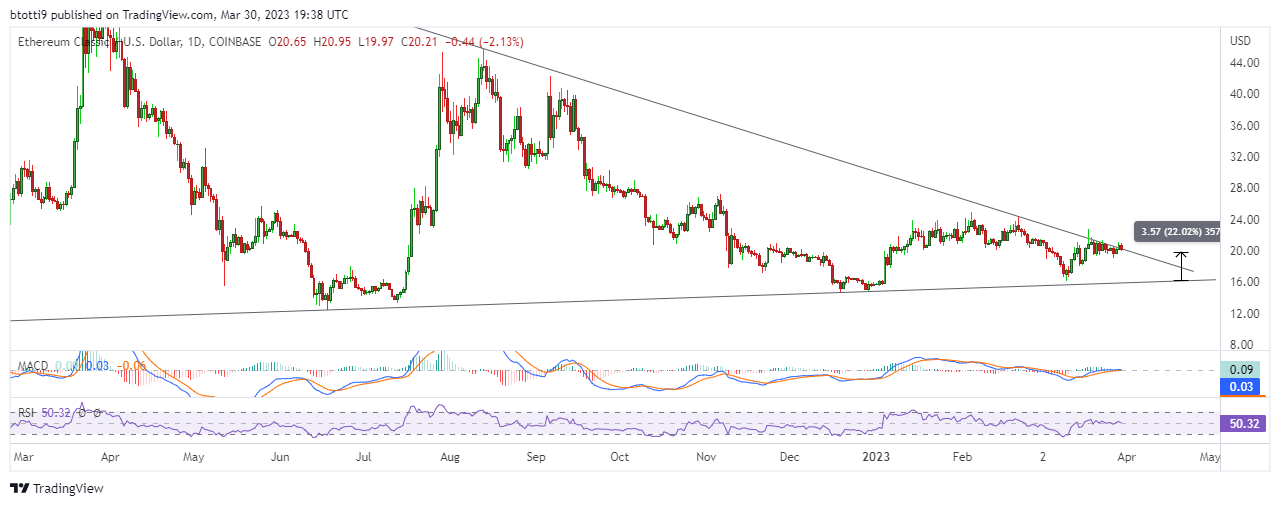
The Ethereum Classic price outlook on the daily chart has the ETC/USD pair rejecting at the key supply zone just above $20. The macro downtrend remains in place as bears push bulls from the resistance line of the long term symmetrical triangle pattern.

Ethereum Classic price chart. Source: TradingView

The daily RSI is almost flat at the middle line though, suggesting greater indecisiveness all around. The bulls can take advantage of the lack of major upside action over the past few weeks to push higher. 

But the daily MACD gives buyers no joy and a breakdown in sentiment could threaten a 22% nosedive to the base line support around $16.

On the upside, a break above $24 would see bulls eye $30 and then possibly $39, with a major symmetrical triangle breakout likely to bring $75 into play over coming months.

The post Ethereum Classic price: ETC looks primed for sharp 22% decline appeared first on CoinJournal.

Is Bitcoin regaining its status as a safe-haven asset?

Bitcoin is on track for its third consecutive month of positive gains as investors continue to see it as a hedge against the recent bank failures.

Bitcoin has been breaking up with equities

What’s more interesting is that it’s no longer trading in lockstep with the S&P 500. In fact, data from Coin Metrics suggests the correlation between Bitcoin and equities is now the weakest since September 2021.

That makes sense, of course, considering its valuation is not coupled with earnings growth as in the case of equities. According to Alex Thorn of Galaxy Digital:

The correlation data shows that, at least recently, Bitcoin has indeed performed more like a safe-haven asset than a risk asset.

Bitcoin is currently up about 70% for the year.

Bitcoin is making a bond again with gold

On the flip side, the banking crisis has helped Bitcoin reestablished the correlation it once shared with gold. That also signals its now regaining the status as a “risk-off” asset. Thorn added:

Given the nature of current crisis – in which fractional reserve banking system’s core limitations are tested – Bitcoin’s fundamental characteristics genuinely distinguish and offer a safe port in a storm.

Remember that the world’s largest cryptocurrency had a difficult 2022 partly because of the aggressive rate hikes. Now that we’re near the end of that cycle, though, it’s likely that Bitcoin will have a clearer path ahead for upside.

Last week, Fed Chair Powell signalled only one more rate hikes this year.

The post Is Bitcoin regaining its status as a safe-haven asset? appeared first on CoinJournal.

XTZ price outlook as Mumbai upgrade goes live on Tezos

  • Tezos price is poised between key suppport around $0.97 and major resistance at $1.28.
  • XTZ bulls could target $2 in April if price breaks higher, or seek support at $0.70.
  • The Tezos blockchain welcomed its 13th network upgrade dubbed Mumbai.

The price of Tezos (XTZ) is down roughly 6.2% in the past 30 days, with declines of 1.2% seen in the past 24 hours. The market has largely been stable as far as XTZ price goes, with XTZ/USD hovering just above $1.10 since the retreat from highs of $1.50 in February.

Tezos price is down 70% this past year, and more than 87% off its all-time highs of $9.12 reached in early October 2021.

Tezos’ Smart Rollups go live via 13th protocol upgrade

Tezos is a proof-of-stake (PoS) blockchain designed to be self-evolving or self-amending with adoption.It means the blockchain undergoes several upgrades as it looks to increase security and decentralisation. 

Tezos’ liquid proof-of-stake consensus mechanism allows for the staking of XTZ, which is called baking. Holders of XTZ can earn rewards when they “bake” to help keep the network secure.

After introducing updates to optimistic rollups and consensus keys via its 12th upgrade dubbed Lima in December 2022, Tezos announced on Wednesday the next upgrade – Mumbai – was live. The main update from this 13th upgrade to the blockchain is the introduction of Smart Rollups.

The upgrade introduces a layer-2 scaling solution that will bump the network’s transaction throughput, with block time reduced from 30 seconds to 15. Apart from enabling faster transaction processing, Mumbai also enhances the security and integrity of decentralised applications (dApps) built on Tezos.

XTZ price outlook

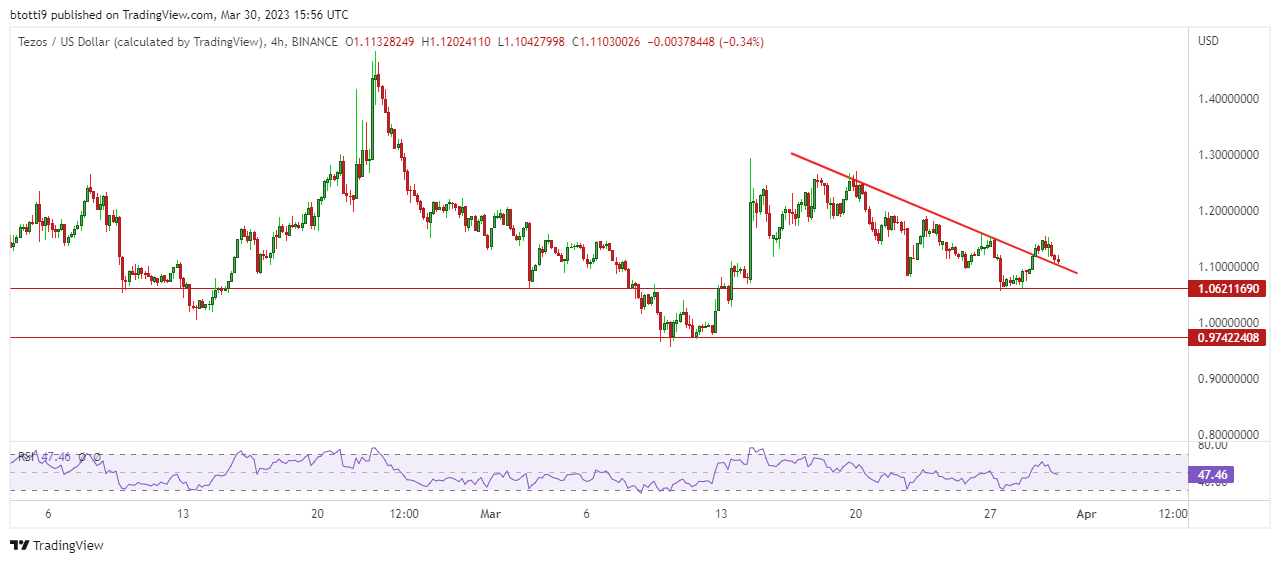
The price of XTZ is retesting the support of a downtrending line on the 4-hour chart. While there is decent demand around $1.06, the 4-hour RSI is dipping below 50.

Tezos price on the 4-hour chart. Source: TradingView

As such, a breakdown from the downtrend line could increase selling pressure and see XTZ/USD seek fresh impetus from around $0.97. Beyond this, Tezos could rely on the robust support expected near $0.70.

On the upside, the key resistance zone to turn into support is around $1.28. If this happens amid increasing buy pressure, bulls can target $1.50 and then $2.00 in April.

The post XTZ price outlook as Mumbai upgrade goes live on Tezos appeared first on CoinJournal.