Anchor Protocol price prediction as TVL crawls back to $20 billion

The Anchor Protocol price is still under pressure even after its market activity did relatively well. The ANC token is trading at $1.7100, which is slightly above this month’s low of $1.5855. It remains being about 72% below the highest level this year, bringing its total market cap to over $587 million.

Anchor TVL is rising again

Anchor Protocol is a leading blockchain project that is in the decentralized finance (DeFi) industry. It is a lending and savings platform that is known for delivering exciting rewards to its users.

According to its website, Anchor has a total value locked (TVL) of over $19.9 billion. Of these, the total deposits are more than $14 billion and a total collateral of more than $5.9 billion. The coin has a total yield reserve of over 198 million UST.

The Anchor Protocol’s performance has lagged in the past few months as investors reacted to the introduction of the semi-dynamic earn rate. This simply means that the coin’s earn rate will be adjusted every first day of the month. 

Learn more about how to buy cryptocurrency.

The built-in system updates the APY by + or minus 1.5%, with the ceiling being 20%. This system depends on the yield reserve. For example, if the yield reserve rises by 1.5%, the earn rate will also rise by 1.5%. 

On the other hand, if the reserve rises by 3%, the earn rate will also rise by 1.5%. Many investors believed that this system was. On Sunday, the official Twitter account announced that the APY for the protocol for this month is about 18%.

The Anchor Protocol is also falling as investors react to the latest Prop 25, which increased the oracle timeout from 60 to 90 seconds. 

Anchor Protocol price
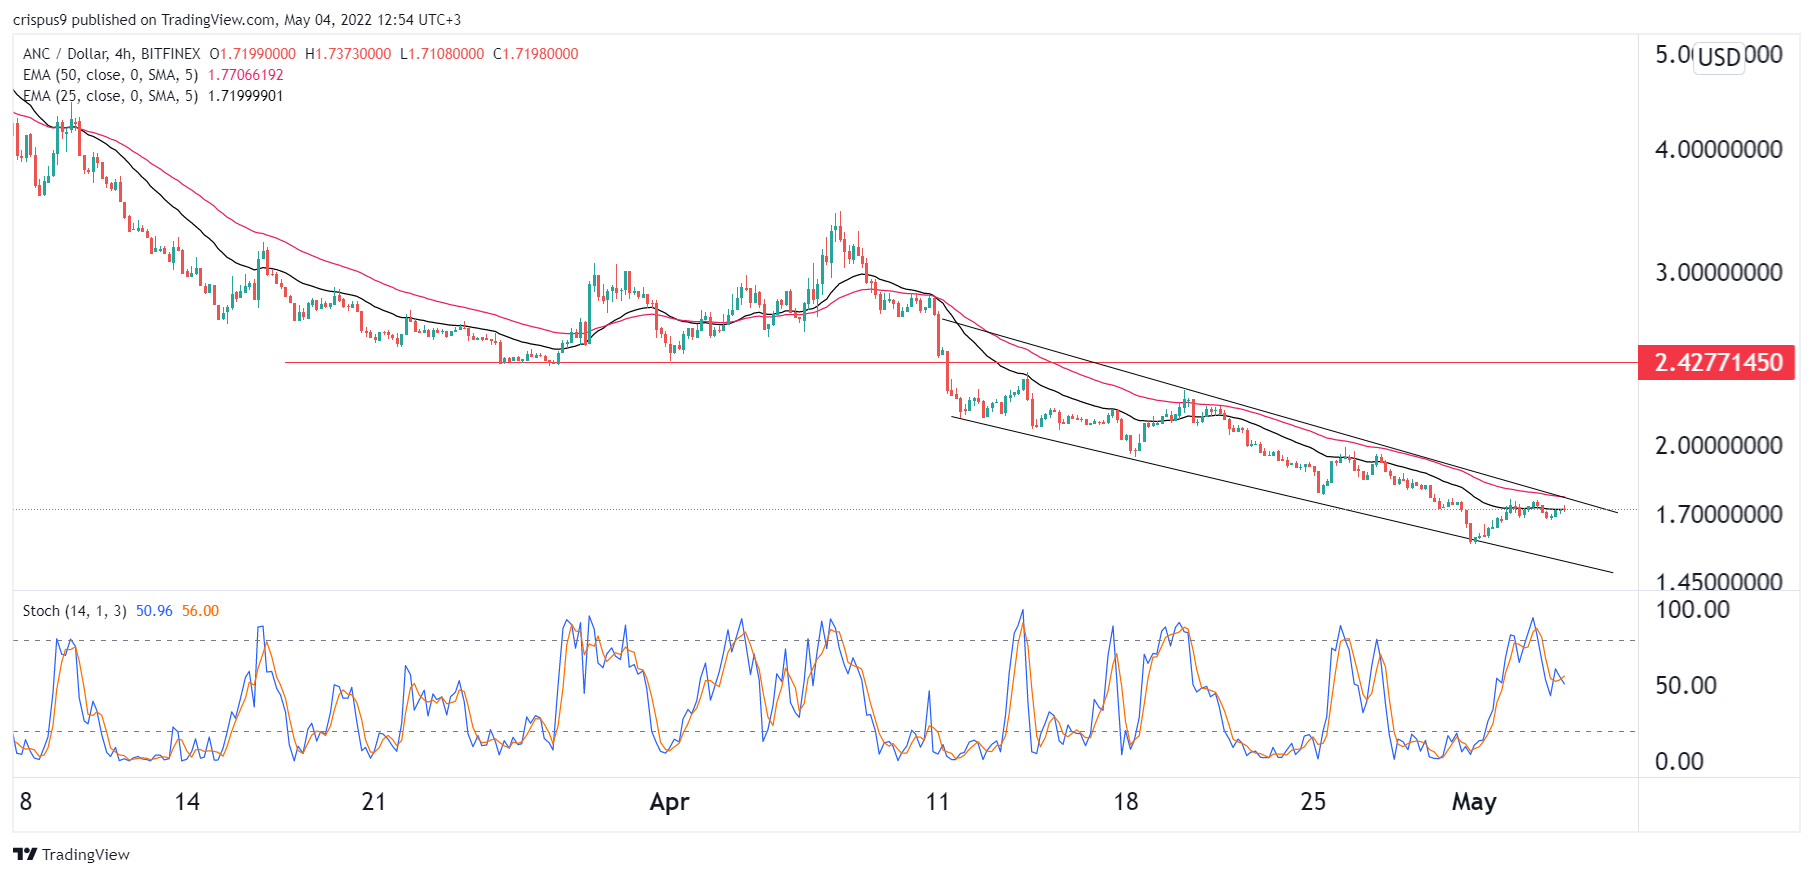
The Anchor Protocol price has been in a strong bearish trend in the past few months as concerns about returns remain. The coin moved slightly below the upper side of the descending channel. It has also moved slightly below the 25-day and 50-day moving averages while the Stochastic Oscillator has moved slightly below the overbought level. 

Therefore, the ANC token will likely resume the downward trend as bears target the lower side of the descending channel at $1.45. A move above the resistance level at $1.8 will invalidate the bearish view.

The post Anchor Protocol price prediction as TVL crawls back to $20 billion appeared first on Coin Journal.

Why is Tron up by more than 11% today?

The cryptocurrency market has been experiencing a mixed performance since the start of the week.

The broader crypto market continues its mixed performance since the start of the week. The market has added less than 1% to its value in the last 24 hours, with the total market cap still above $1.7 trillion.

Bitcoin has found it hard to break past the $39k barrier despite adding 0.95% to its value over the past few hours. Ether risks dropping below the $2,800 level after losing 0.35% of its value in the last 24 hours.

However, TRX, the native token of the TronDAO ecosystem, is the best performer amongst the top 20 cryptocurrencies by market cap. TRX has added more than 11% to its value in the last 24 hours, outperforming the other major cryptocurrencies.

The primary catalyst behind TRX’s ongoing rally is the imminent launch of TronDAO’s decentralised stablecoin USDD. 

TronDAO CEO Justin Sun is set to present and launch the USDD stablecoin during a live event tomorrow, May 5. 

Key levels to watch

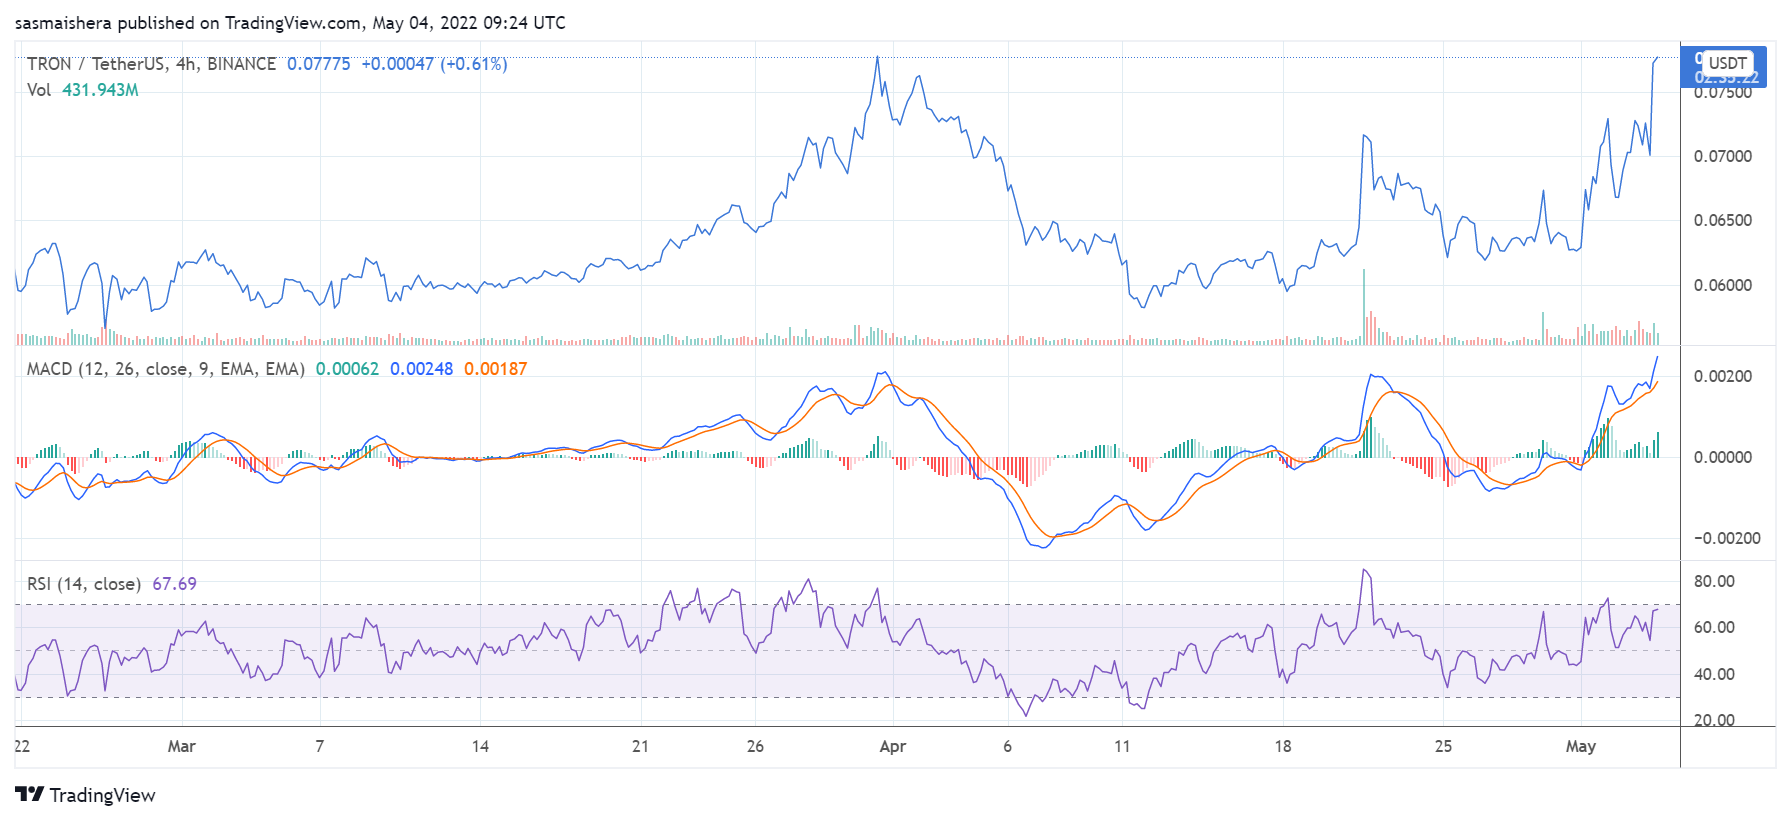
The TRX/USDT 4-hour chart is the most bullish amongst the top 20 cryptocurrencies by market cap. The technical indicators show that TRX is outperforming the other major cryptocurrencies at the moment.

The MACD line is within the positive zone, indicating bullish momentum. The 14-day relative strength index of 67 shows that TRX could soon enter the overbought region if the rally continues.

At press time, TRX is trading at $0.07758. TRX is preparing to surge past the first major resistance level at $0.7825 and could do so before the end of the day. However, the $0.0800 resistance level should cap any further upward movement in the short term.

On the flip side, TRX could slip below the first major support level at $0.07326 if the bears regain control. However, it should comfortably defend the $0.07004 support level over the next few hours and possibly days. 

The post Why is Tron up by more than 11% today? appeared first on Coin Journal.
Ethereum price prediction for May 2022

Ethereum price has gone nowhere in the past few days as investors eye the upcoming interest rates decision by the Federal Reserve. The ETH token is trading at $2,805, which is slightly below this week’s high of $2,883. Its market cap has dropped to about $340 billion, meaning that investors have lost over $160 billion of value recently.

Ethereum April review

Ethereum had a relatively uneventful performance in April. The biggest announcement was that the developers were postponing Ethereum merge date from June this year to the third quarter. Analysts expect that the current network and the Beacon Chain will now merge in August or September. 

The merge delay was a disappointment to many people. However, many investors believe that it was a necessary action because of the significance of the upgrade. Historically, a single era in a blockchain network like Ethereum has led to major hacks. 

Read more about how to buy Ethereum.

Meanwhile, like other chains, Ethereum saw an outflow of total value locked (TVL) in its network. In the past 30 days, the TVL has dropped by more than 11% to about $110 billion. It nonetheless managed to grow its dominance in the industry to 55% as other chains saw a deeper decline. For example, Solana and Fantom declined by over 25%.

Ethereum’s price action also mirrored that of other assets. In April, the Nasdaq 100 declined by more than 18%. In the same period, US bond yields continued rising as the sell-off continued. Bond yields have an inverse relationship with prices. Indeed, in April, the yield curve managed to invert to the lowest level since 2007.

This price action was mostly because of the words by Fed officials. In speeches and statements, officials like Jerome Powell and Mary Daly hinted that the bank will continue hiking rates. Expectations are that the bank will increase rates by 0.50% and start quantitative tightening. 

Ethereum price prediction

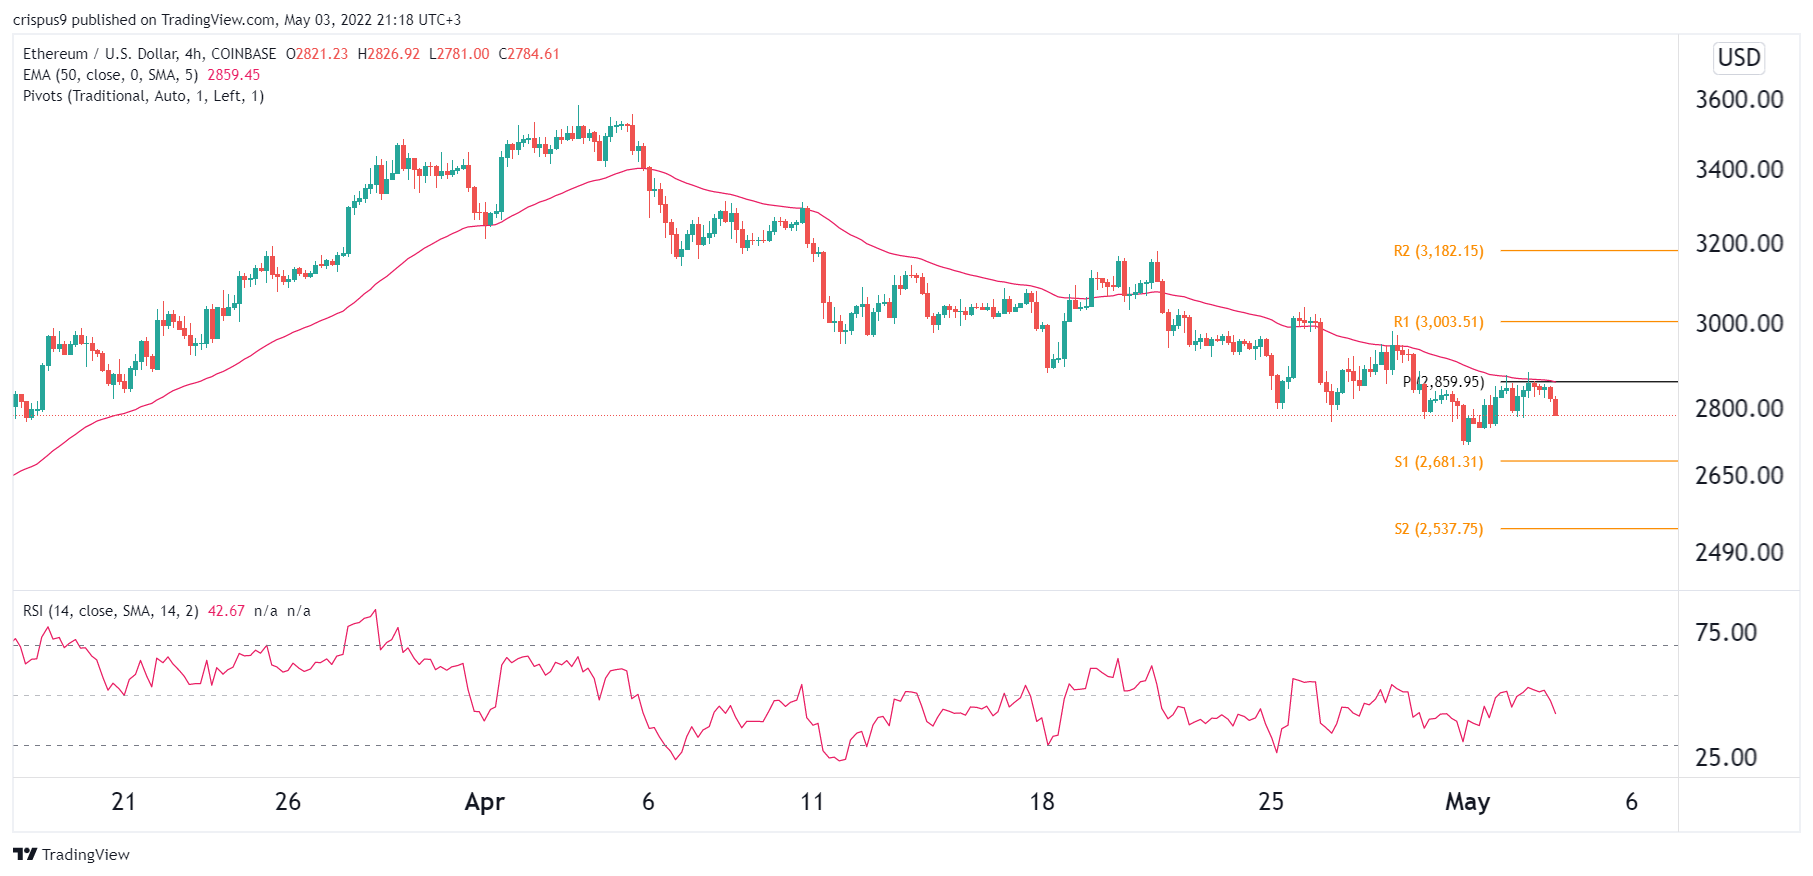
The four-hour chart shows that the ETH price has been in a steady downward trend recently. It has managed to move below the standard pivot point and the 25-day moving average. Also, the Relative Strength Index has moved slightly below the neutral level at 50. 

Therefore, I believe that the Ethereum price will decline modestly in the first part of May and then start bouncing back since the hawkish Fed situation has already been priced in. Therefore, a bounce to $3,200 can’t be ruled out.

The post Ethereum price prediction for May 2022 appeared first on Coin Journal.

Here is why Algorand is up by nearly 20% today

Algorand is the best performing coin amongst the top 30 cryptocurrencies by market cap today.

The cryptocurrency market has continued its mixed performance this week. The market has lost less than 1% of its value in the last 24 hours, and the total market cap currently stands above $1.7 trillion.

Bitcoin is trading at $38,488 at press time as it continues to struggle below the $40k resistance level. Ether has also been unable to surge past the $3,000 psychological level in recent days despite adding 0.8% to its value in the last 24 hours.

ALGO, the native coin of the Algorand ecosystem, is up by nearly 20% in the last 24 hours, making it the best performer amongst the top 30 cryptocurrencies by market cap.

ALGO’s rally comes after football governing body FIFA announced a partnership with Algorand. The agreement makes Algorand the official blockchain platform of FIFA and will provide the official blockchain-supported wallet solution. 

As per the sponsorship agreement, Algorand will also serve as a FIFA World Cup Qatar 2022 Regional Supporter in North America and Europe. Algorand will also be a FIFA Women’s World Cup Australia and New Zealand 2023 Official Sponsor.

Key levels to watch

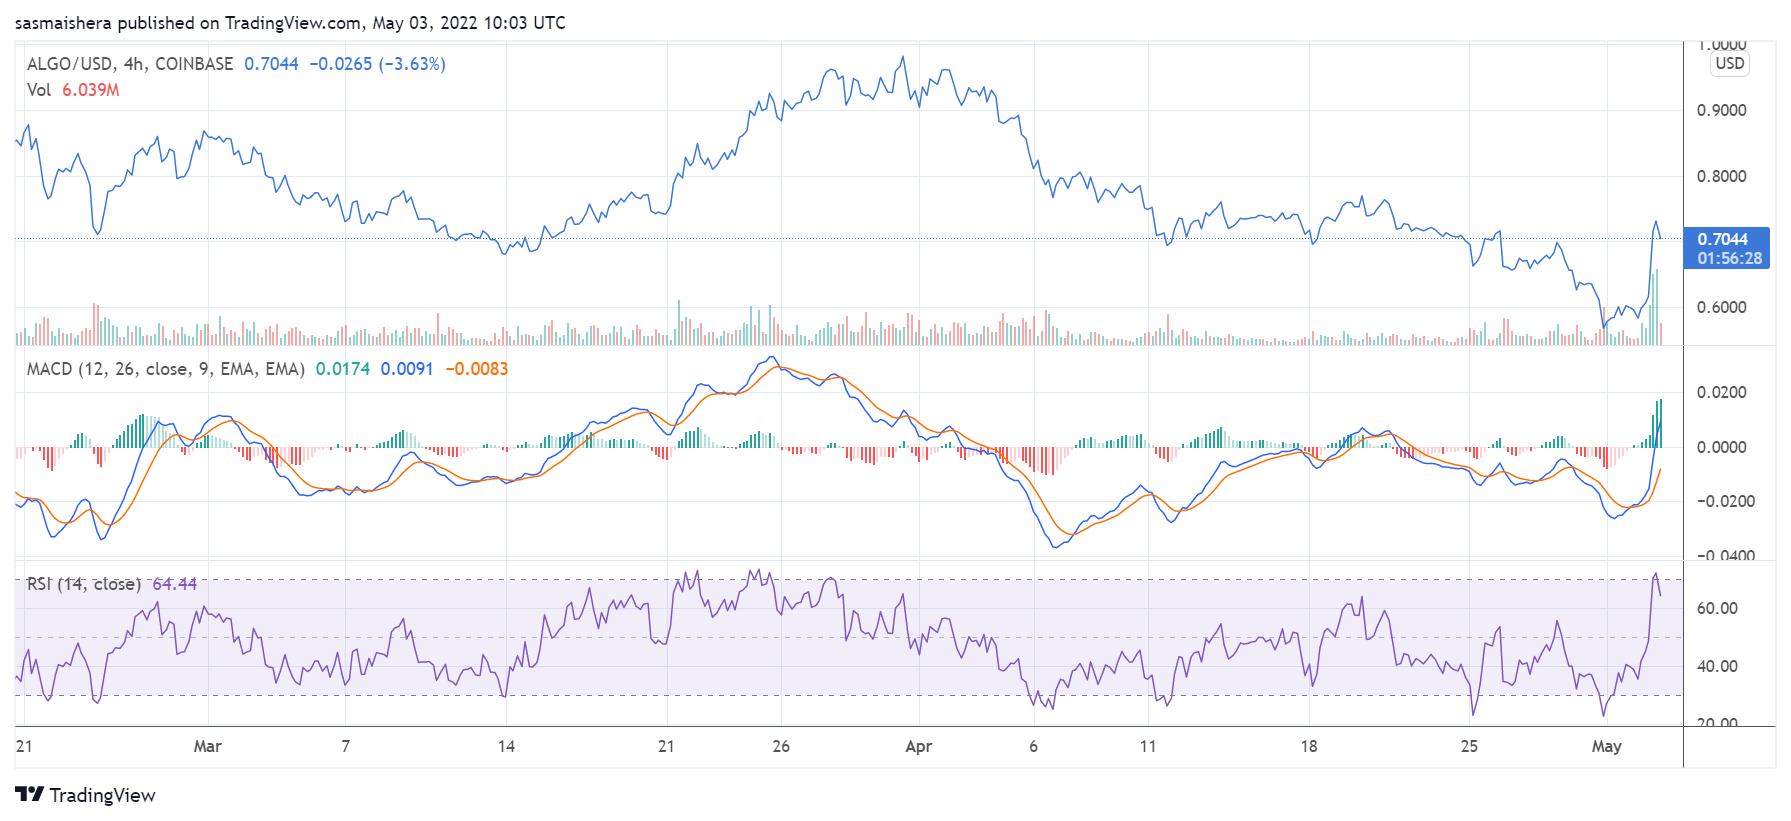
The ALGO/USD 4-hour chart is currently bullish, thanks to Algorand’s ongoing rally. The MACD line crossed into the positive zone following the rally that began a few hours ago.

The 14-day relative strength index of 65 shows that ALGO could soon enter the overbought region if the rally continues.

At press time, ALGO is trading at $0.7092 per coin. If the positive momentum is maintained, ALGO could surge past the first major resistance level at $0.7935 before the end of the day.

However, it would need the support of the broader cryptocurrency market before it can move past the $0.8513 resistance level in the short term. 

The post Here is why Algorand is up by nearly 20% today appeared first on Coin Journal.

Bitcoin price prediction as US bond yields surge

The Bitcoin (BTC/USD) price remained in a tight range as investors reacted to the relatively resilient US Treasury yields. Bitcoin is stuck at $38,500, where it has been in the past few days. This price is substantially lower than its all-time high of near $70,000 while its total market capitalization has declined to about $732 billion.

Rising bond yields

American bond yields continued rising on Tuesday as investors waited for the upcoming interest rate decision by the Federal Reserve. On Monday, the 10-year bond yield crossed the important resistance level at 4% for the first time in years. The 30-year yield also rose to above 3% while the 2-year is about 2.7%.

The bond sell-off happened as investors waited for the upcoming interest rate decision by the Federal Reserve that is scheduled for Wednesday. Economists polled by Reuters and Bloomberg expect that the Fed will sound a bit hawkish in its decision this week. This view reflects the fact that the country’s inflation has surged to the highest level in years.

Read more on how to buy Bitcoin with PayPal.

The Bitcoin price action mirrors that of other assets like stocks and commodities. Futures tied to the Dow Jones have fallen by more than 14% from their highest level in March. The same is true with other indices like the Dow Jones and the S&P 500 index. Bitcoin has had a strong correlation with stocks in the past few days.

Further, the BTC price is reacting to signs that demand for the coin is waning. On-chain data shows that inflows from both small and large investors have been a bit muted in the past few weeks. 

Bitcoin price prediction

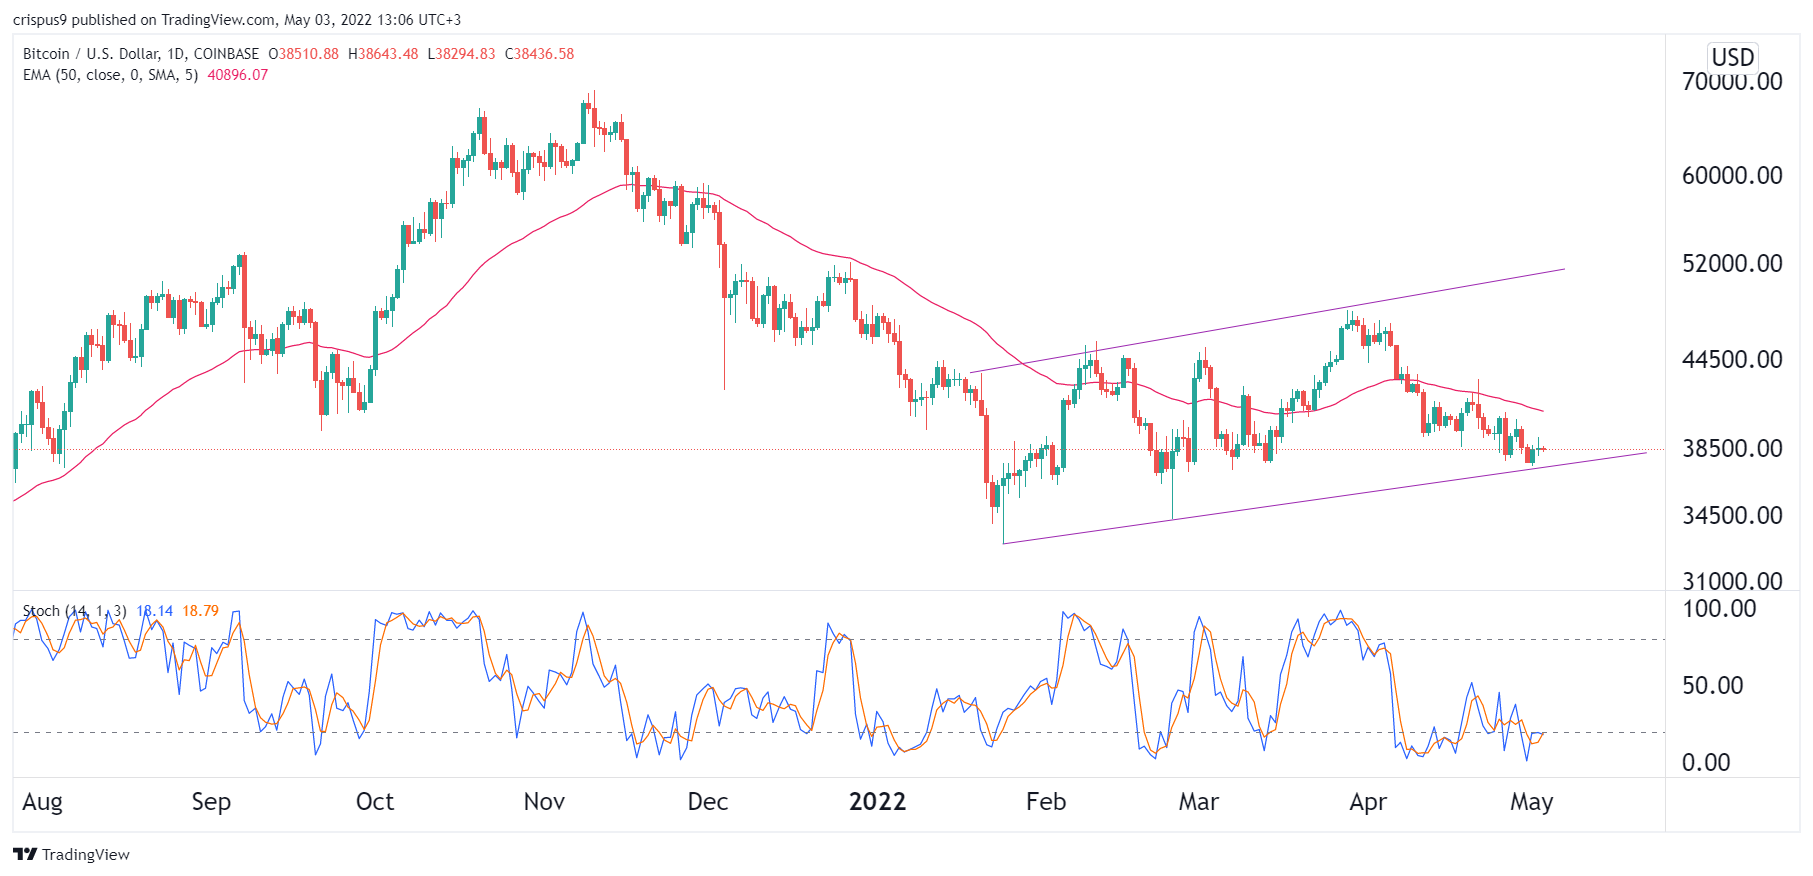
The daily chart shows that the BTC price has been in a strong bearish trend in the past few days. It has moved below the 25-day and 50-day moving averages. At the same time, the price has moved slightly above the lower side of the ascending channel shown in purple. Also, it remains slightly below the lower side of the oversold level.

Therefore, the outlook of Bitcoin at this price is neutral. A move below the lower side of the trendline will send a signal that bears have prevailed and push it much lower. On the other hand, a move above the resistance at 40,000 will mean that bulls have prevailed.

The post Bitcoin price prediction as US bond yields surge appeared first on Coin Journal.