Here’s why the Vite crypto price is soaring and what next

The Vite crypto price is in a slow recovery process as investors buy the dip. The coin is trading at $0.029, which is about 71% above the lowest level in May this year. It remains about 98% below the highest level on record. This brings its total market cap to about $27.8 million, making it a relatively small coin.

What is VITE and why is it rising?

Vite is a low-cost blockchain project that offers zero fees for web3 users. It uses a technology known as directed acrylic graph (DAG), which is a form of technology where individual transactions are linked to multiple other transactions. As such, there are no blocks of transactions in DAG networks.

As a result, Vite helps to ensure that there is instant confirmations and zero-fee transactions. At the same time, Vite has a ViteBridge, which is a generic and decentralized cross-chain transfer protocol to bridge all blockchains. As a result, it helps to bridge blockchains like Bitcoin, Cosmos, Harmony, Polkadot, and Near Protocol among others.

Another part of the Vite network is known as ViteX, which is a high-performance order-book decentralized exchange. It describes itself as the first DEX built on DAG, meaning that it has no fees and faster execution.

Learn more about how to trade crypto.

Some of the top platforms in Vite’s ecosystem are Viva, ExperimentDAO, ViteScan, and Viterium among others.

The developers have been working hard of late. In March this year, they introduced Solidity++ release on the mainnet. They are now working on ensuring that ViteBridge to deploy Avalanche bridge on testnet and introduce ViteX market orders.

It is unclear why the Vite price is in an upward trend. A potential reason is that the coin was recently added in Binance US ecosystem, meaning that Americans can now trade it.

Vite crypto price prediction
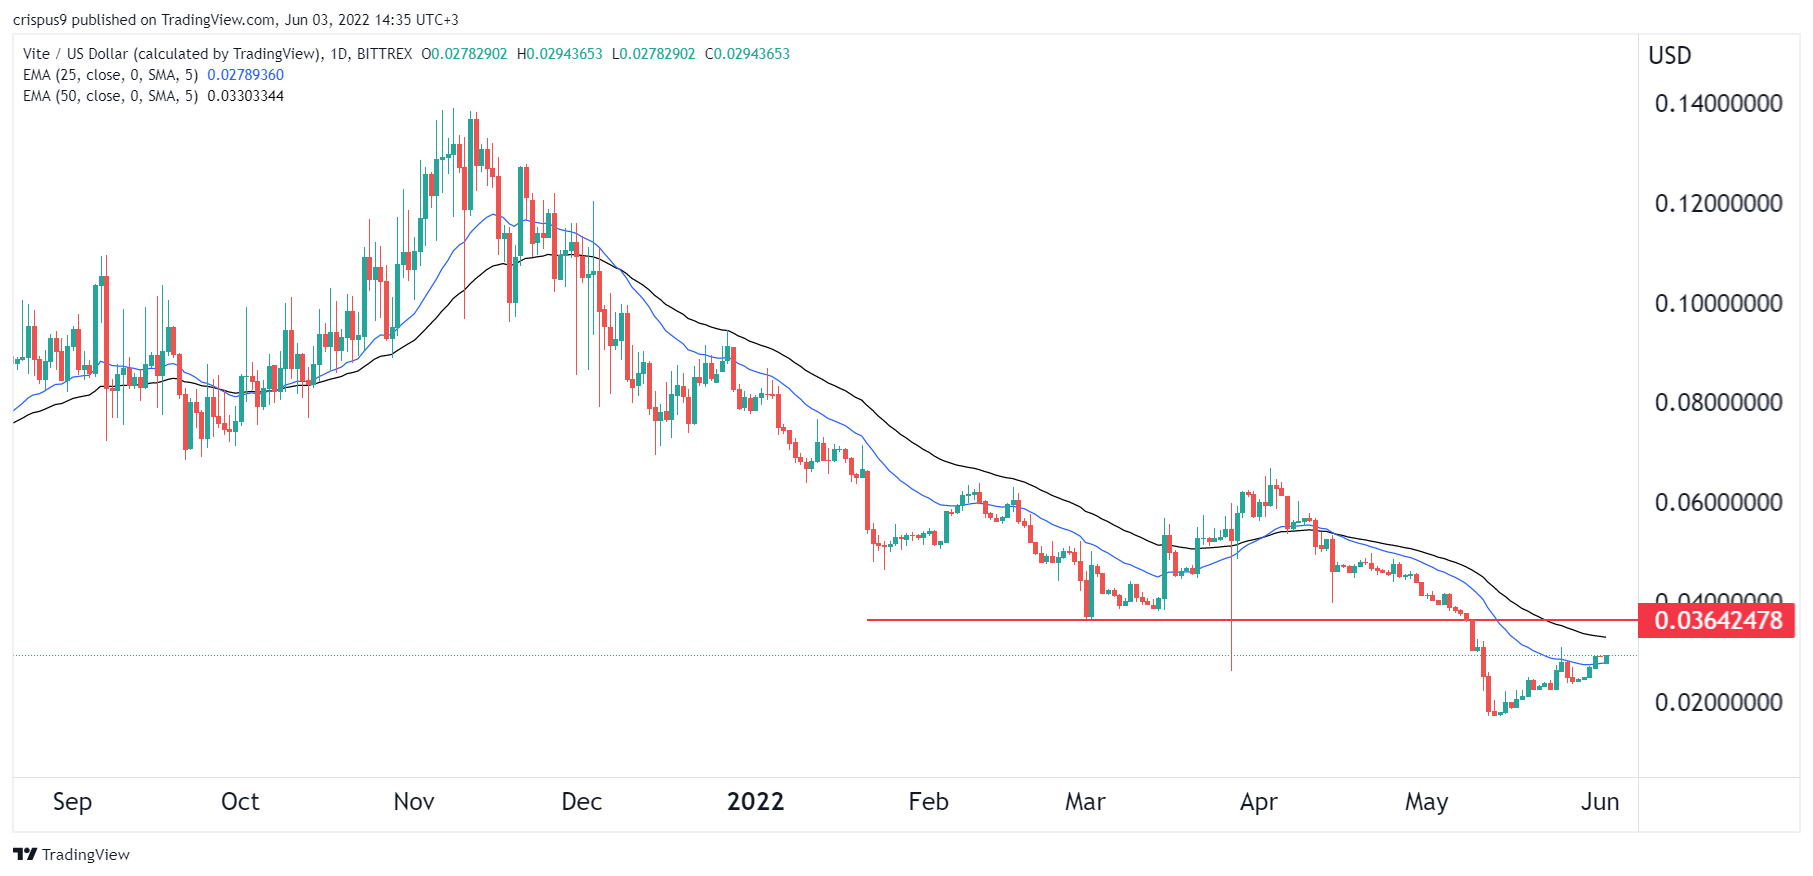
The daily chart shows that the Vite crypto price has been in a strong bullish trend in the past few days. It has managed to move from a low of $0.016. The coin remains below the important resistance level at $0.036, which was the lowest point on March 2.

VITE price has formed a bearish flag pattern and is between the 25-day and 50-day moving averages. Therefore, there is a likelihood that the Vite token price will resume the bearish trend and retest the key support at $0.01690.

The post Here’s why the Vite crypto price is soaring and what next appeared first on CoinJournal.

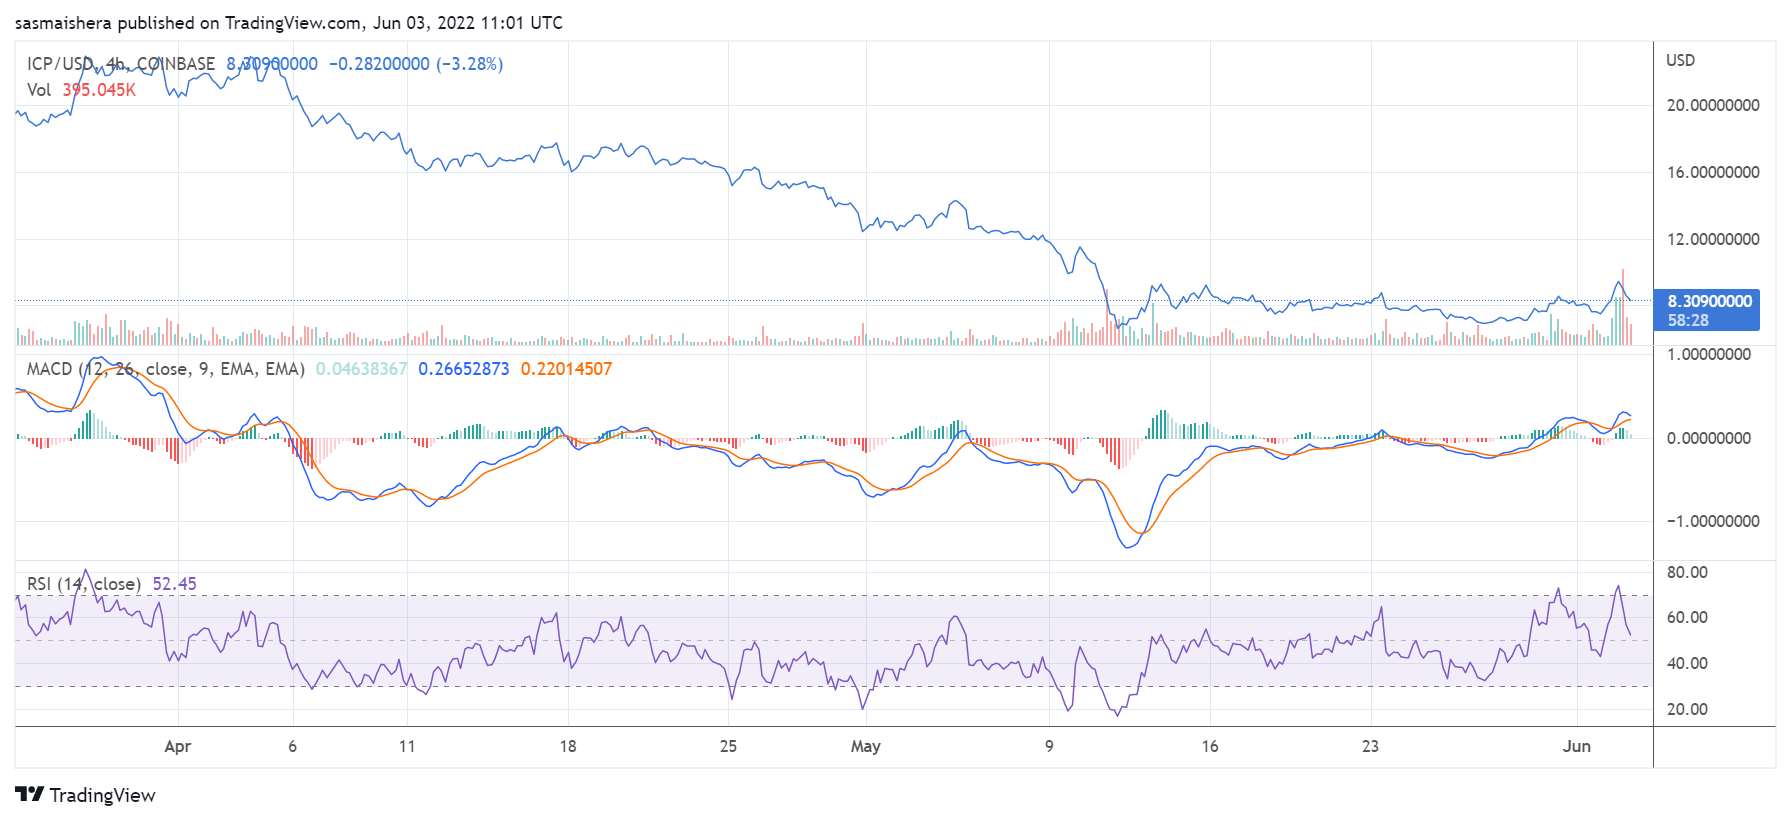
Why is ICP up by more than 9% today?

The cryptocurrency market is recovering from the slump it suffered earlier this week. 

The cryptocurrency market is trading in the green zone after losing some of its value earlier this week. The market has added more than 1% to its value in the last 24 hours, but the total market cap remains below $1.3 trillion.

Bitcoin is still struggling below the $30k mark despite adding less than 1% to its value so far today. Ether is in the red zone, dipping by more than 3% in the last 24 hours. At press time, ETH is struggling to stay above the $1,700 support level.

ICP, the native token of the Internet Computer ecosystem, is currently the best performer amongst the top 50 cryptocurrencies by market cap. ICP has outperformed the other major cryptocurrencies in the last 24 hours.

There is no apparent catalyst behind ICP’s ongoing positive performance. In the last seven days, ICP has added more than 15% to its value.

The Internet Computer community might be warming up to DFINITY’s upcoming SUPERNOVA hackathon. This is the hackathon of the Internet Computer community, and could see some great projects deployed on the blockchain.

Key levels to watch

The ICP/USD 4-hour chart is bullish as ICP has been performing well over the past few days. 

The MACD line is within the positive territory, indicating bullish momentum. The 14-day relative strength index of 52 shows that ICP is no longer within the oversold region.

At press time, ICP is trading at $8.29 per coin. If the rally continues, ICP could move past the $9.14 resistance level before the end of the day. 

However, it would need the support of the broader crypto market to reach the $10 mark in the short term. 

The post Why is ICP up by more than 9% today? appeared first on CoinJournal.

Bitcoin dips below $30k despite the market recovery

The cryptocurrency market is recovering from the slump it suffered over the past two days.

The cryptocurrency market is trading in the green zone after underperforming over the last two days. The market has added more than 1% to its value in the last 24 hours, but the total market cap remains below $1.3 trillion.

Solana’s poor performance has affected the broader market as the network experienced yet another downtime two days ago.

Bitcoin, the world’s largest cryptocurrency by market cap, maintains its position despite dropping below the $30k mark once again.

The world’s leading cryptocurrency is up by less than 1% over the last 24 hours and currently trades above $29,900 per coin. 

Bitcoin’s total market cap is down to the $570 billion level. This means that Bitcoin has lost more than 50% of its value in the last seven months since hitting an all-time high of $69k in November 2021. At the time, the total cryptocurrency market cap was above $1.1 trillion.

Key levels to watch

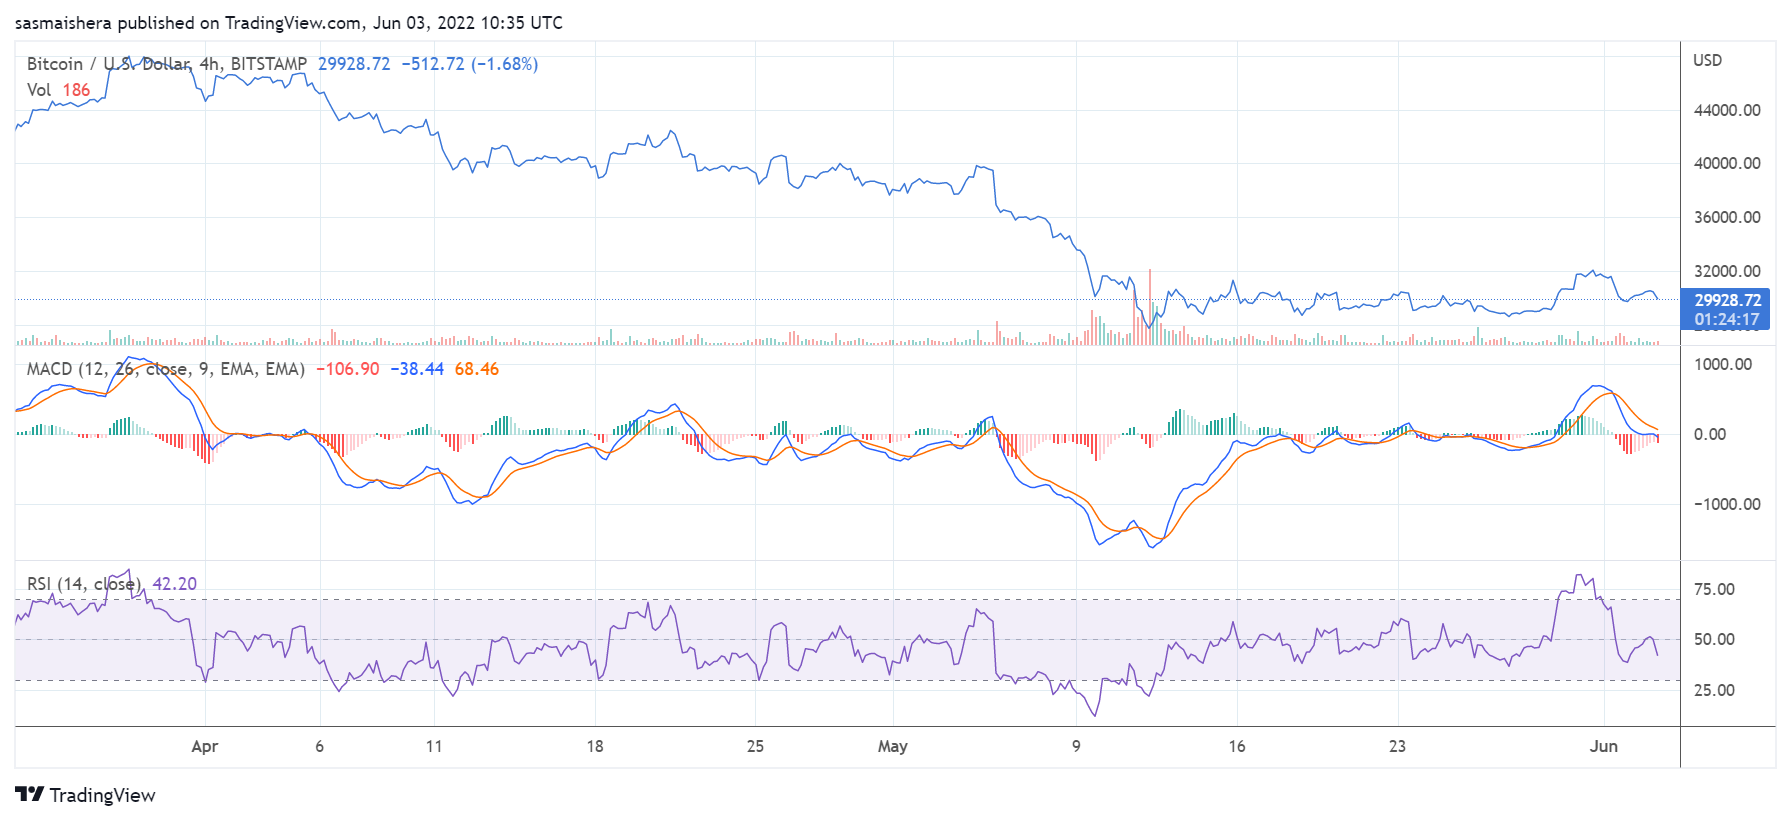
The BTC/USD 4-hour chart is currently bearish despite Bitcoin currently trading in the green zone. The technical indicators show that Bitcoin has been underperforming in recent days.

The 14-day relative strength index of 42 shows that Bitcoin could enter the oversold region if the bulls don’t push its price higher. The MACD line is just below the neutral line, indicating slight bearish momentum. 

If the bulls regain further control of the market, Bitcoin could comfortably move past the major resistance level at $30,500. BTC has found it hard to stay above the $32k resistance level, and that could remain the case heading into the weekend.

In the event that the bears regain control, BTC could struggle to defend its position above the first support level at $28,750 over the next few hours or days. 

The post Bitcoin dips below $30k despite the market recovery appeared first on CoinJournal.

Here is why Solana is down by 10% today

The cryptocurrency market has performed poorly for the second consecutive day this week.

The cryptocurrency market has underperformed over the past 24 hours. The market has lost nearly 5% of its value during that period, with the total market cap now below $1.3 trillion.

Bitcoin maintains its price above $30k despite losing 4.5% of its value in the last 24 hours. Ether is trading below $1,900 once again, down by 7% over the past few hours.

SOL, the native token of the Solana ecosystem, is the worst performer amongst the top 10 cryptocurrencies by market cap today. SOL is down by 10% over the last 24 hours.

SOL has been underperforming since the Solana network was halted yesterday. Solana’s validators were not able to process new blocks for the last five hours, causing a total shutdown of all Solana applications.

The downtime was caused by a bug that affected how the Solana blockchain processes a niche type of transaction that’s designed for offline use cases. The Solana network has recorded a few outages over the past year. 

Key levels to watch

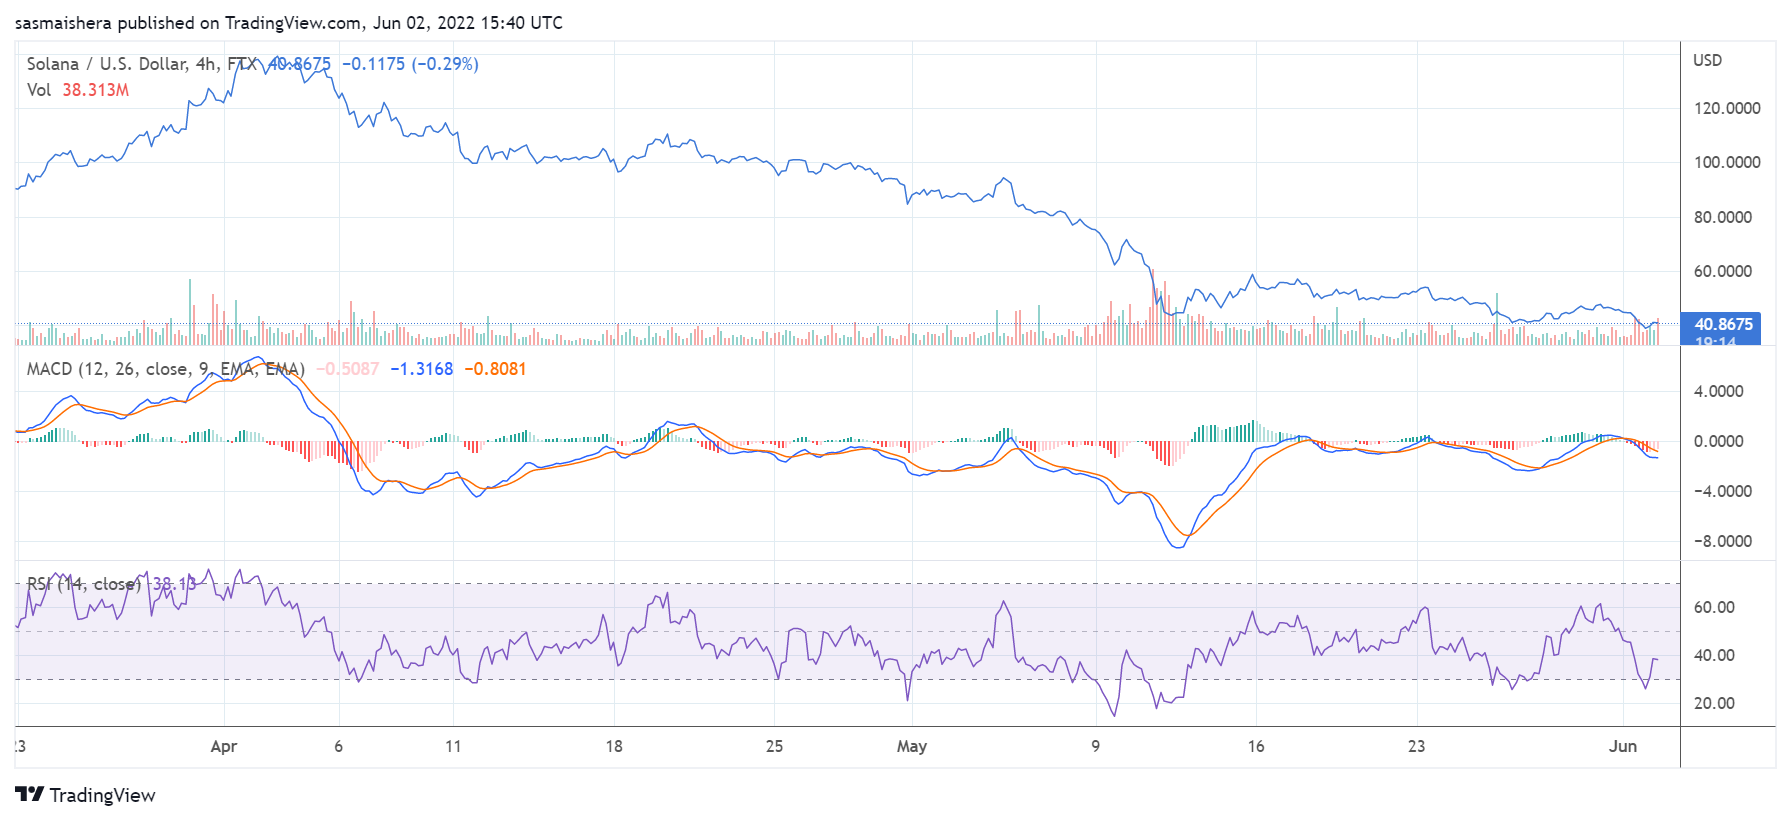
The SOL/USD 4-hour chart is bearish as Solana has been underperforming over the past few days. The technical indicators show that Solana is currently in bearish momentum.

The MACD line is below the neutral zone, indicating negative performance. The 14-day RSI of 38 shows that Solana is currently oversold. 

At press time, SOL is trading at $40.9 per coin. If the bearish sentiment thickens, SOL could drop below the first major resistance level at $37 before the end of the day.

An extended negative performance could see Solana trade below the $35 mark for the first time this year. 

The post Here is why Solana is down by 10% today appeared first on CoinJournal.

GMT price prediction for June 2022. Will Stepn recover?

The GMT price has been in a spectacular downfall in the past few weeks as demand for the coin has evaporated. Stepn’s native token has seen its price fall by more than 76% from its highest level in May, bringing its total market cap to about $621 million. At its peak, it was valued at more than $1 billion.

Why has GMT crashed?

Move-to-earn is a relatively new industry that is changing the NFT, gaming, and exercise industries around the world. Its concept was made popular by SweatCoin, a platform that has more than 30 million users from around the world. 

The concept behind Stepn is relatively easy to understand. First, the developers have created mobile applications that anyone can install in their smartphones. The developers will use the phone’s GPS tool to validate that a person has walked or run.

Second, the developers have come up with an innovative way to make people buy sneakers in the form of NFTs. Therefore, people are able to earn virtual currency that they can convert into cash within a few minutes. 

Learn more about how to invest in crypto.

Stepn’s ecosystem has been in strong growth in the past few months. It has over 560k users from around the world. The platform makes money by taking a commission when people mint NFT tokens in its ecosystem. Also, it takes a cut when NFT trading happens.

Stepn has two cryptocurrencies. Green Metaverse Token (GMT) is the governance coin while Green Satoshi Token (GST) is the utility token. GMT has an unlimited supply while GST has a supply cap of 6 billion tokens.

The GMT price crashed hard in May after the developers decided to deactivate the GPS from China, the most populous country globally. They blamed restrictive regulations for the situation. This explains why the coin has struggled to recover since then. 

GMT price prediction

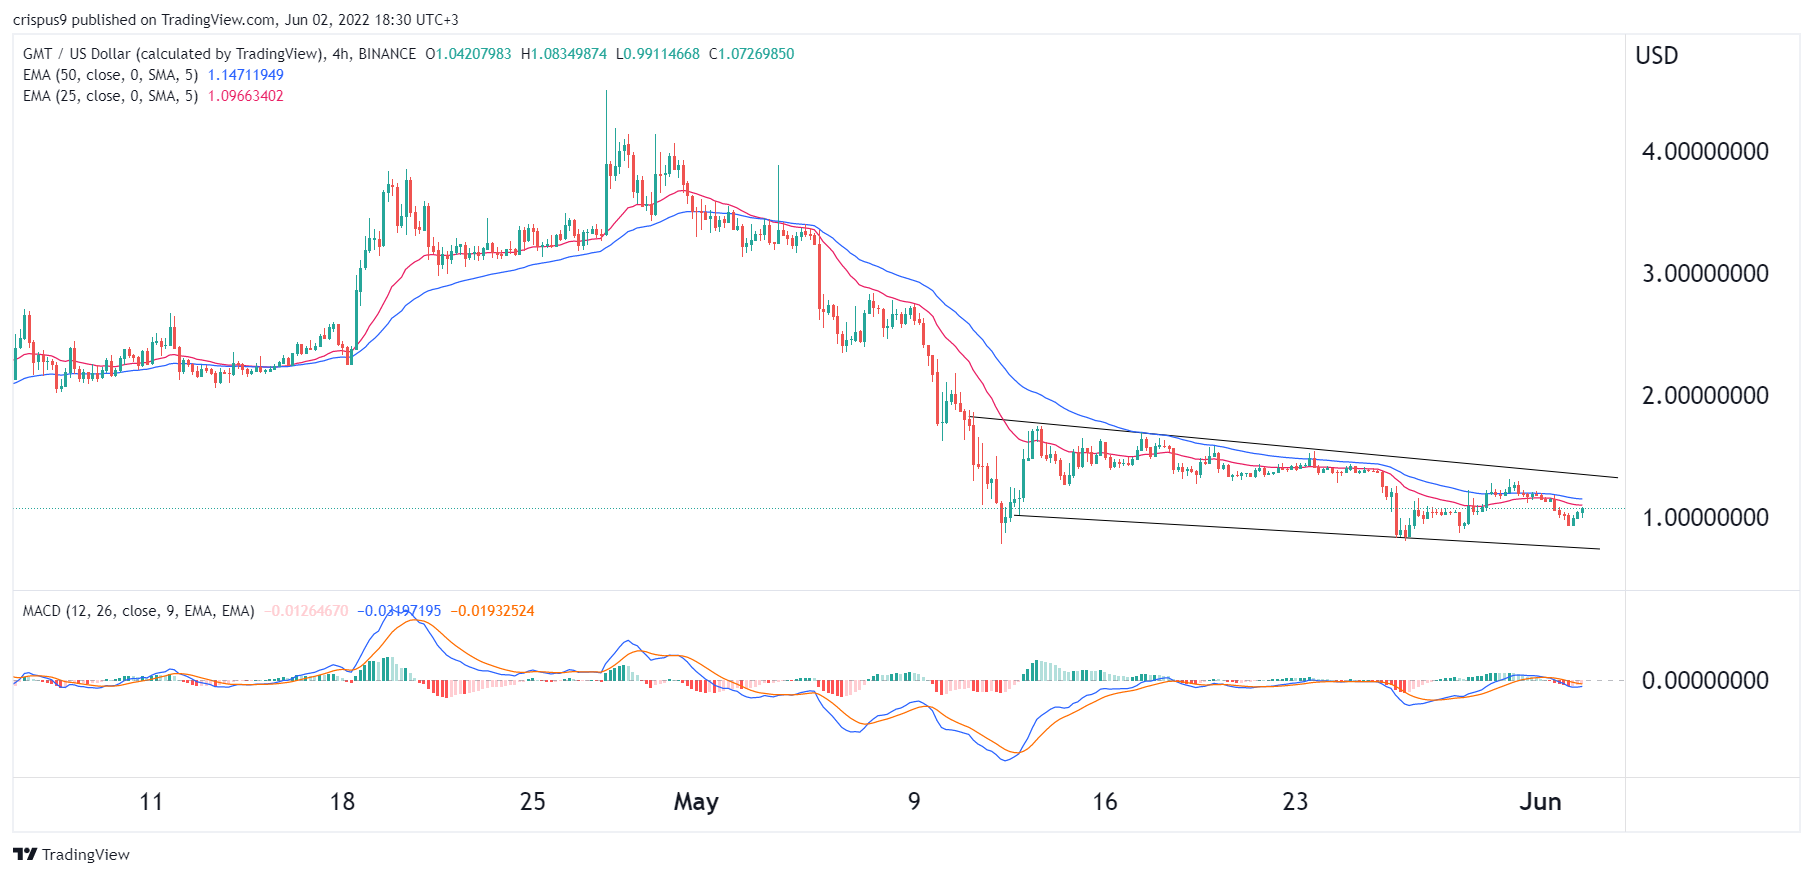
The four-hour chart shows that the GMT price has been in a strong bearish trend in the past few weeks. It has formed a descending channel that is shown in black. Also, it is consolidating along the 25-day and 50-day moving averages while the MACD indicator is below the neutral level. 

The coin will therefore continue falling as bears target the next key support level at $0.73, which is the lower side of the descending channel. On the other hand, a move above the upper side of the channel at $1.3725 will signal that buyers have prevailed.

The post GMT price prediction for June 2022. Will Stepn recover? appeared first on CoinJournal.