Near Protocol price prediction: cup and handle pattern forms

The Near Protocol price has been in a tight range in the past few days even as other cryptocurrency prices retreat. The coin is trading at $16.6, which is a few points below last week’s high of $20. Its market cap has risen to about $10 billion, making it the 17th biggest coin in the world.

Near plans to disrupt music industry

The Near Protocol price jumped sharply last week after the developers raised $350 million from a group of investors. The developers will use these funds to grow the ecosystem by providing grants to creators. They will also use the funds to expand their development team.

Therefore, the Near price jumped sharply as investors cheered this funding. Also, investors have been optimistic about the growth of its ecosystem. For example, the total value locked (TVL) of the network has risen to almost $1 billion. This growth is mostly because of the numerous projects built using Aurora’s technology.

Meanwhile, the developers announced plans to use the blockchain technology to disrupt the music streaming industry. They also unveiled a new decentralized autonomous organization (DAO) known as MODA DAO. The goal is to ensure that the musicians make money when people listen to their songs. It will also help them monetize their creations using tools like NFTs.

Near Protocol also talked about Naer x Music (NxM), which is a community focused on music, events, NFTs, and music-forward tools. The statement added:

“Music specifically tends to involve multiple participants to make a release come together. But by using smart contracts, especially with the tools built into Mintbase, artists are able to write splits into their contracts for both initial and secondary market sales.”

Near Protocol price prediction

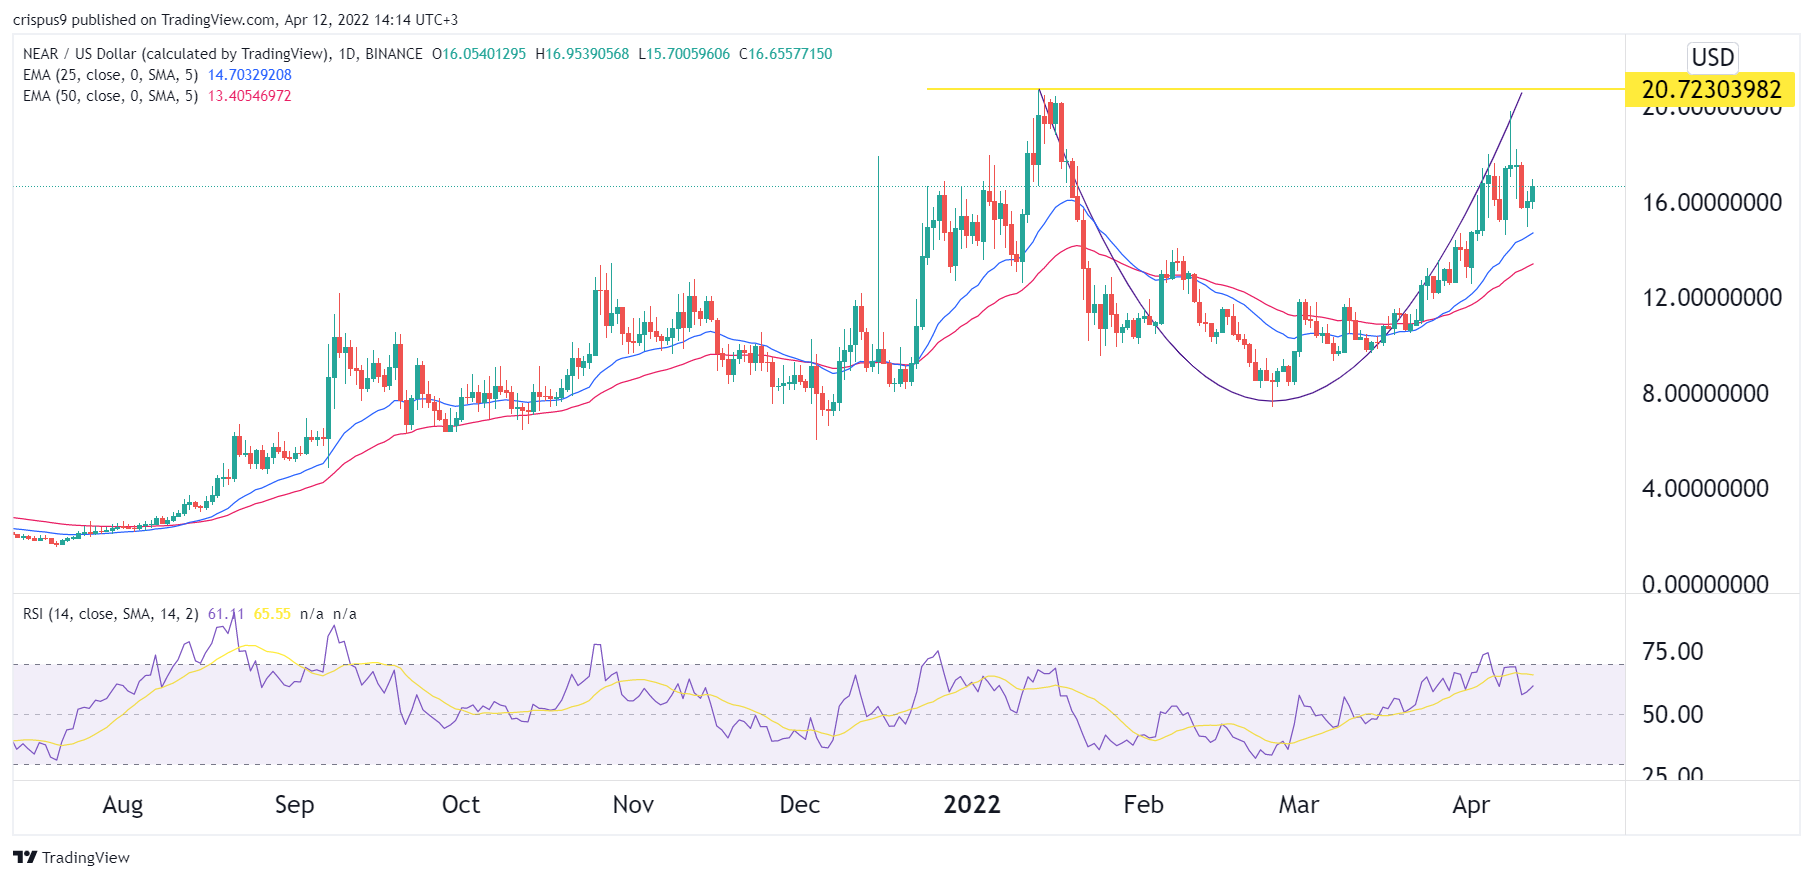
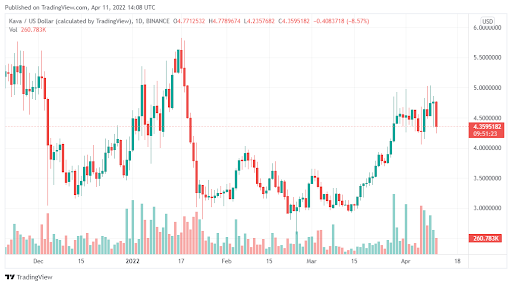
Turning to the daily chart, we see that the Near Protocol price has been in a strong bullish trend. A closer look reveals that it has formed a cup and handle pattern. In price action analysis, this price is usually a sign of a bullish continuation. It is also slightly below the upper side of the cup pattern.

The price has also moved above the 25-day and 50-day moving averages. Therefore, the coin will likely keep rising as bulls target the key resistance at $20.

The post Near Protocol price prediction: cup and handle pattern forms appeared first on Coin Journal.

Bitcoin briefly declines below $40k. Will it drop towards $35k soon?

The broader cryptocurrency market has been underperforming over the past few days.

The cryptocurrency market has been underperforming since the start of the week. In the last 24 hours, the total cryptocurrency market has lost more than 4% of its value, resulting in the total market cap dropping below $1.9 trillion.

Bitcoin remains the leading cryptocurrency by market cap but continues to suffer due to the bearish sentiment currently at play. Over the last 24 hours, Bitcoin has lost more than 5% of its value. 

At press time, Bitcoin is trading at $40,171 after briefly declining below the $40k support level a few hours ago. In the past seven days, Bitcoin has lost more than 13% of its value, effectively erasing the gains it had accumulated late last month.

Bitcoin was previously trading around $45k, and the bullish momentum meant it could challenge the $50k psychological level. However, with the current market trend, Bitcoin could struggle to defend its position above $35k over the coming days or weeks.

Key levels to watch

The BTC/USD 4-hour chart is currently bearish as Bitcoin continues to underperform. The technical indicators also show that it is one of the worst performers amongst the top 10 cryptocurrencies by market cap.

The MACD line has dropped below the neutral zone, indicating strong bearish momentum for Bitcoin at the moment.

The 14-day relative strength index of 31 shows that Bitcoin is currently in the oversold region.

If the bearish momentum persists, Bitcoin could drop below the first major support price at $38,886 before the end of the day. However, it should defend its position above the second major support level at $37,528 in the short term.

However, if the bullish momentum returns, Bitcoin could trade above the $42k resistance level over the coming hours. It would need the support of the broader market to reach the $44k level again over the coming hours or days. 

The post Bitcoin briefly declines below $40k. Will it drop towards $35k soon? appeared first on Coin Journal.

Dogecoin (DOGE) breaks 100-day SMA – Is a bull run on the way?

Dogecoin (DOGE) may have seen a major boost after Elon Musk floated the idea of bringing it into the Twitter payments ecosystem. The meme coin even surged by around 8% after the news, but it has since fallen sharply from that pump. But what does the future hold? Here are some developments of note:

  • After the initial Elon pump, DOGE fell by almost 16% in 24 hours

  • The coin did however manage to remain above its 100-day SMA

  • Musk’s statements are unlikely to have any material effect on the price action

Data Source: Tradingview 

Dogecoin (DOGE) -Why Musk’s pump won’t save it?

Elon Musk is one of the most influential voices in crypto and tech. When he floated the idea that Dogecoin could be included as part of the Twitter payments ecosystem, the price surged. Musk is after all the largest shareholder of Twitter. But it turns out this pump was short-lived as investors confronted the technical indicators. 

As a result, DOGE fell by almost 16%. But crucially, the coin has managed to stay well above its 100-day SMA of $0.13. This level has proved to be strong support, and it is unlikely DOGE will breach it. 

Once the coin consolidates around this price, we expect bulls to push further towards the 200-day SMA. While we don’t think it’s possible to breach the 200 Day SMA in the near term, a short bull run could still be a great win for bulls.

Does DOGE have a future in payments?

DOGE was the most successful meme coin before Shiba Inu. Over the years, the coin has tried to add more utility to its ecosystem and in fact, many have explored it as a possible payment option. 

If indeed Twitter is able to adopt it within its payment ecosystem, then DOGE will easily become a mainstream coin with vast implications for the digital economy.

The post Dogecoin (DOGE) breaks 100-day SMA – Is a bull run on the way? appeared first on Coin Journal.

Red Monday for Bitcoin as $114 million liquidated, but on-chain data remains stout

Mondays are difficult at the best of times. For Bitcoin investors, however, this is a particularly tough one. The cryptocurrency wicked viciously downward, now testing support of $40,000 after trading at $43,000 less than 24 hours ago.

Personally, living in a GMT -6 timezone, I slept through most of the madness, as the above chart shows. Waking up to see those red candles on your screen is something that, for better or worse, is part of the Bitcoin rollercoaster.

Liquidations

On the bright side, it does appear that this pullback is via overleveraged longs, with cascading liquidations flushing out the overexposed. In fact, in a thirty minute period at around 5-5:30 AM EST this morning, there was circa $30 million in long liquidations of Bitcoin (somehow, there was also half a million short liquidations – that’s almost impressive). The price (yellow line in graph below) cratered from $42,200 to $41,300 in short order, as the liquidations ran rampant shown by the green bar on the below graph.

In 24 hours, there have been $114 million in liquidations across all exchanges on Bitcoin alone. If we expand out to all cryptocurrenices, that figure is at $384 million. ETH liquidations are not far off Bitcoin, at $99 million over the last 24 hours. In third place is Luna, with $13 million, while Solana is at $10 million and Dogecoin at $7.6 million.

What Does it Mean?

I don’t think this is anything to be overly concerned about. When looking on-chain, data is still very bullish, with long-time holders are accumulating. The amount of bitcoins that hasn’t moved in over a year is at its second highest ever at 12 million bitcoins. In fact, the only other time it was this high was in September 2020, just before Bitcoin went parabolic, skyrocketing from $10,000 to $61,000 in six months.

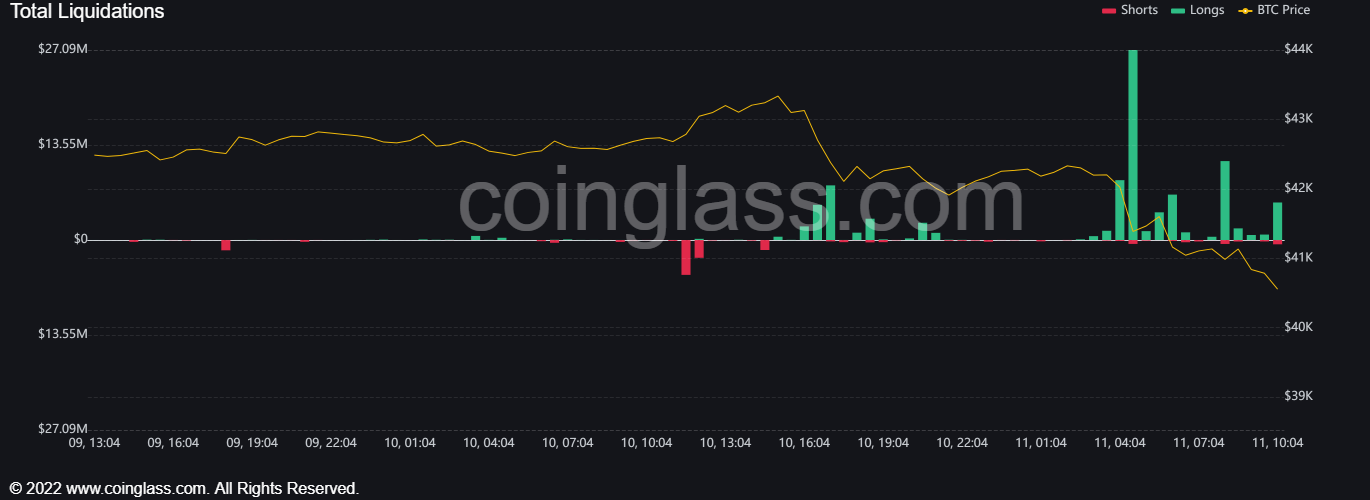
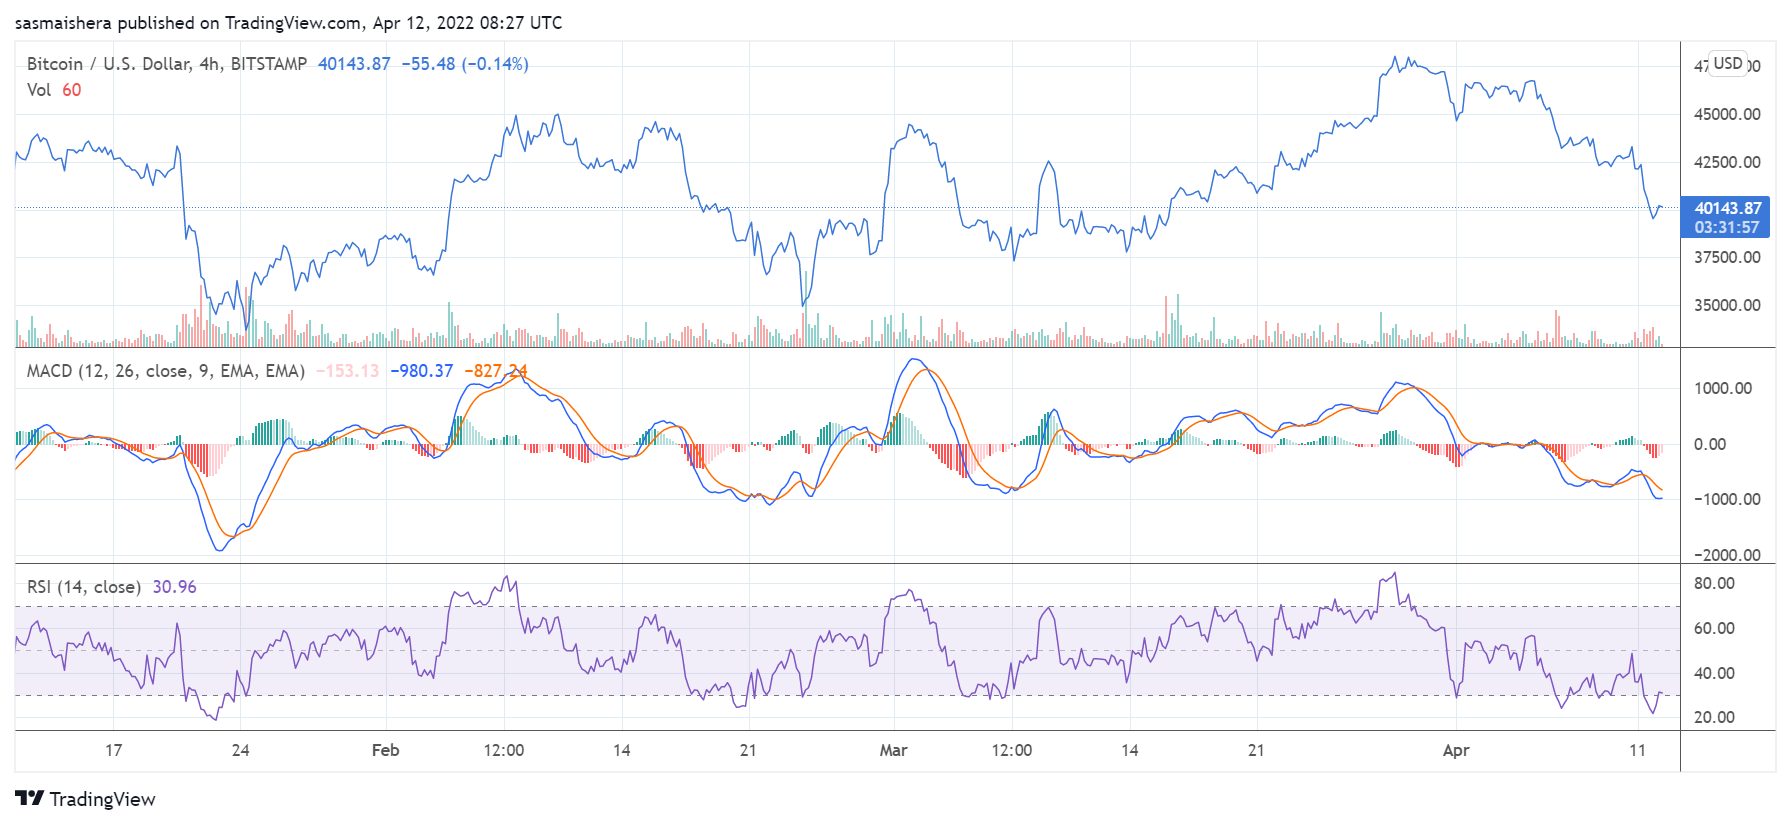
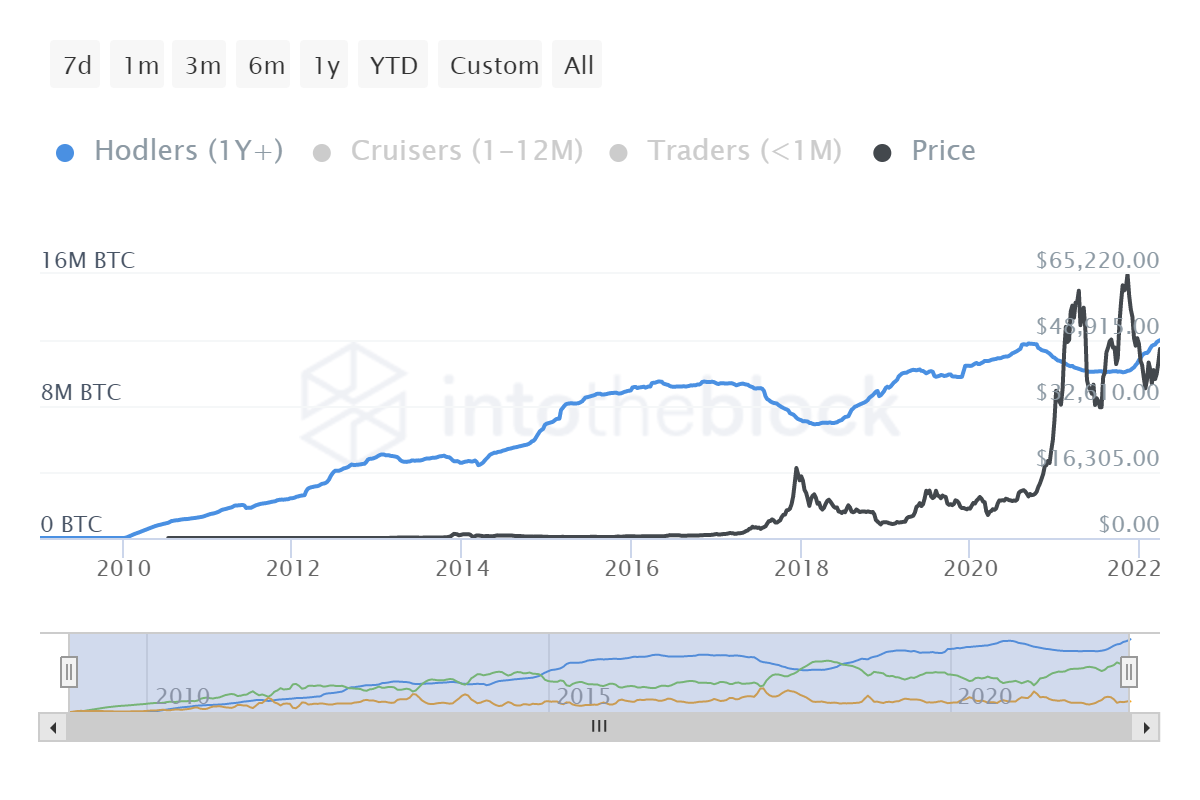
Long-term hodlers accumulating coins at a discount from short term hodlers is not something to panic about, especially when there is no significant movement in net flows to exchanges.

Bitcoin Dominance

The saying “it could always be worse” normally holds true. Unless, that is, you are an alt coin investor when there is blood in the crypto markets. Because as tends to be the case when Bitcoin is in a bad mood, alt coins are significantly worse, as the below 5-day graph for Bitcoin dominance from TradingView shows.

While alts have rebounded somewhat in the last couple of hours, many are still a lot further off than Bitcoin.

Conclusion

To wrap up, on-chain metrics remain bullish, suggesting this is just a flushing out of the leverage that we see every now and then. Hodlers have been collecting some coins at a discount from traders, who have been liquidated en masse. There is no reason to believe right now that critical support has been broken, or the market structure has changed fundamentally.

Keep hodling, zoom out and relax – it’s not going to be one of those really bad days, I don’t think.

The post Red Monday for Bitcoin as $114 million liquidated, but on-chain data remains stout appeared first on Coin Journal.

Kava (KAVA) bulls to target $6.68 even though the coin has slowed from the recent rally

Kava (KAVA) appears to be showing several bullish signals. This comes even as the coin falls sharply from its recent rally. KAVA is currently looking to consolidate before its next bull run, and this could come sooner than you think. Here are the latest developments:

  • KAVA could surge towards $6.68 in the upcoming bull run

  • The coin is trading above a crucial support zone of $4.13.

  • KAVA is relatively closer to its ATH compared to other altcoins

Data Source: Tradingview 

Kava (KAVA) – Can it hit $6.68

Unlike most altcoins in the market, KAVA has remained very resilient to recent market pressures. For instance, while most altcoins have fallen nearly 90% from their all-time highs, KAVA has done much better, trading about 45% lower than its ATH.

The coin is in a consolidation phase right now. If bulls hold the crucial support of $4.13, we are likely to see a bullish breakout in the near term that takes KAVA closer to the $6.68 mark. KAVA has also bounced back sharply from its 2022 lows. After tanking to around $2.55 in February, the coin has surged over 100% ever since.

We expect this bullish momentum to continue in the near term. KAVA is likely to soar past $5 in the days ahead before consolidating again and testing the $6.68 mark. If this happens, the coin will deliver gains of up to 55% from its current price.

Should you buy Kava?

Well, KAVA looks primed for a decent run in the weeks ahead. This would be the most ideal time to accumulate the coin. However, watch it for a few days.

If bulls are still able to keep the $4.13 support, then you can enter. Exit points should be around $5 and the $6 mark. As for the long-term investor, KAVA holds incredible fundamentals and should be a good addition to your portfolio.

The post Kava (KAVA) bulls to target $6.68 even though the coin has slowed from the recent rally appeared first on Coin Journal.