CRV price prediction as Curve DAO unveils stablecoin plans

The CRV price has been in a strong bullish trend in the past few days. Curve rally accelerated after the network announced that it will launch a new stablecoin. It rose to a high of $1.45, which was the highest point since May 31st of this year. It has risen by more than 157% above the lowest level this year, bringing its total market cap to over $569 million.

Curve DAO to launch a stablecoin

The CRV price has been in a strong bullish momentum in the past few days as investors move to blue-chip DeFi tokens. The thinking is that these platforms have gone through a major stress test with the recent crash of cryptocurrencies and the implosion of major platforms like Terra and Three Arrows Capital.

Another theory is that the leading DeFi players like Aave, Uniswap, and Lido will thrive just as companies like Google and Yahoo thrived after the dot com bubble. 

Curve DAO price is soaring after the developers announced that they will launch a new stablecoin that will help to facilitate payments in the ecosystem. The stablecoin will be significantly different from the popular ones like Tether and USD Coin. 

The difference is that it will not be backed by anything like the US dollar or gold. Instead, it will be an over-collateralized coin like Tron’s USDD. These coins are usually backed by volatile assets like Bitcoin and other cryptocurrencies.

Curve DAO’s stablecoin launch comes at a time when many other decentralised platforms are launching their own coins. Maker was among the first ones to launch its token when it launched Dai. Tron recently launched USDD that has a market cap of over $700 million while Near Protocol has USN. 

The risk for these algorithmic coins is that they could easily lose their peg when volatility surges. In addition to Terra UST, other coins that lost their peg are Dei and Neutrino.

CRV price prediction
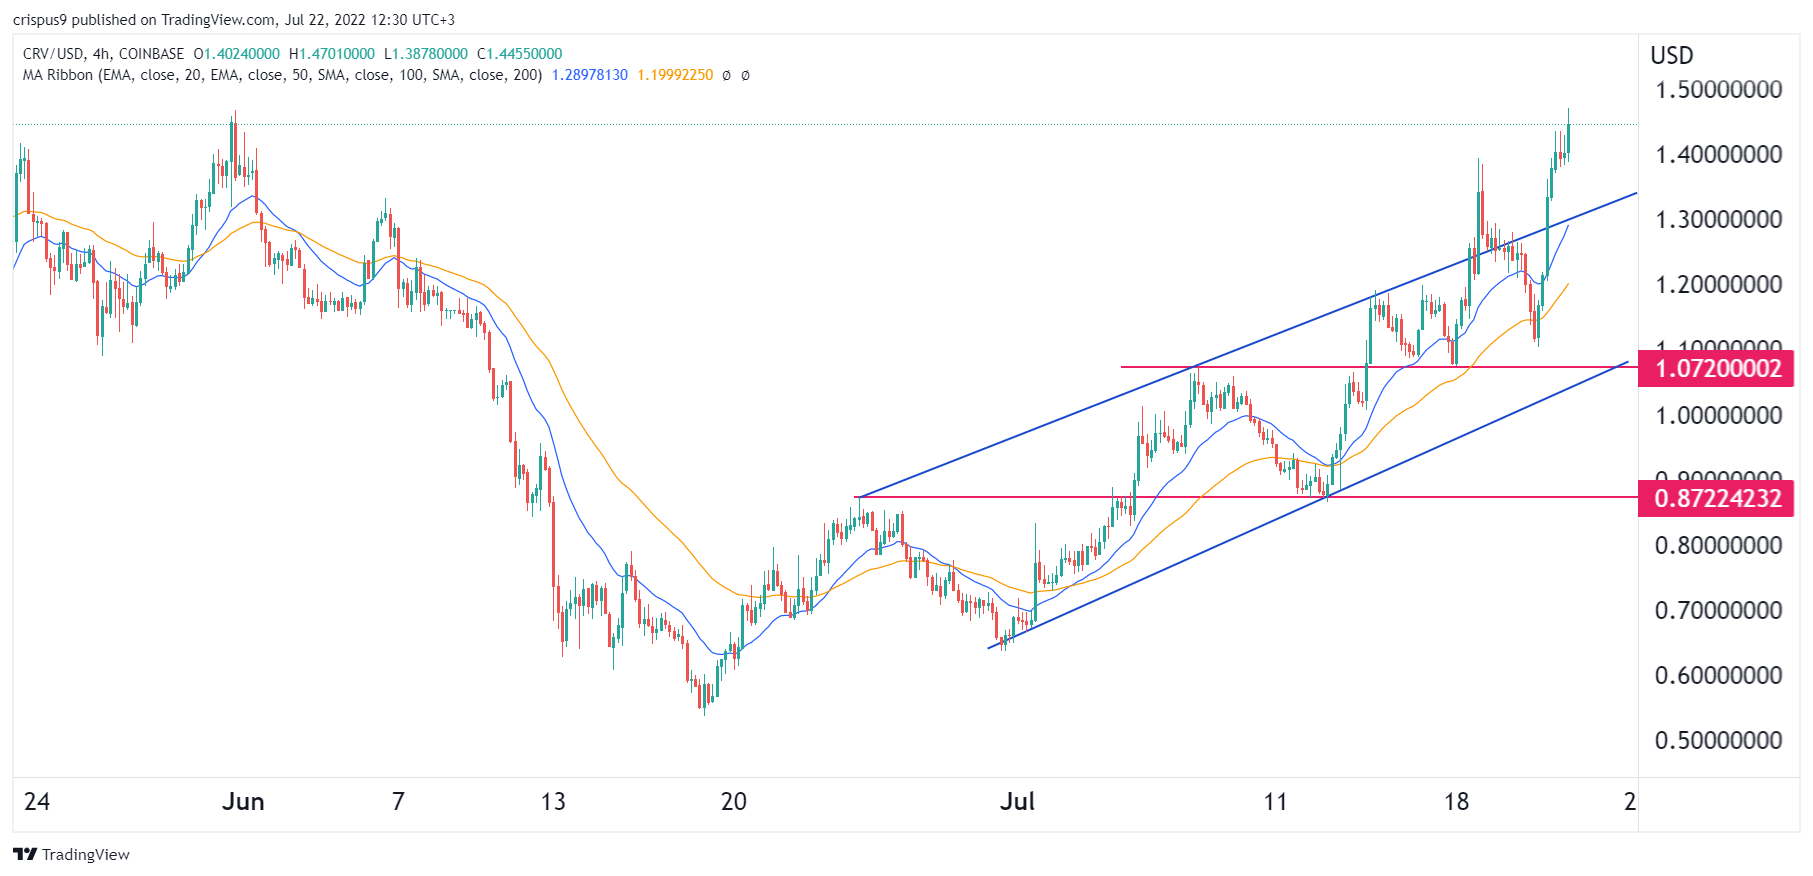
The four-hour chart shows that the Curve DAO price has been in a strong bullish trend in the past few weeks. As it rose, it managed to move above the upper side of the ascending channel pattern that is shown in blue. 

The coin also rose above the 25-day and 50-day moving averages while the Relative Strength Index and the MACD have continued rising. 

Therefore, the coin will likely continue rising as bulls target the next key resistance at $1.5. After hitting this psychological level, the coin will likely pull back and retest the upper side of the channel. 

The post CRV price prediction as Curve DAO unveils stablecoin plans appeared first on CoinJournal.
Watch these levels as XRP fails at resistance that has been holding price

  • XRP corrects 5% after a week of gains

  • Ripple continues to enjoy positive developments on the case with SEC

  • XRP could continue to correct until it finds support at $0.33

Ripple’s XRP/USD is recovering, but sustainable gains depend on a key resistance. As of press time, XRP was down 5% in 24 hours as bulls failed to inspire a breakout of $38. The token fell alongside other cryptocurrencies. The decline can be said to be a correction after the market was bullish for a week. 

Revising the SEC case, Ripple remains right on track, although the outcome remains uncertain. On July 12, a US court rejected SEC’s call to withhold some documents against Ripple. The documents, which relate to 2018’s so-called Hinman speech, could have influenced proceedings. Either way, courts continuously siding with Ripple is positive. It suggests that things are progressing well for the firm. The markets are warming up for the outcome of the case that could shape XRP’s price.

As of the moment, XRP remains among the top cryptocurrencies despite the uncertainty. At position 7 by market cap, it is above Cardano and Solana. The latest gains have been due to market sentiment, but XRP has a hurdle to clear at $38.

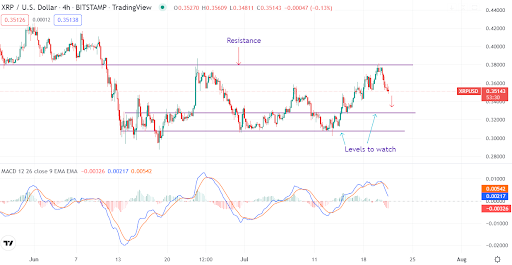
XRP corrects after rejection at key resistance

 Source – TradingView

Technical analysis indicates that XRP has been rejected again at the key resistance of $0.38. The MACD indicator has crossed below the moving average, suggesting a bearish momentum. Following the latest gains, investors could be taking profits. We expect the current correction to continue. XRP could settle at a support zone of $0.33. It could also slide to another support at $0.30. Investors should watch the two levels for price action and sentiment.

Summary

XRP has a short-term bearish momentum after getting rejected at $0.38. The cryptocurrency could settle at $0.33 or $0.30.

The post Watch these levels as XRP fails at resistance that has been holding price appeared first on CoinJournal.

Bearish MACD crossover makes Chainlink vulnerable to $6.0

Chain Link Image on a cell phone

  • LINK has lost 7% due to market correction

  • LINK’s recent rally is connected to broader crypto recoveries

  • Robinhood listing and entry into Fantom mainnet reinforces Chainlink fundamentals

Cryptocurrencies have been returning huge in the past week. As is expected, market corrections follow. The corrections open up new buy opportunities. That’s exactly what’s happening to Chainlink LINK/USD after losing 7% in a day. 

Chainlink’s LINK recovered successfully from the support of $6.0 as most cryptocurrencies gained. The gains could also be a result of investor interest after Chainlink was listed on Robinhood. 

Another development that could have influenced LINK’s rally is the entry to Fantom Mainnet. Fantom said that both Chainlink Keepers and Chainlink’s Verifiable Random Function went live on its mainnet. That proved that Chainlink was a reliable Oracle provider to smart contracts like Fantom.

LINK’s rally has now hit a snag, and it is important that investors understand the cycles for the token. The technical analysis below illustrates when LINK may rally next.

LINK stalls and corrects with $6.0 in sight

Source – TradingView

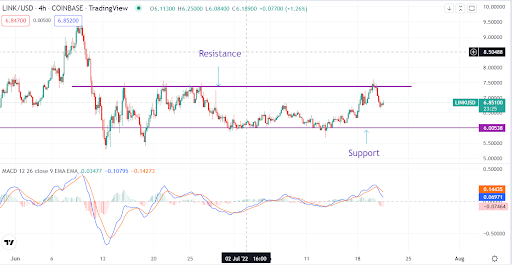
A technical outlook of LINK shows uniquely identifiable price patterns that can be useful to investors. The price has remained within the $6.0 and $7.3 range since the start of June. Keen investors would be good buying the support at $6.0 and selling at $7.3. 

As the price hits the resistance, investors can sell now and consider buying the retracement. The token is already under bear pressure as the MACD line crosses below the moving average. The next price in sight is $6.0, although that depends on the prevailing crypto sentiment.

Concluding thoughts

Chainlink’s LINK could continue to correct as technical indicators show. The buying zone is at $6.0, the established support. The established resistance to watch is $7.3. Investors should also watch for a potential breakout above $7.3 for sustained gains.

The post Bearish MACD crossover makes Chainlink vulnerable to $6.0 appeared first on CoinJournal.

Navcoin price has recovered recently. Is it a good coin to buy?

The Navcoin price has staged a strong recovery in the past few days as cryptocurrency prices rebound. The NAV token rose to a high of $0.1385, which was the highest level since May 17th. It has risen by more than 186% from its lowest level this year. As a result, its total market cap has jumped to over $10 million.

What is NAV and why is it rising?

Navcoin is a relatively small cryptocurrency that was started in 2014. The developers’ goal was to solve some of the challenges that Bitcoin has. Most importantly, they wanted to solve the privacy challenges that the coin had. 

Navcoin solves the challenge of privacy by ensuring that all transactions are highly private and that no one can track them. It uses a secondary sub-chain known as NavTech that enables transaction anonymization and mixing.

For example, when a person sends Navcoins, the funds first move to the sub chain, where they are tweaked before they get to the recipient. Navcoin was also among the first coins to implement a proof-of-stake consensus.

Navcoin’s developers have also created more features. In addition to the native NAV token, they have launched xNAV, which is a private currency created to protect information by hiding the sending and receiving addresses and amount. They also launched xNAV, which is a wrapped representation of NAV.

The Navcoin price has bounced back in line with the overall recovery of other cryptocurrencies. Indeed, Bitcoin has jumped to over $24,000 while Ether has moved to about $1,500. As a result, the total market cap of all coins has risen to over $1 trillion.

Navcoin has also jumped as investors cheer the strong performance of other privacy tokens. For example, Monero has jumped by more than 5% in the past 24 hours. The same is true with other coins like Dash and ZCash. 

Navcoin price prediction

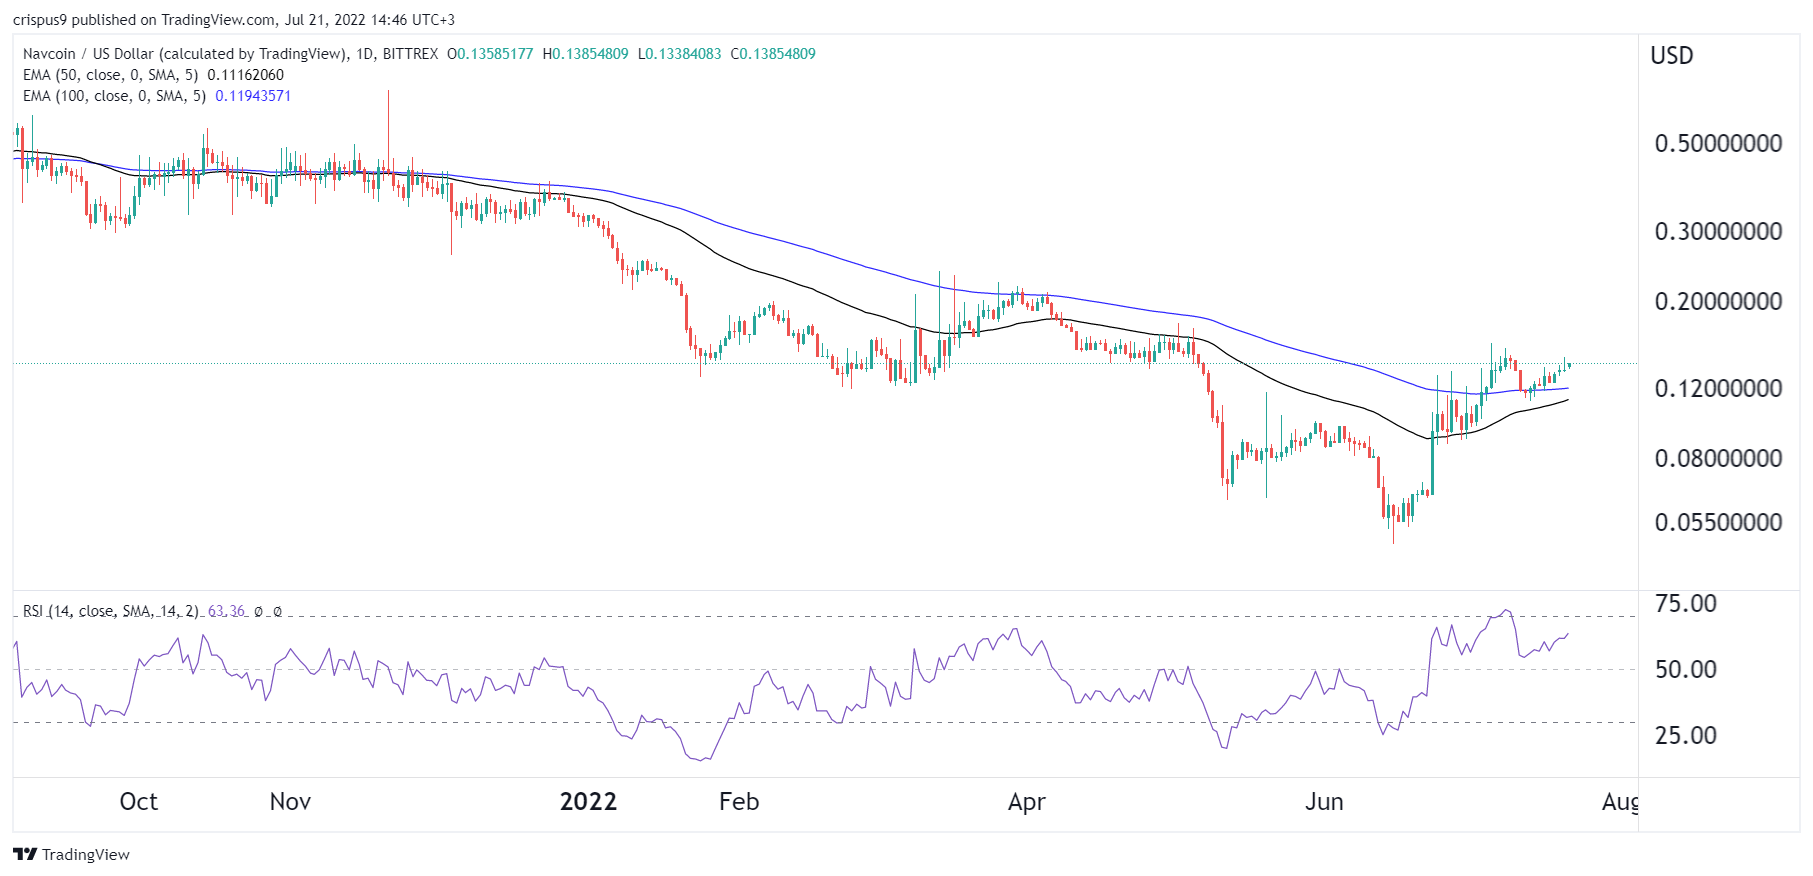
The daily chart shows that the NAV price has been in a strong bullish trend in the past few days. It has managed to move above the 25-day and 50-day moving averages while the Relative Strength Index (RSI) has moved close to the overbought level. 

Therefore, the coin will likely keep rising as bulls target the key resistance at $0.50. However, a drop below the support level at $0.106 will invalidate the bullish view.

The post Navcoin price has recovered recently. Is it a good coin to buy? appeared first on CoinJournal.

Ether slips by 5% as the broader crypto market retraces

The cryptocurrency market has cooled down after rallying over the past couple of days.

The cryptocurrency market is trading in the red zone for the first time in nearly a week. The market has lost more than 3% of its total value over the past 24 hours, but the total market cap remains above the $1 trillion mark.

Bitcoin climbed above the $23k resistance level on Wednesday but has lost 3.5% of its value since then. At press time, BTC is trading around $22,800 per coin.

Ether, the native coin of the Ethereum ecosystem, is one of the best performers over the past seven days. ETH has added more than 35% to its value over the last seven days, thanks to the announcement about Ethereum Merge. 

However, ETH is down by more than 5% over the last 24 hours and is currently trading below $1,500 per coin.

The market might resume its upward trend in the short term, and if that happens, Ether could rally higher soon.

Key levels to watch

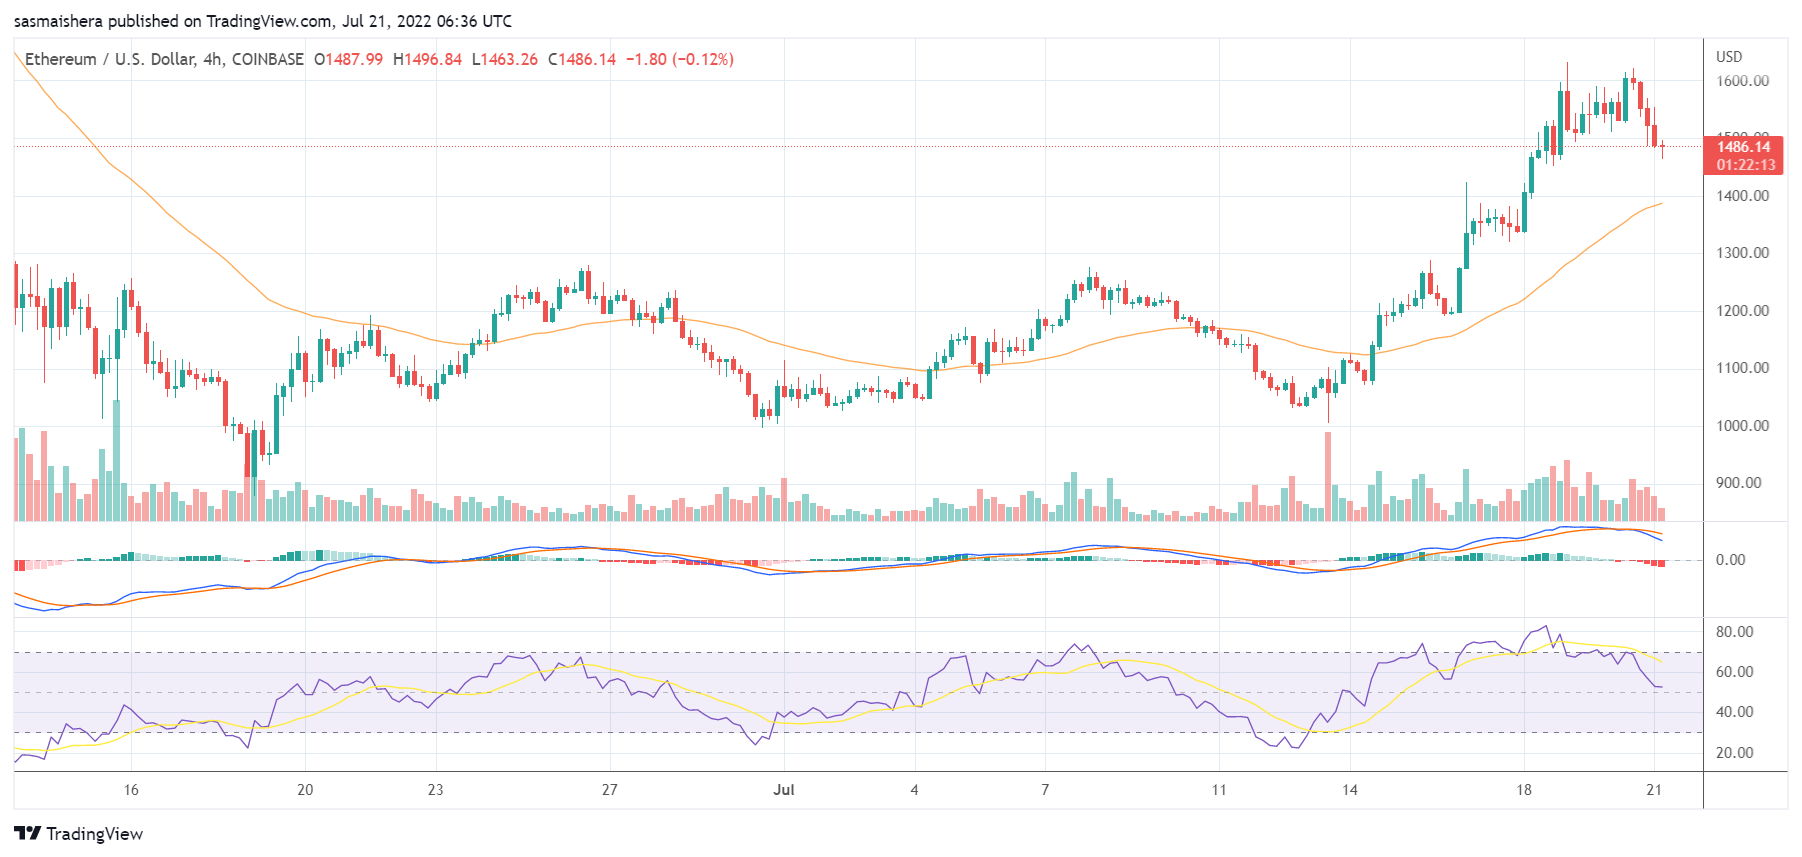
The ETH/USD 4-hour chart is still bullish despite Ether underperforming over the last 24 hours. The technical indicators show that Ether remains on a bullish path and could merely be retracing before surging higher.

The MACD line remains above the neutral zone, indicating bullish momentum. The MACD currently reads 80 and would take a long bearish performance to take it into the negative zone.

The 14-day relative strength index of 56 shows that ETH is no longer in the overbought region. The bulls will need to regain control to push it higher in the short term.

At press time, ETH is trading at $1,483 per coin. If the bearish trend continues, ETH could slip below the $1,382 support level. However, ETH should comfortably defend its position above the $1,300 support level.

If the bulls regain control, ETH could rally past yesterday’s top of $1,599 and trade above $1,600 for the first time in more than two months. 

The post Ether slips by 5% as the broader crypto market retraces appeared first on CoinJournal.