GMT price at risk as StepN monthly and daily users plunge

  • StepN is one of the biggest move-to-earn players in the industry.

  • The number of daily and monthly users has continued plunging.

GMT price has been in a steep sell-off in the past few weeks as concerns about the crypto industry and its utility remain. The Green Metaverse Token was trading at $0.40 on Thursday, which was lower than last month’s high of $0.6840. 

StepN statistics are disappointing

Move-to-earn is a technology that became popular in 2022 as companies like StepN and Sweatcoin became popular. It has merit considering that billions of people now own smartphones. Also, the blockchain technology has become popular.

However, on-chain data shows that StepN is not doing well at all. Data compiled by Dune Analytics shows that the network had just 42,965 users in February, down from the previous month’s 46,632. Unfortunately, the figure has been in a strong downward trend after it peaked at 705k in May last year.

Other figures are also not pleasing. For example, the number of daily active users in StepN has been falling after it peaked at over 100k last year. Now, the number of DAU has plunged to less than 6,000. New daily users have crashed to less than 300.

It is not clear why this has happened. A likely reason is that the hype surrounding StepN has just faded away. Another reason is that users are not motivated to use the platform because of the performance of the Green Satoshi Token (GST), which has plunged by more than 98% from the highest level on record.

This is a problem that most Web3 networks that pay their users using crypto go through. For example, many users of Brave browser have seen their Basic Attention Token (BAT) dwindle with the token down sharply from its all-time high.

GMT price prediction
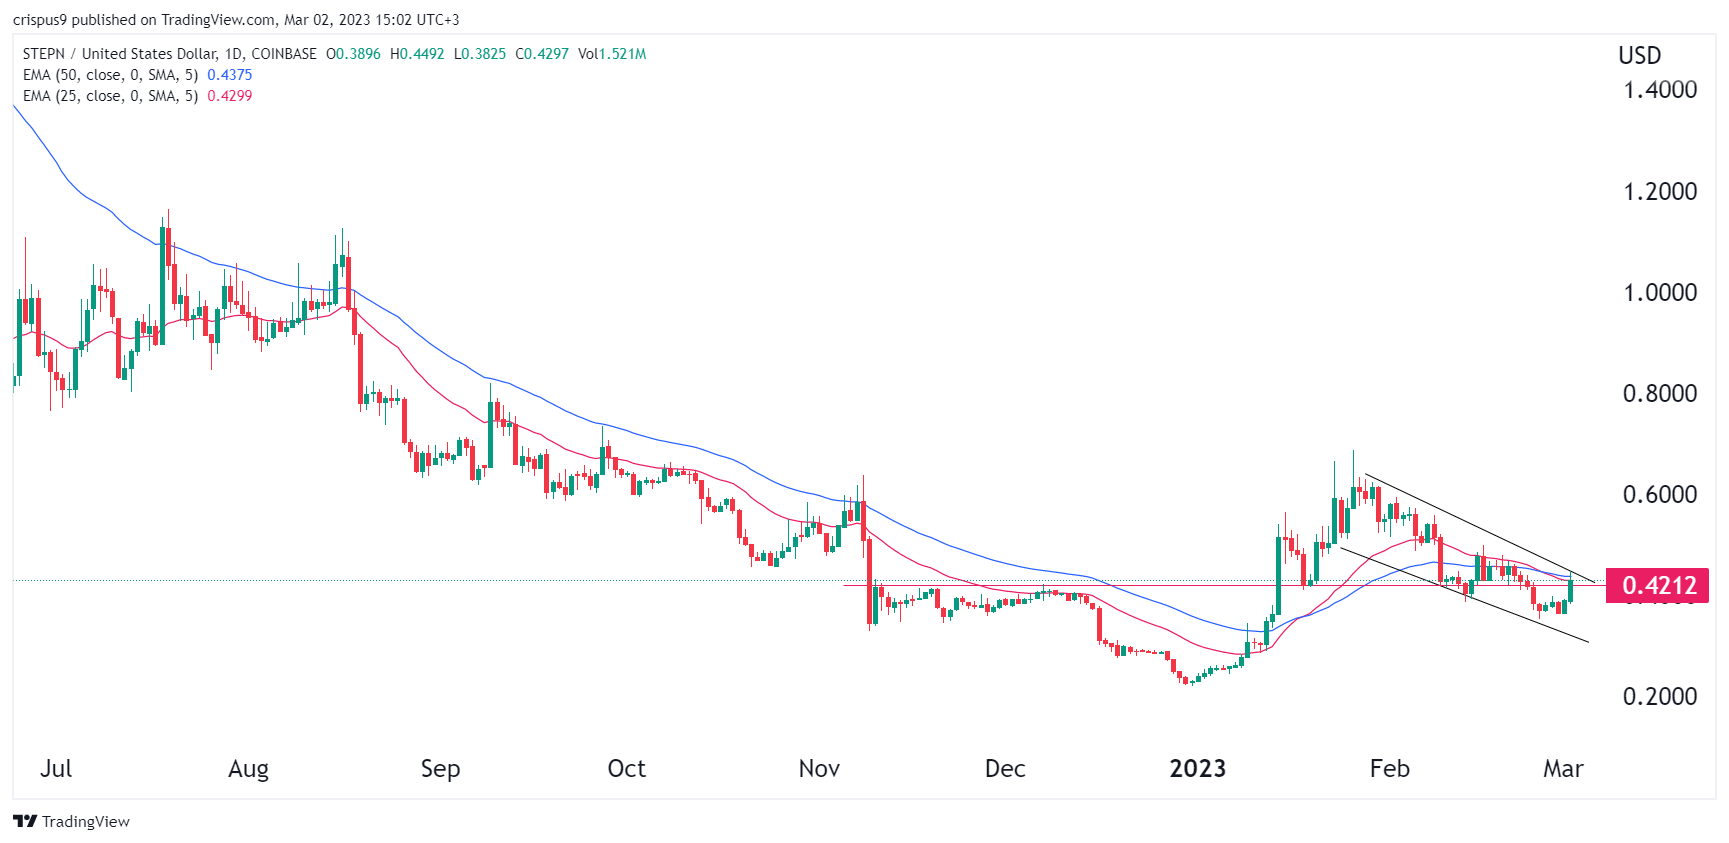
The daily chart shows that the GMT crypto price has been in a bearish trend in the past few days. Along the way, it has formed a descending channel shown in black. It has moved slightly below the 25-day and 50-day moving averages. The price is also slightly above the important support level at $0.4212, the highest point on December 7. 

This descending channel seems like a falling wedge. Therefore, while its ecosystem has some major issues, we can’t rule out a situation where the coin makes a bullish breakout. If this happens, the next level to watch will be at $0.60.

How to buy StepN

Binance

Binance is one of the largest cryptocurrency exchanges in the world. It is better suited to more experienced investors and it offers a large number of cryptocurrencies to choose from, at over 600. Binance is also known for having low trading fees and a multiple of trading options that its users can benefit from, such as; peer-to-peer trading, margin trading and spot trading.

Buy GMT with Binance today

KuCoin

Kucoin is a cryptocurrency exchange which offers over 200 cryptocurrencies. Kucoin has a wide range of services, such as; a built-in peer-to-peer exchange, spot and margin trading, bank level security and a wide range of accepted payment methods. Users can benefit from a beginner-friendly interface and relatively low fees.

Buy GMT with KuCoin today

The post GMT price at risk as StepN monthly and daily users plunge appeared first on CoinJournal.
Dogecoin needs to close above $0.1 for bullish momentum to continue

  • Dogecoin bulls need to wait for the price to move above $1 before going long
  • A contracting triangle contains the price action 
  • $0.6 support must hold

Dogecoin followed the bullish trend seen in the cryptocurrency market in 2023 and gained more than 50% before the recent correction started. But the spike in the first part of the year is nothing compared to the movement seen in late November.

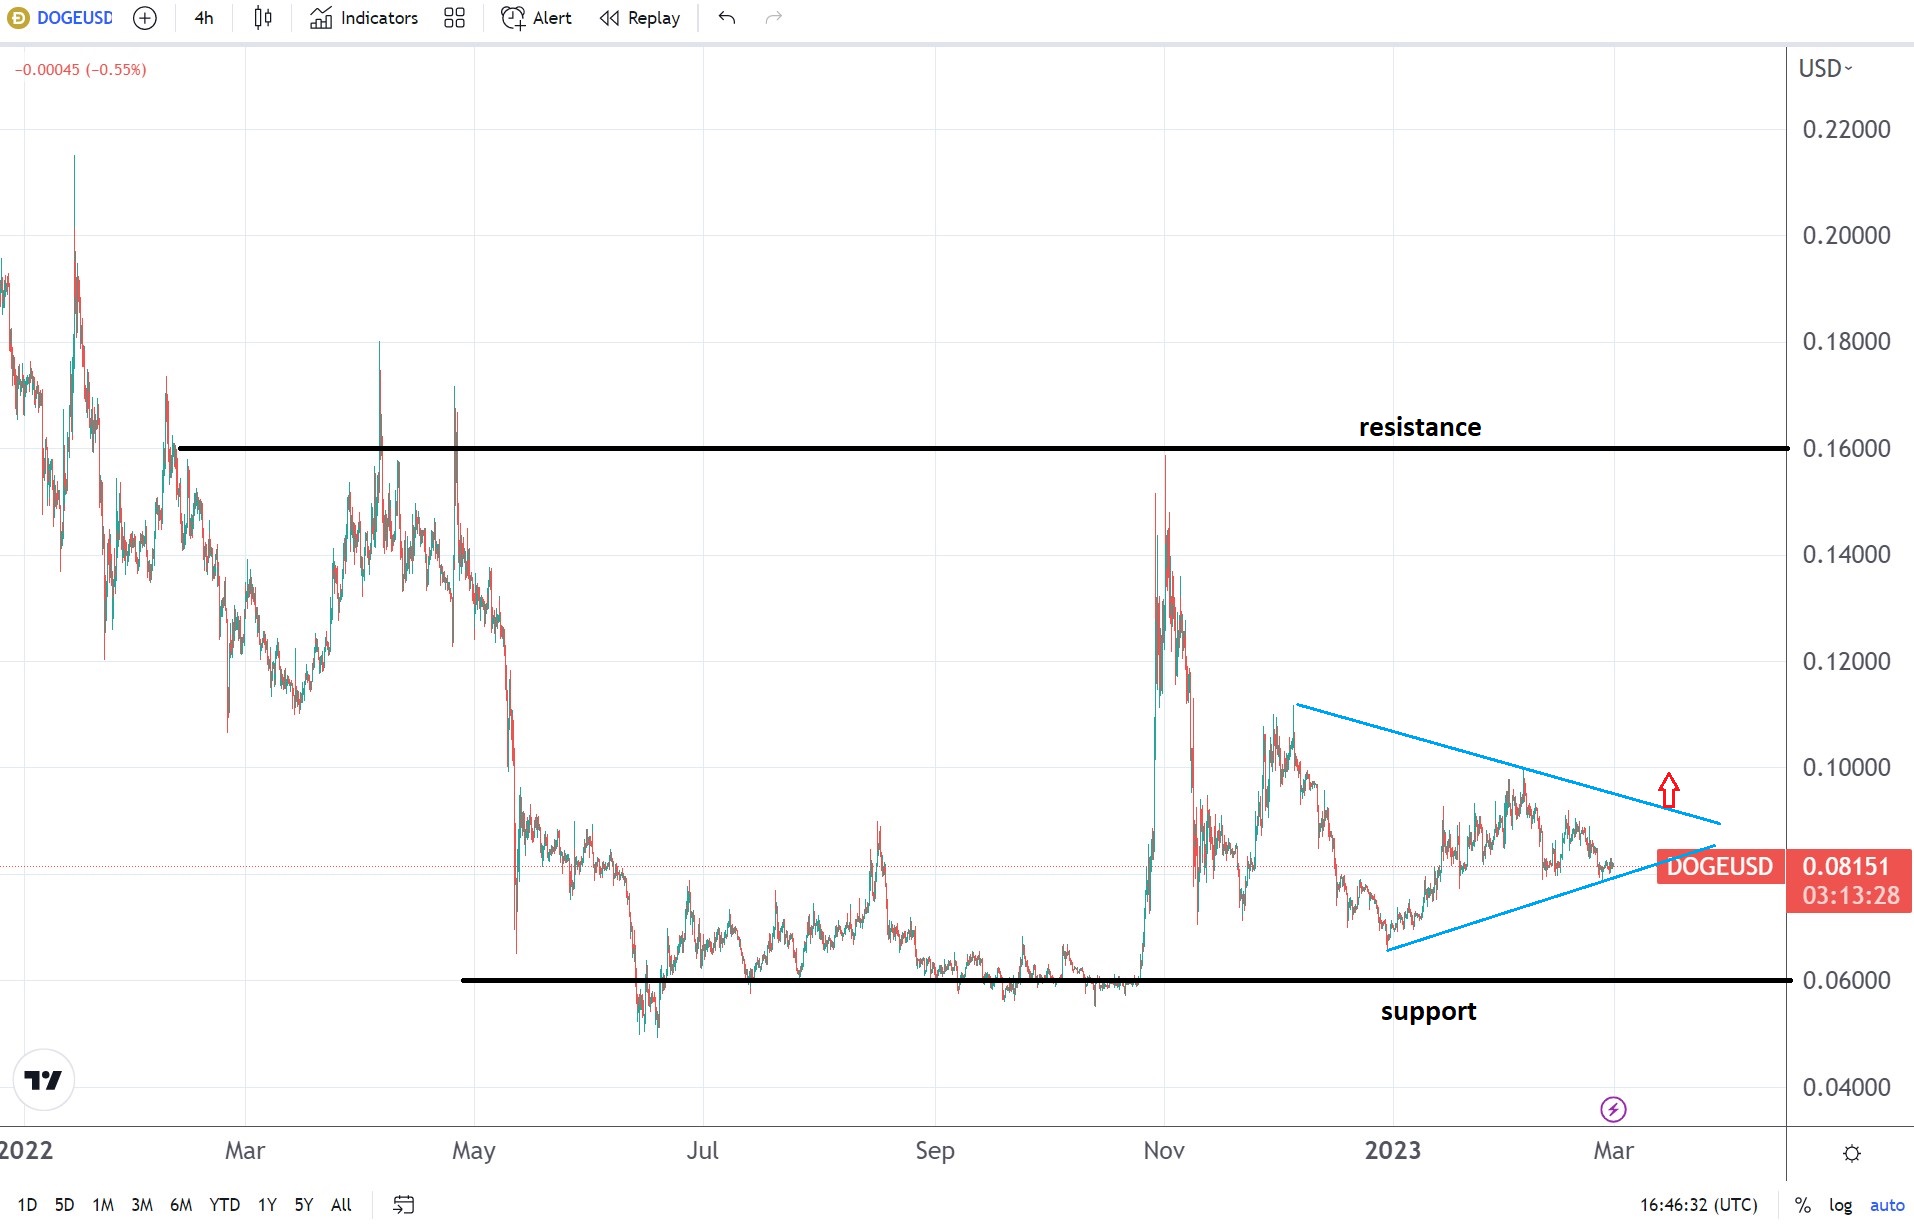
In fact, since then, Dogecoin has been unable to break the lower highs series, which puts a big question mark on its ability to rally. But bulls should be patient and wait for the market to move above $0.1, as it looks like a pivotal level for Dogecoin.

DOGEUSD chart by TradingView

A daily close above $0.1 opens the gates for more upside

A contracting triangle formed on the 4h timeframe, and Dogecoin’s price action has been contained since late November. Therefore, the safest way to trade this market is to wait for the price action to break above or below, the triangle’s trendlines.

Judging by the market’s resilience to drop below the $0.06 support level, it appears that the triangle will end up with a bullish breakout.

However, bulls may just want to wait until the triangle’s upper edge is broken before going long. On such a move, bulls should target resistance seen at $0.16, with a stop-loss order at $0.8. This way, the risk-reward ratio makes sense from a money management perspective.

The post Dogecoin needs to close above $0.1 for bullish momentum to continue appeared first on CoinJournal.

If stocks bounce, will Bitcoin follow?

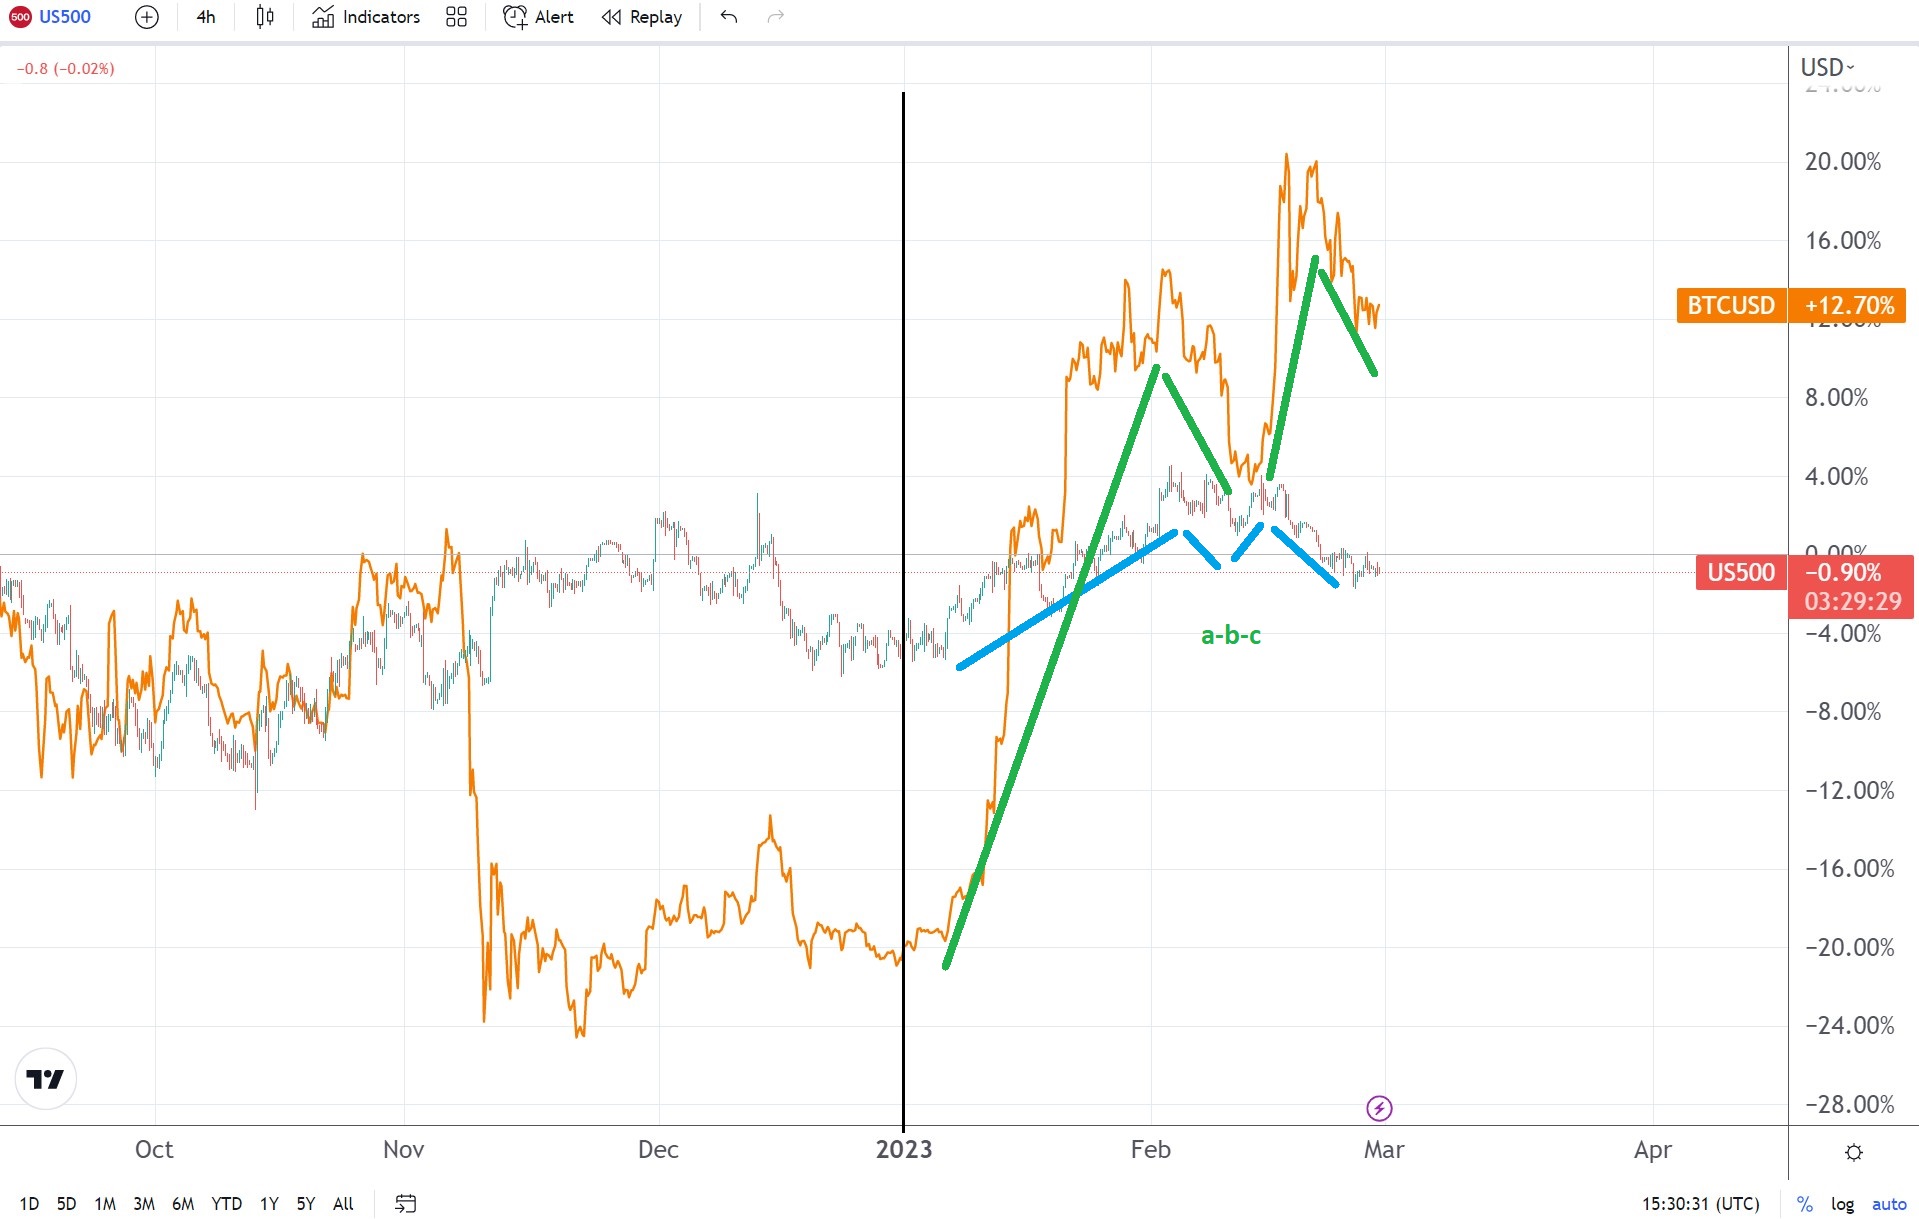
  • Bitcoin and the S&P 500 move in a direct correlation 
  • The recent corrections look like an Elliott Waves a-b-c
  • If stocks make a new high for the year, Bitcoin will follow

US stocks rallied in 2023, and so did Bitcoin. One may ask what market is leading, and the answer is the stock market.

The S&P 500 index appears to have made a double top this month, but if the correlation with Bitcoin holds, then the double top would be invalidated by stocks making a new high.

So far, the 4,150 area proved to be resistance, but it might just be that the market forms an ascending triangle. If we look at how Bitcoin reacted to the S&P 500 rally, the recent correction is just part of an a-b-c structure, familiar to those using the Elliott Waves theory to trade financial markets.

S&P500 chart by TradingView

Flat patterns point to more upside

A flat pattern is a corrective wave labeled as an a-b-c. Elliott traders use letters to count corrective structures.

Only in this case, the flat pattern has two corrective waves of a lower degree (i.e., waves a and b), and one impulsive (i.e., the c-wave).

In other words, it means that the next wave of the same degree will fully retrace the stock market’s decline from this year’s highs. Given the direct correlation between the S&P 500 and Bitcoin, it means that Bitcoin will do the same and make a new high for the year.

To answer this article’s question, Bitcoin would follow the stocks lead if the S&P 500 bounces from the current lows.

The post If stocks bounce, will Bitcoin follow? appeared first on CoinJournal.

Liquity surges 64% in 24h – will it make a new all-time high?

  • Liquity surged more than 60% in the last 24h
  • Parity plays a pivotal level 
  • A move above $3 should not be ruled out

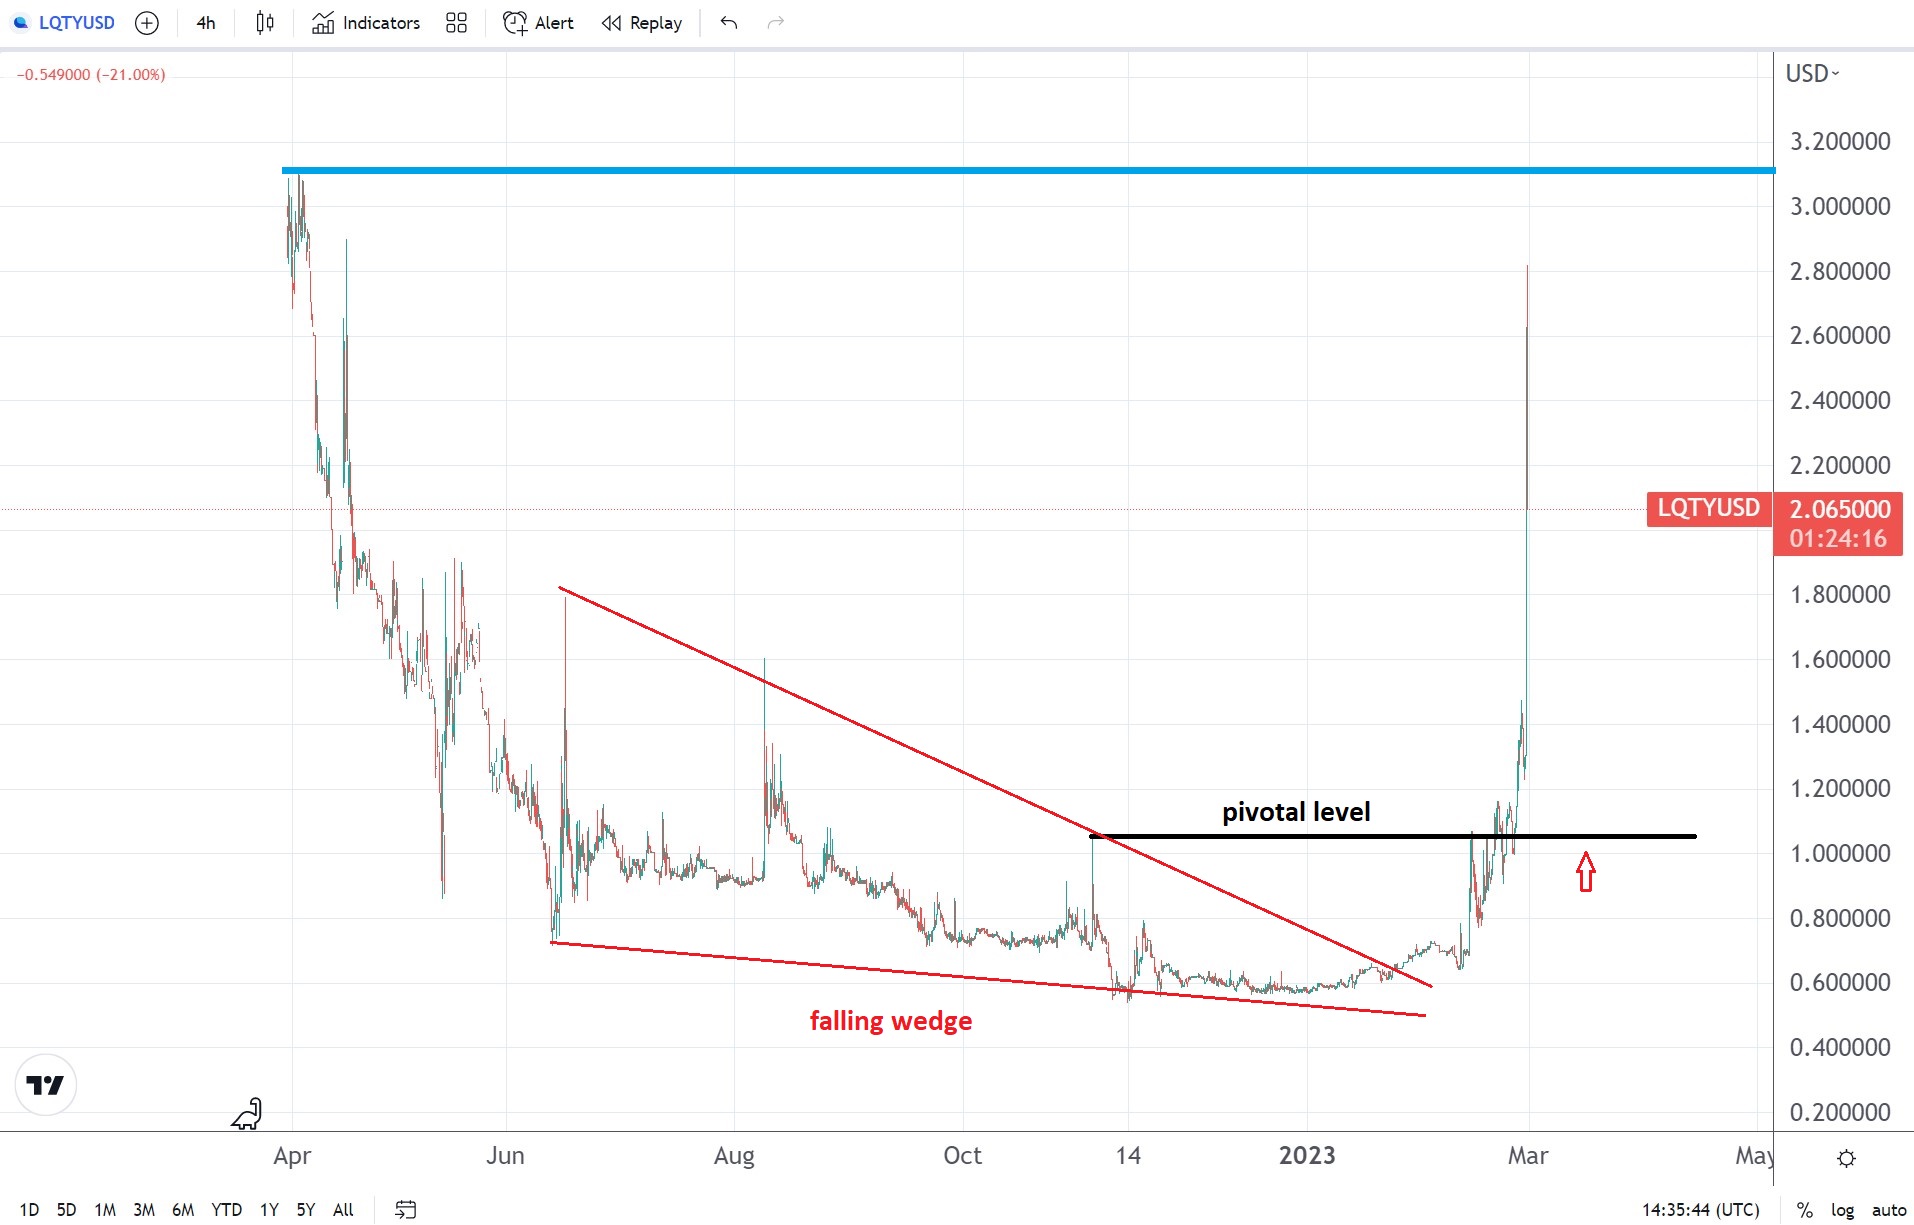
The top gainer in the last 24h in the cryptocurrency market is Liquity – a decentralized borrowing protocol that allows drawing interest-free loans against Ether. It gained over 60% against the US dollar and now threatens to break the all-time high.

According to the official Liquity documentation, investors get access to an immutable, capital-efficient, and fully decentralized protocol.

So does it make sense to buy Liquity after this rally? Or is the 2022 bear market still in place?

LQTUSD chart by TradingView

Parity turned out to be a pivotal level

Since its inception, Liquity has suffered from the overall bearishness seen in the cryptocurrency market. From $3, the price dropped to below $0.6 as each rally was met with further selling.

But one thing is worth mentioning just after having a simple look at the chart above. That is, the effect the parity level had on the price action.

More precisely, parity played a pivotal role. While below, it offered resistance. While above, the price met support.

Therefore, the breakout above parity seen in the last several days led to the surge that made headlines. $2.8 capped the price so far, but Liquity’s rally may continue while above parity.

All in all, the technical picture is bullish while Liquity trades above parity. On a move below, the narrative changes dramatically.

The post Liquity surges 64% in 24h – will it make a new all-time high? appeared first on CoinJournal.

Uniswap technical analysis – bullish price action to continue

  • $7.5 is a pivotal level for Uniswap
  • A move above should trigger more strength 
  • Bulls may target $14 if the price action holds above $5

Uniswap had a terrible 2022. It dropped like a rock.

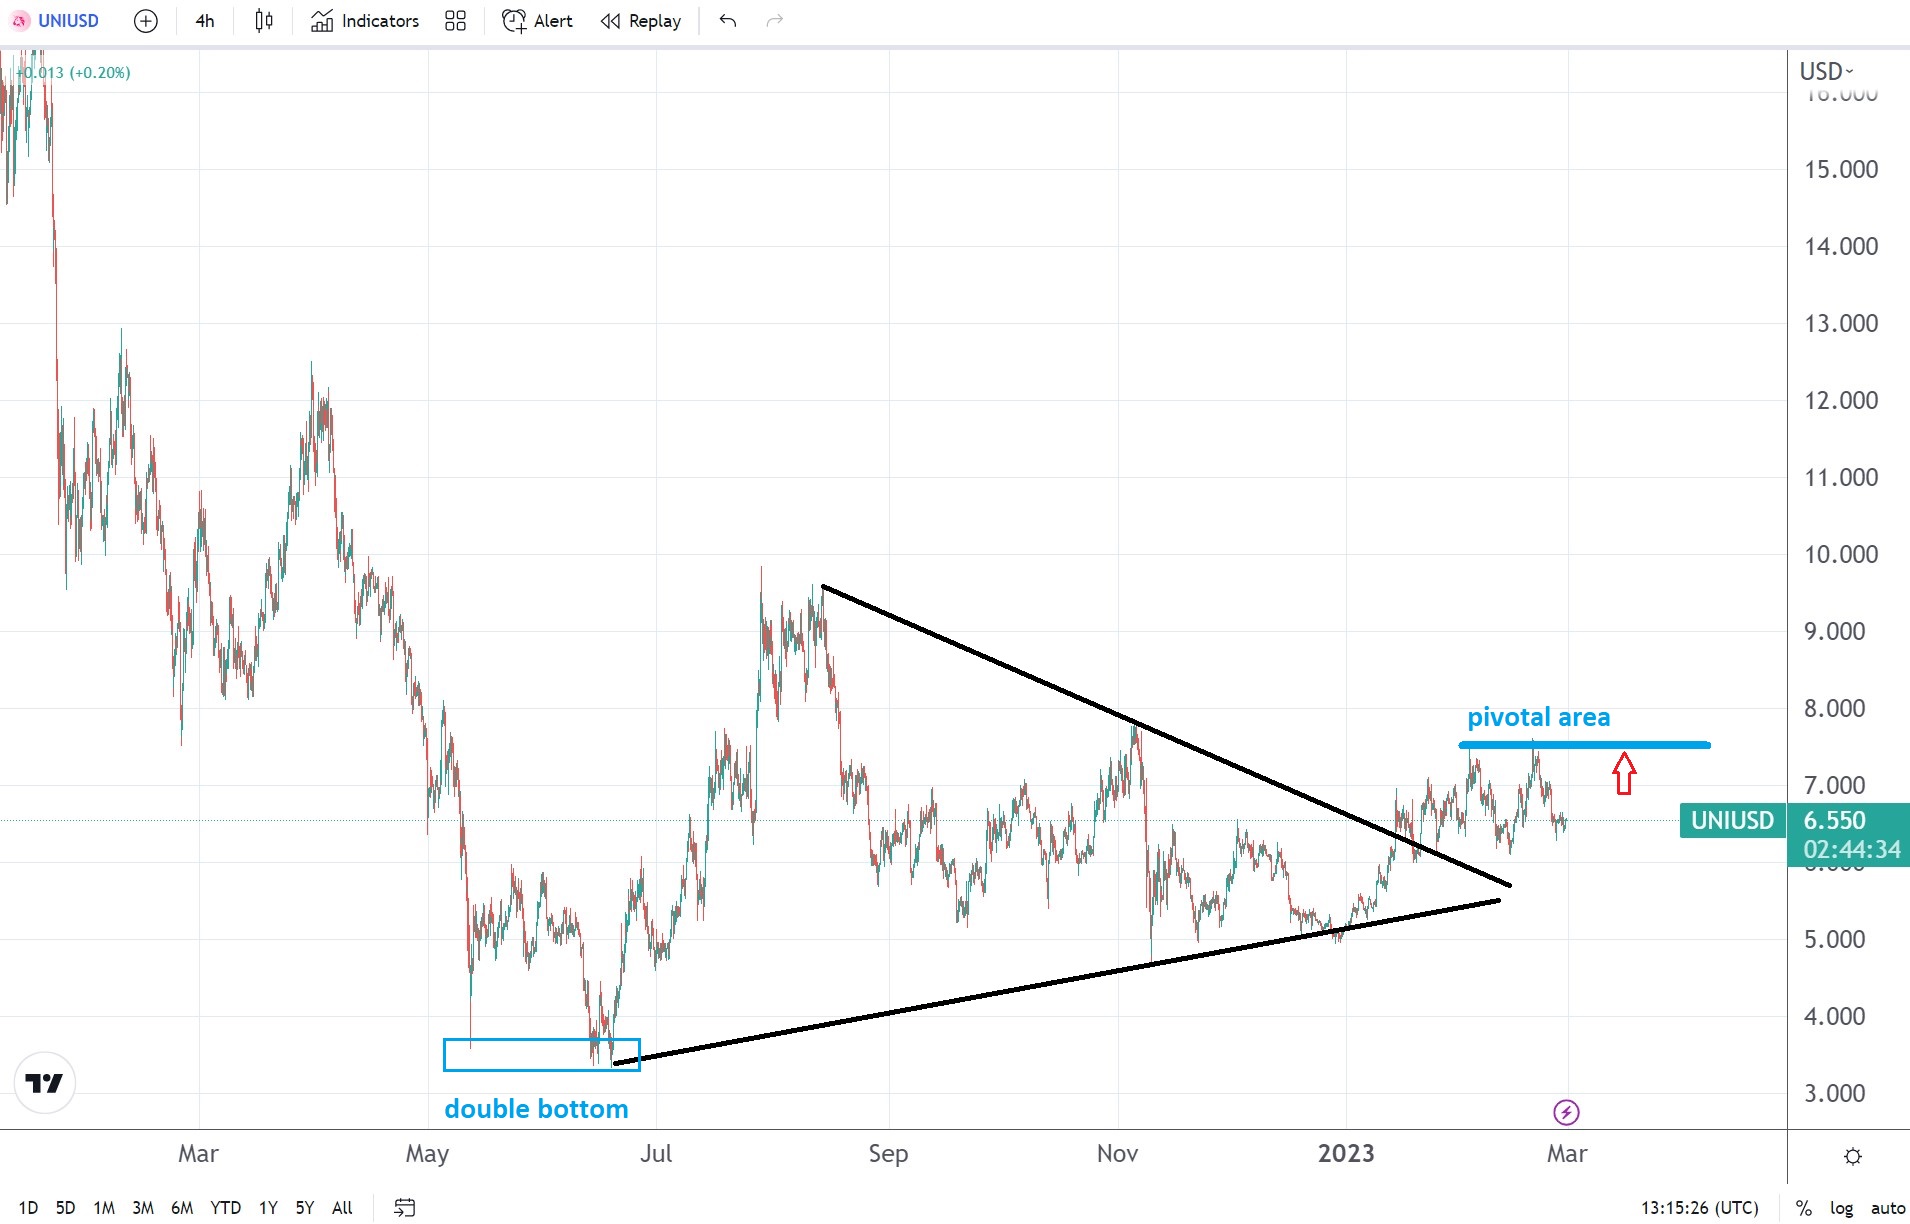
But technical analysis suggests that a bottom might be in place. During the second half of 2022, Uniswap consolidated in what appears to be a contracting triangle.

The bullish breakout happened in 2023 when Uniswap rallied in the first two months together with the rest of the cryptocurrency market. As the price overcomes the upper edge of the contracting triangle, where will Uniswap go next?

UNIUSD chart by TradingView

A move above $7.5 pivotal area should trigger more strength

The cryptocurrency’s market rally in the first two months of 2023 is a relief to many crypto investors. Faith in the market succumbed to very low levels after the FTX saga as investors fled the market.

But buyers stepped in, as reflected by the Uniswap daily chart. For more than six months, the market had formed a contracting triangle that acted as a reversal pattern.

Now that the triangle broke to the upside during the 2023 rally, where can the price go?

Technical analysis suggests more strength ahead. While the $7.5 area offered strong resistance, a move above it is pivotal.

Therefore, bulls may want to place a buy-stop order at $8 with a stop at $5. The take-profit level should exceed the previous lower high belonging to the 2022 bearish trend. Also, it should exceed the longest segment of the triangular pattern. Hence, a take-profit order in the $14 area would make sense.

The post Uniswap technical analysis – bullish price action to continue appeared first on CoinJournal.