
Shiba Inu price lags as Pepe, Keke, Ben volume and traction jumps

  • Shiba Inu price performance has lagged that of new meme tokens like Keke, Ben, and Pepe. 

  • The volume of Shiba Inu in the past 24 hours stands at $120M compared to Pepe’s $500M.

  • Many novice crypto traders are buying meme tokens that are clearly scams. 

Shiba inu price has recoiled recently as focus remains on the upcoming alternatives like Keke, Ben, Pepe, and Bambi. SHIB was trading at $0.0000090, which was the lowest level since January 13. It has dropped by more than 42% from the highest point in March.

Meme coin season continues

A major news theme in the cryptocurrency industry is the meme coin season. In the past few days, we have seen many new meme coins move from obscurity to become some of the biggest coins in the industry. 

Shiba Inu, the second-biggest meme coin in the world after Dogecoin, has been abandoned as investors focus on these new tokens. For example, data by CoinMarketCap shows that the volume of Shiba Inu traded in the past 24 hours stands at just $120 million. 

On the other hand, the volume of Pepe traded in the same period stands at about $508 million. This makes it the fourth coin after Bitcoin, Ethereum, and Sui. BEN, another meme coin, has seen the volume jump to $79 million, which is a substantial figure considering that it is a relatively new token. 

Other smaller meme coins like Keke, FourCoin, and Bambi have seen their volumes jump. 

However, the risk is that many crypto traders are buying tokens that are being pumped and dumped. As we wrote here, some whales have started to move their Pepe tokens. Indeed, the prices of most of these new meme coins have dropped sharply from their all-time high. Since they lack a clear utility, I suspect that most of these tokens will drop sharply in the near term. 

Shiba Inu price prediction 
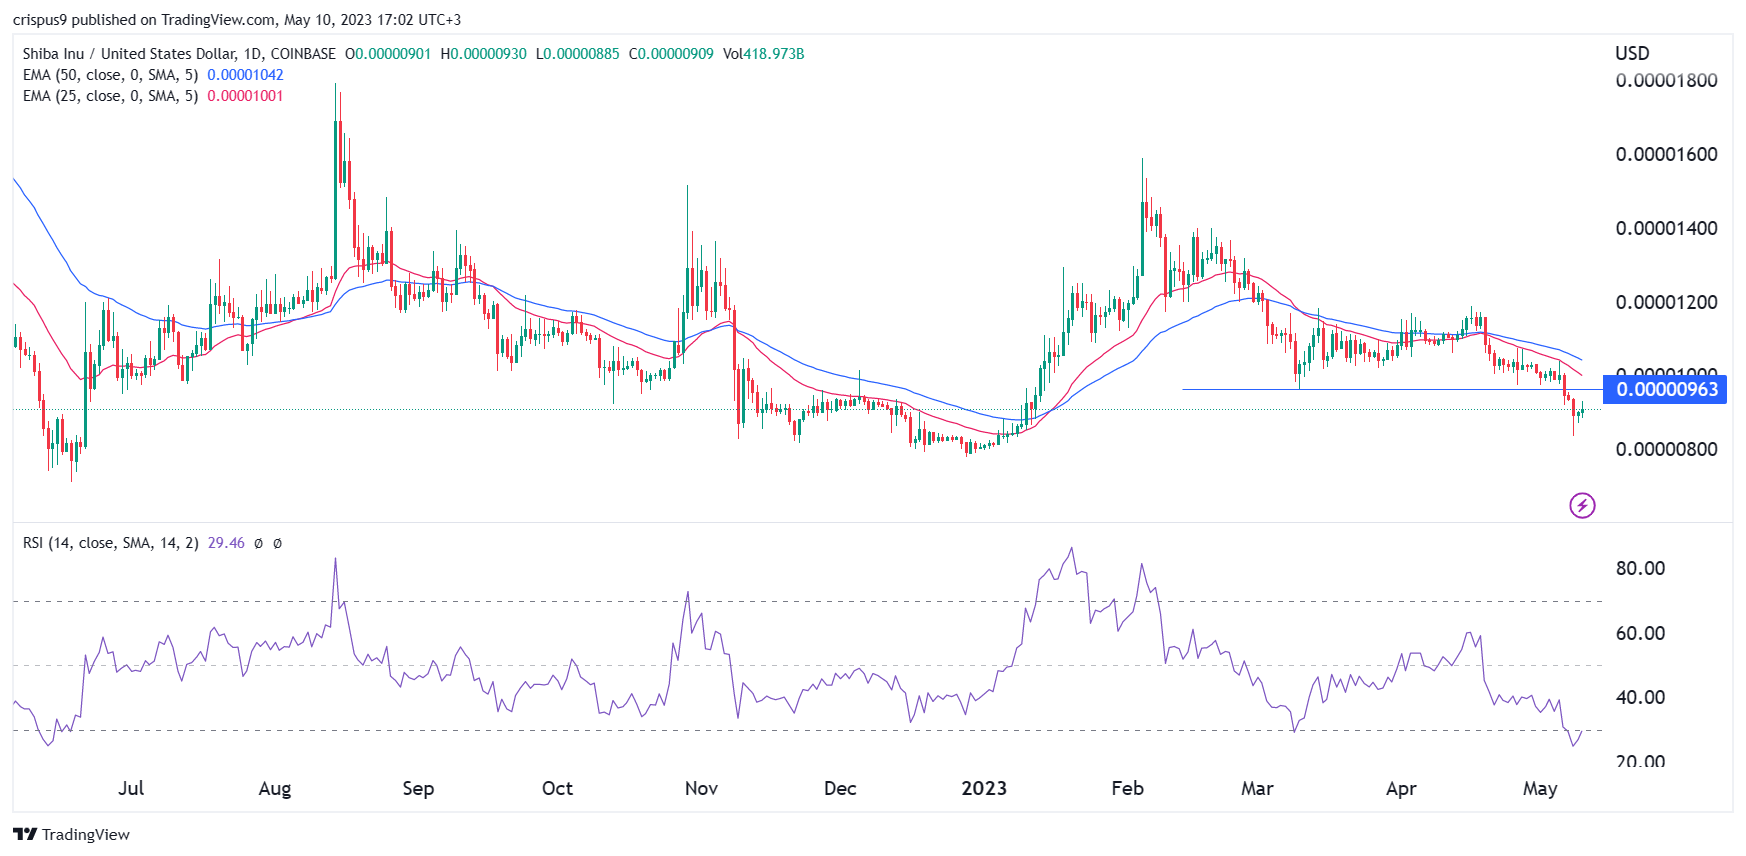
Turning to the daily chart, we see that the SHIB price has been in a strong bearish trend in the past few weeks as attention shifts to the new meme coins. The token managed to move below the key support level at $0.0000096, the lowest level on March 10.

Shiba Inu remains below the 25-day and 50-day moving averages while the Relative Strength Index (RSI) has moved to the oversold level. Therefore, the outlook of the token is still bearish, with the next level to watch being at $0.0000080. A move above the resistance level at $0.000010 will invalidate the bearish view. 

How to buy Shiba Inu

eToro

eToro offers a wide range of cryptos, such as Bitcoin, XRP and others, alongside crypto/fiat and crypto/crypto pairs. eToro users can connect with, learn from, and copy or get copied by other users.

Buy SHIB with eToro today

Public

Public is an investing platform that allows you to invest stocks, ETFs, crypto, and alternative assets like fine art and collectibles—all in one place.

Buy SHIB with Public today

The post Shiba Inu price lags as Pepe, Keke, Ben volume and traction jumps appeared first on CoinJournal.
Why is Stacks (STX) going down: Can it stay above $0.6?

Key takeaways

  • STX is the worst performer amongst the top 100 cryptocurrencies by market cap so far today.

  • Stacks has lost more than 9% of its value today and could record further losses in the near term.

  • The broader market is stagnant ahead of today’s CPI readings.

STX dips by more than 9% today

STX, the native token of the Stacks ecosystem, is the worst performer amongst the top 100 cryptocurrencies by market cap so far today. The coin has lost more than 9% of its value over the last 24 hours and could experience further bearish trend continues.

There is no catalyst behind STX’s ongoing poor performance. The cryptocurrency is correcting after rallying to its weekly high of $0.81. Over the past month, STX has lost more than 20% of its value after reaching a high of $0.9819.

At press time, the price of Stacks stands at $0.6442. If the bearish trend continues, STX could drop below the $0.6 psychological level in the near term. 

Crypto investors await the CPI readings

The Consumer Price Index (CPI) readings in the United States will be revealed later today. Cryptocurrency investors are awaiting the figures before making their moves, with volatility in the market currently low.

The CPI will give investors insight into the current inflation situation in the United States. If the inflation figures increase, the Federal Reserve could continue its interest rate hike.

Earlier this month, the Fed increased interest rates by 25 basis points, taking interest rates in the US to a 16-year high.

However, a lower inflation figure could see the Federal Reserve cool down its rate hike. 

Bitcoin, the world’s leading cryptocurrency by market cap, continues to trade just below the $28k level. The total cryptocurrency market cap stands at $1.14 trillion, down by less than 1% today.

The post Why is Stacks (STX) going down: Can it stay above $0.6? appeared first on CoinJournal.

ETH/BTC price has upside potential, according to this bullish pattern

  • Bitcoin’s YTD return exceeds Ethereum’s
  • The best way to speculate on the difference between the two is to trade the ETH/BTC cross
  • A bullish flag favors more upside for Ethereum

Two of the leading cryptocurrencies are Bitcoin and Ethereum. The direct correlation between the two is so strong that one cannot move up or down without the other one to follow.

Bitcoin is supposed to lead, but that has not always happened. In any case, in 2023, Bitcoin gained 67.05% YTD, while Ethereum 53.95% YTD. Hence, Bitcoin leads, but for those believing in Ethereum, it means that there is more room to catch up.

The best way to speculate on the difference between the two is to focus on the ETH/BTC price. The cross tracks the differences between the two leading cryptocurrencies; the higher it gets, the closer the two move.

For example, if the cross moves to parity, it means that 1 Ethereum equals 1 Bitcoin. But that is a long road to such a level. As for now, the cross trades at 0.066, moving in a tight consolidation in 2023.

A bullish flag favors more upside for Ethereum

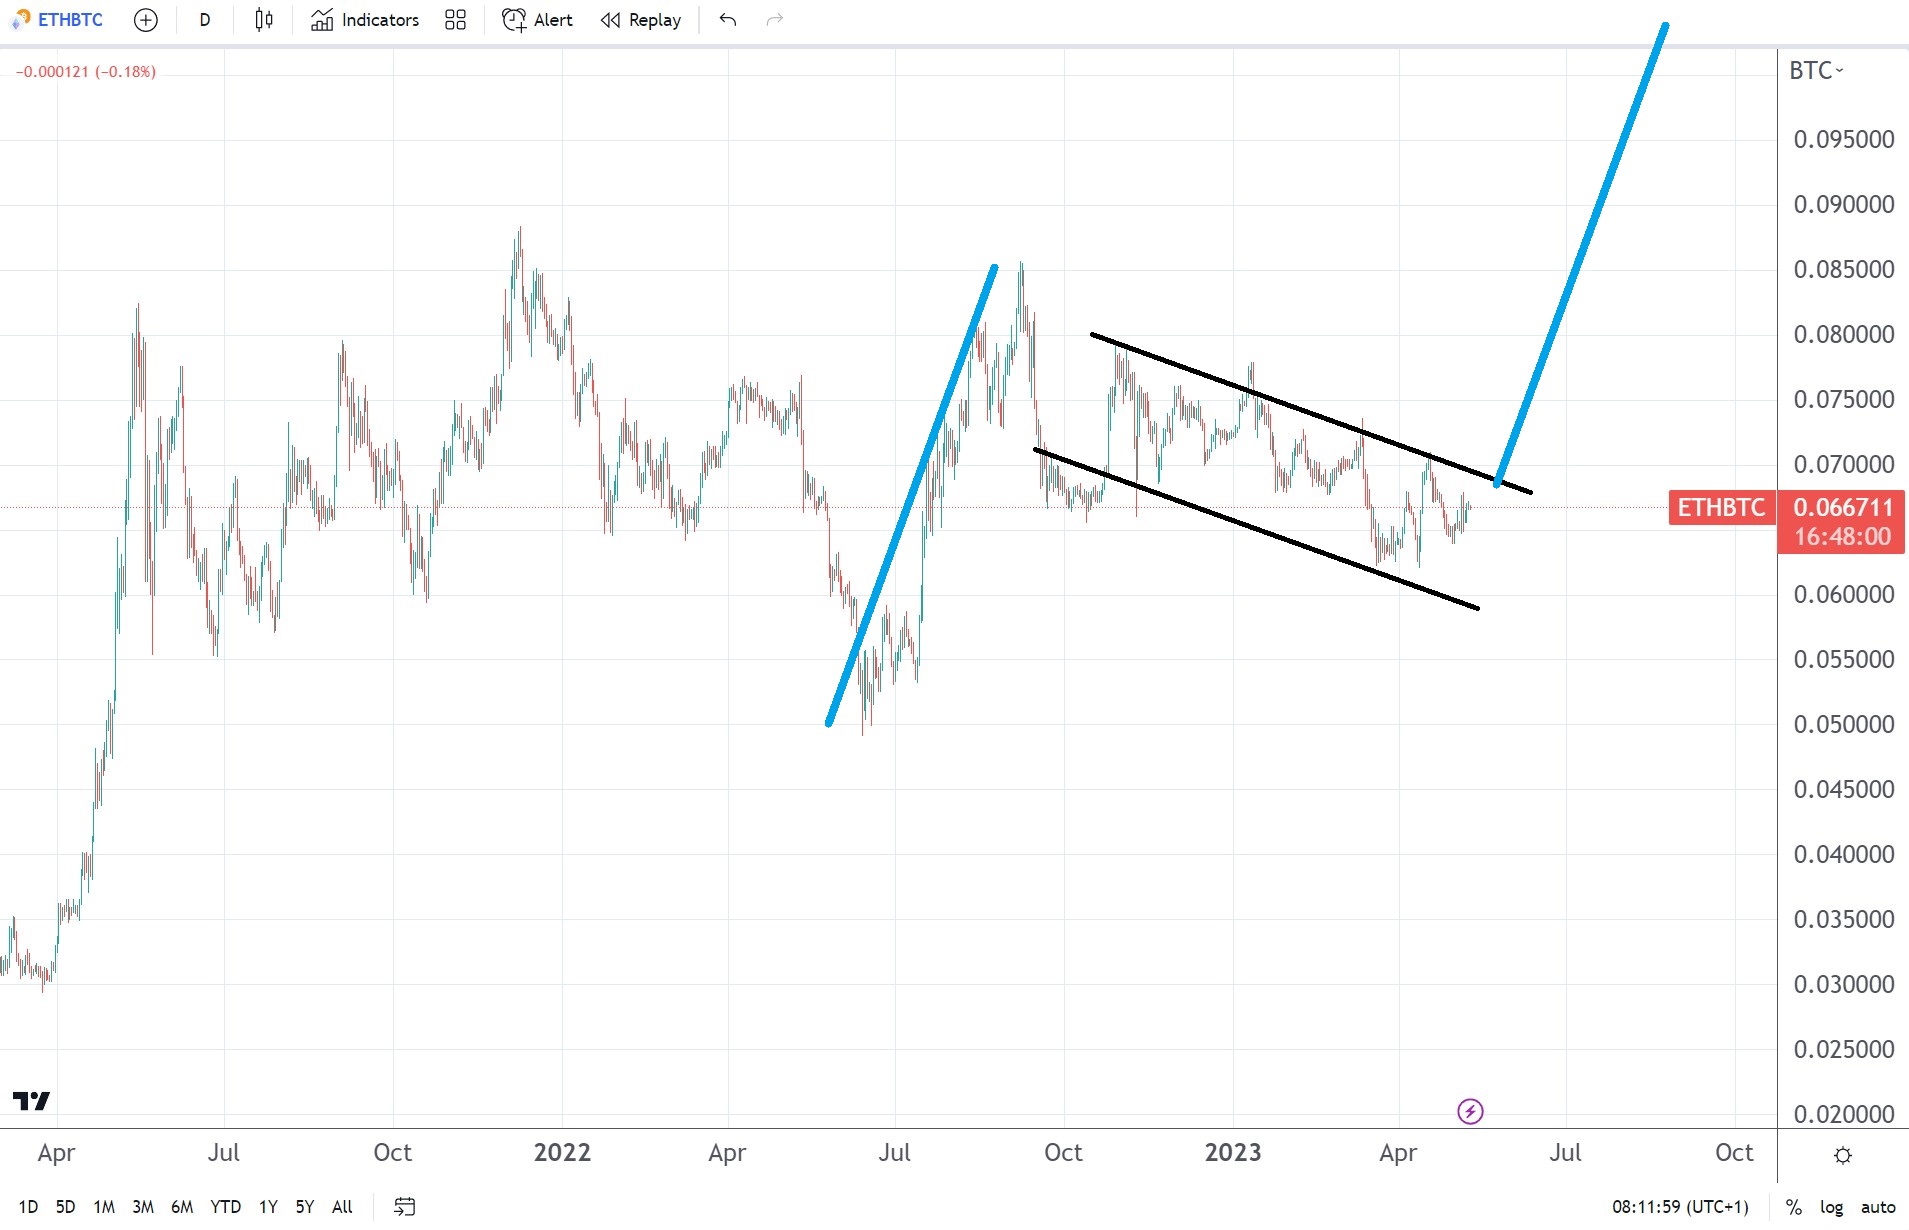
The ETH/BTC cross more than doubled in April 2021, moving from 0.03 to above 0.06. Since then, it moved into a range with the highest point 0.08 and the lowest 0.05.

ETHBTC chart by TradingView

But a bullish flag pattern keeps the focus on Ethereum. On a daily close above 0.07, bulls might want to invest in Ethereum instead of Bitcoin because the cross has room for more upside until the flag’s measured move is reached.

The post ETH/BTC price has upside potential, according to this bullish pattern appeared first on CoinJournal.

AltSignals presale accelerates even as Bitcoin cools down and meme interest grows

  • AltSignals token presale is now 66.84% complete

  • The presale happens amid a tepid crypto market and growing interest in memes

  • $ASI could be attractively priced ahead of the token listings

Bitcoin has cooled down after a tepid run to the $30,000 mark. The cryptocurrency trades slightly below $28,000 at a time investors are still showing much interest in other little-known or new tokens like PEPE. This also happens when new tokens on presale, like AltSignals, attract interest, with 66.84% of the tokens sold out. Investors have been looking at AltSignals as a quality project backed by an existing community of traders. You can join the presale and become part of the AI transformation happening in the crypto industry.

Bitcoin slows, but meme interest grows

One of the most watched paradoxes in crypto is the trading behaviour of Bitcoin versus meme cryptocurrencies. Historically, increased interest in meme cryptocurrencies like Dogecoin has caused a slowdown in Bitcoin. This time around, interest is on another little-known coin, PEPE. The frog-themed meme coin debuted in mid-April but has grown exponentially. The market cap rose to $1.82 billion barely a week ago, but it has retraced.

The interest in PEPE has also seen other little-known tokens, such as 4TOKEN, DINO, and CHAD, increase in value. It shows investors’ interest in crypto remains strong despite a prolonged bear market. That’s because meme cryptocurrencies are driven by speculations, meaning investors still hold ground.

The intense interest in new cryptos favours newcomers like AltSignals ($ASI). Beyond the speculative reasons that could spur its uptake, AltSignals token powers a service that is in high demand – AI trading. That makes it a more sound investment compared to the meme predecessors and one that could deliver long-term success. 

AltSignals – Leveraging the power of AI to power trading

AltSignals is a UK-based trading service. Since its inception in 2017, the platform has built a successful business that has attracted thousands of followers on Telegram. AltSignals has been using AltAlgo™, an advanced technical analysis tool, to generate quality signals for its community. The signals cut across forex markets and digital assets. The company has produced over 3,700 signals, with an average accuracy rate of over 64%. The signals have directly benefited over 52,000 traders who use the service.

To capitalise on the early success, AltSignals is launching an artificial intelligence-led trading platform for its community. The platform will be dubbed ActualizeAI and will be powered by AltSignals token $ASI. With AI, AltSignals expects to improve the quality of signals it produces and benefit its community further. There are other utilities the community will enjoy, potentially explaining why the $ASI presale has attracted a lot of interest so far.

Is ActualizeAI and $ASI really a good opportunity?

The world is shifting towards AI, and it’s no coincidence that software like ChatGPT is growing popular. Trading is one of those areas that is projected to benefit immensely from AI. AI trading systems can quickly and more accurately process data, allowing traders to make the right decisions. The systems can filter human emotions, pull data from various sources, and integrate a range of parameters in advanced technical analysis. Thus, a platform like ActaulizeAI could be exciting, especially since it is built from an already existing system by AltSignals. 

Similarly, owning $ASI guarantees access to AltSignals AI platform ActualizeAI. Investors benefit from quality trading signals which they can use to grow their bottom lines. AltSignals also envisions a situation where the trader is in control. They can use $ASI to vote on decisions and be part of beneficial ownership in the AI Members Club. In other words, apart from speculating on $ASI, investors have other range of benefits for investing in ActualizeAI. 

Should you buy $ASI this week?

With less than 35% of $ASI remaining before the presale completes, it could be the right time to invest. After that, the price may rise exponentially as $ASI is expected to list on Uniswap in the second quarter of 2023. It means investing early offers a chance to buy the token at a low price before more investors have access to it.

The post AltSignals presale accelerates even as Bitcoin cools down and meme interest grows appeared first on CoinJournal.

Here’s why the Bitcoin SV (BSV) price just went vertical

Bitcoin SV price surged to the highest level since March 1 as investors moved to the coin, which is an alternative to BTC. BSV jumped to a high of $42.10, which was about 48% above the lowest level this year. The coin’s market cap has jumped to more than $748 million.

Is this a pump-and-dump scheme?

There was no news that pushed Bitcoin SV higher on Tuesday. A likely reason why the BSV is rising is because some investors believe that it is a better alternative to Bitcoin. As we wrote in this article on Monday, Bitcoin’s fees jumped on Monday because of elevated congestion in the network. 

As a result, Binance, the biggest crypto exchange in the world, suspended Bitcoin withdrawals several times on Monday. Bitcoin SV, which has less volume than the main Bitcoin, is therefore seen as a better alternative. For one, its transactions take less than 2 seconds to complete while the average transaction fee is about $0.0001. Also, the network can handle over 50,000 transactions per second (tps).

However, it is worth noting that the BSV price rally could be a pump-and-dump scheme. This is a situation where insiders or large holders buys an asset, promote it, and then exits at a profit, leaving buyers holding the bag. This situation is common among low-volume coins like Bitcoin SV.

Bitcoin SV price prediction

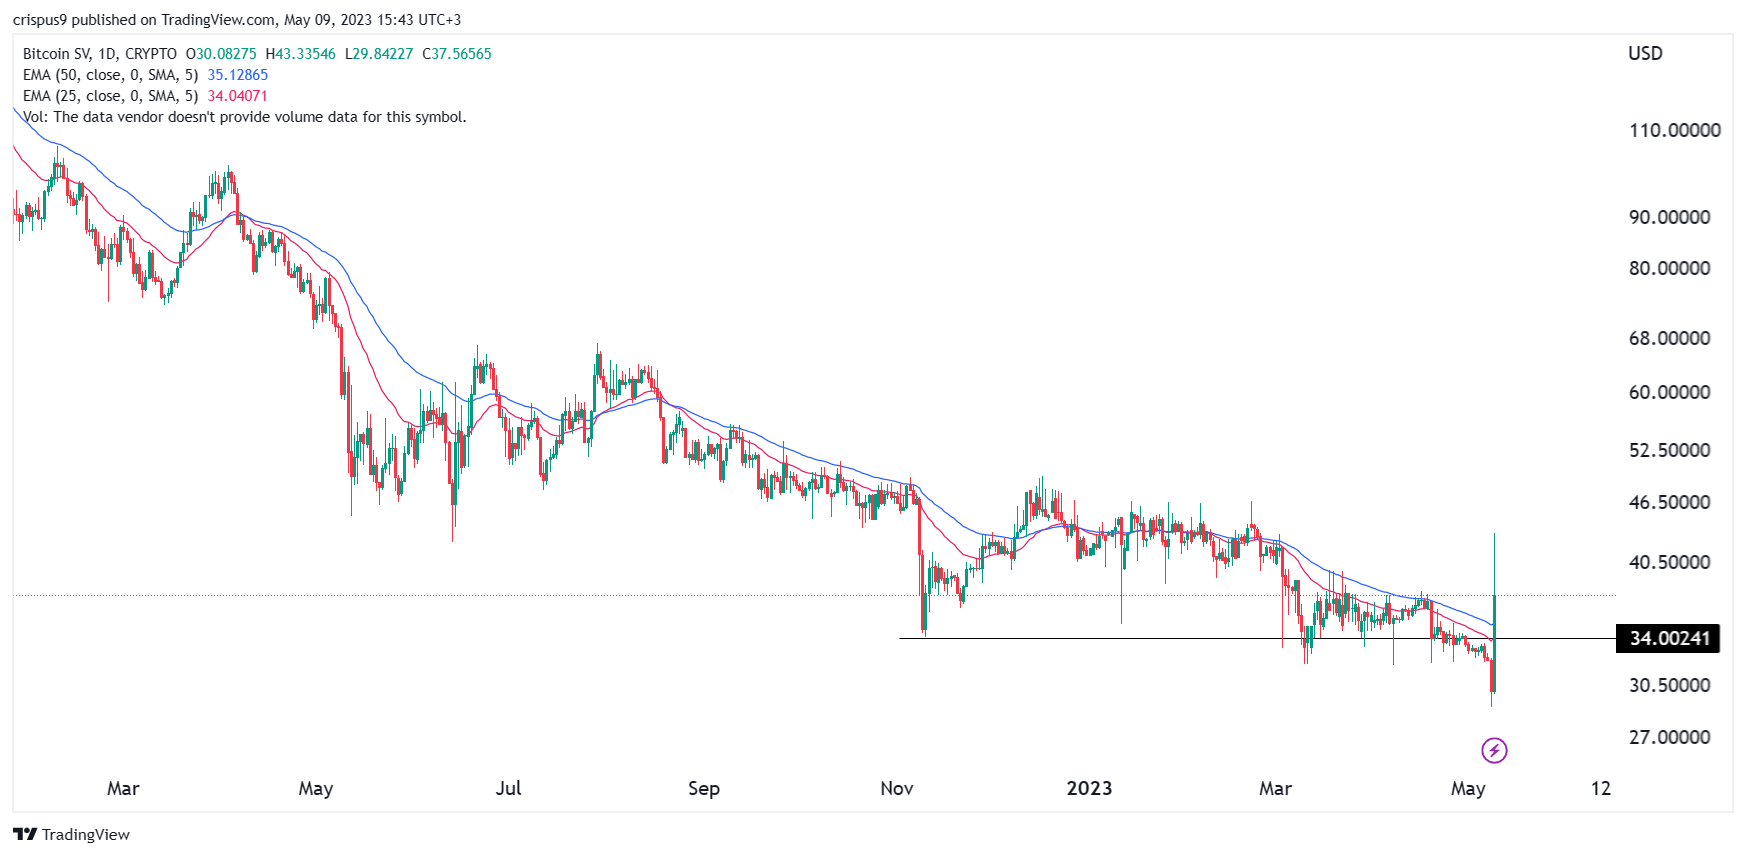
The daily chart shows that the BSV price has been in a strong bearish trend. It has crashed by over 90% from the highest point on record. The coin has also moved below all moving averages. It moved slightly above the crucial resistance point at $34, the lowest point on November 22 last year.

Therefore, I believe that this Bitcoin SV rally does not have legs. As such, there is a likelihood that it will resume the downward trend to where it was before it jumped. This could see it retreat to the next key support at $30.

The post Here’s why the Bitcoin SV (BSV) price just went vertical appeared first on CoinJournal.