Bitcoin price forecast with the help of EUR/USD

  • Bitcoin and EUR/USD have a direct correlation
  • EUR/USD leads
  • Bitcoin’s recent bullish trend has been based solely on the dollar’s weakness

Today is the last trading day of a busy trading week in the traditional currency market. Three central banks (Federal Reserve, European Central Bank, Bank of Japan) have announced their interest rate policy decisions.

For cryptocurrency traders, and especially for Bitcoin investors, the first two central banks directly impact Bitcoin’s price action. As it turns out, after being part of numerous institutional investors’ portfolios, Bitcoin’s price just follows the US dollar movements.

Sure enough, the volatility in the cryptocurrency space is much higher than in the traditional currency market. Nevertheless, one cannot ignore the direct correlation between the EUR/USD exchange rate and Bitcoin in the past several months.

Bitcoin chart by TradingView

Bitcoin and EUR/USD have a direct correlation  

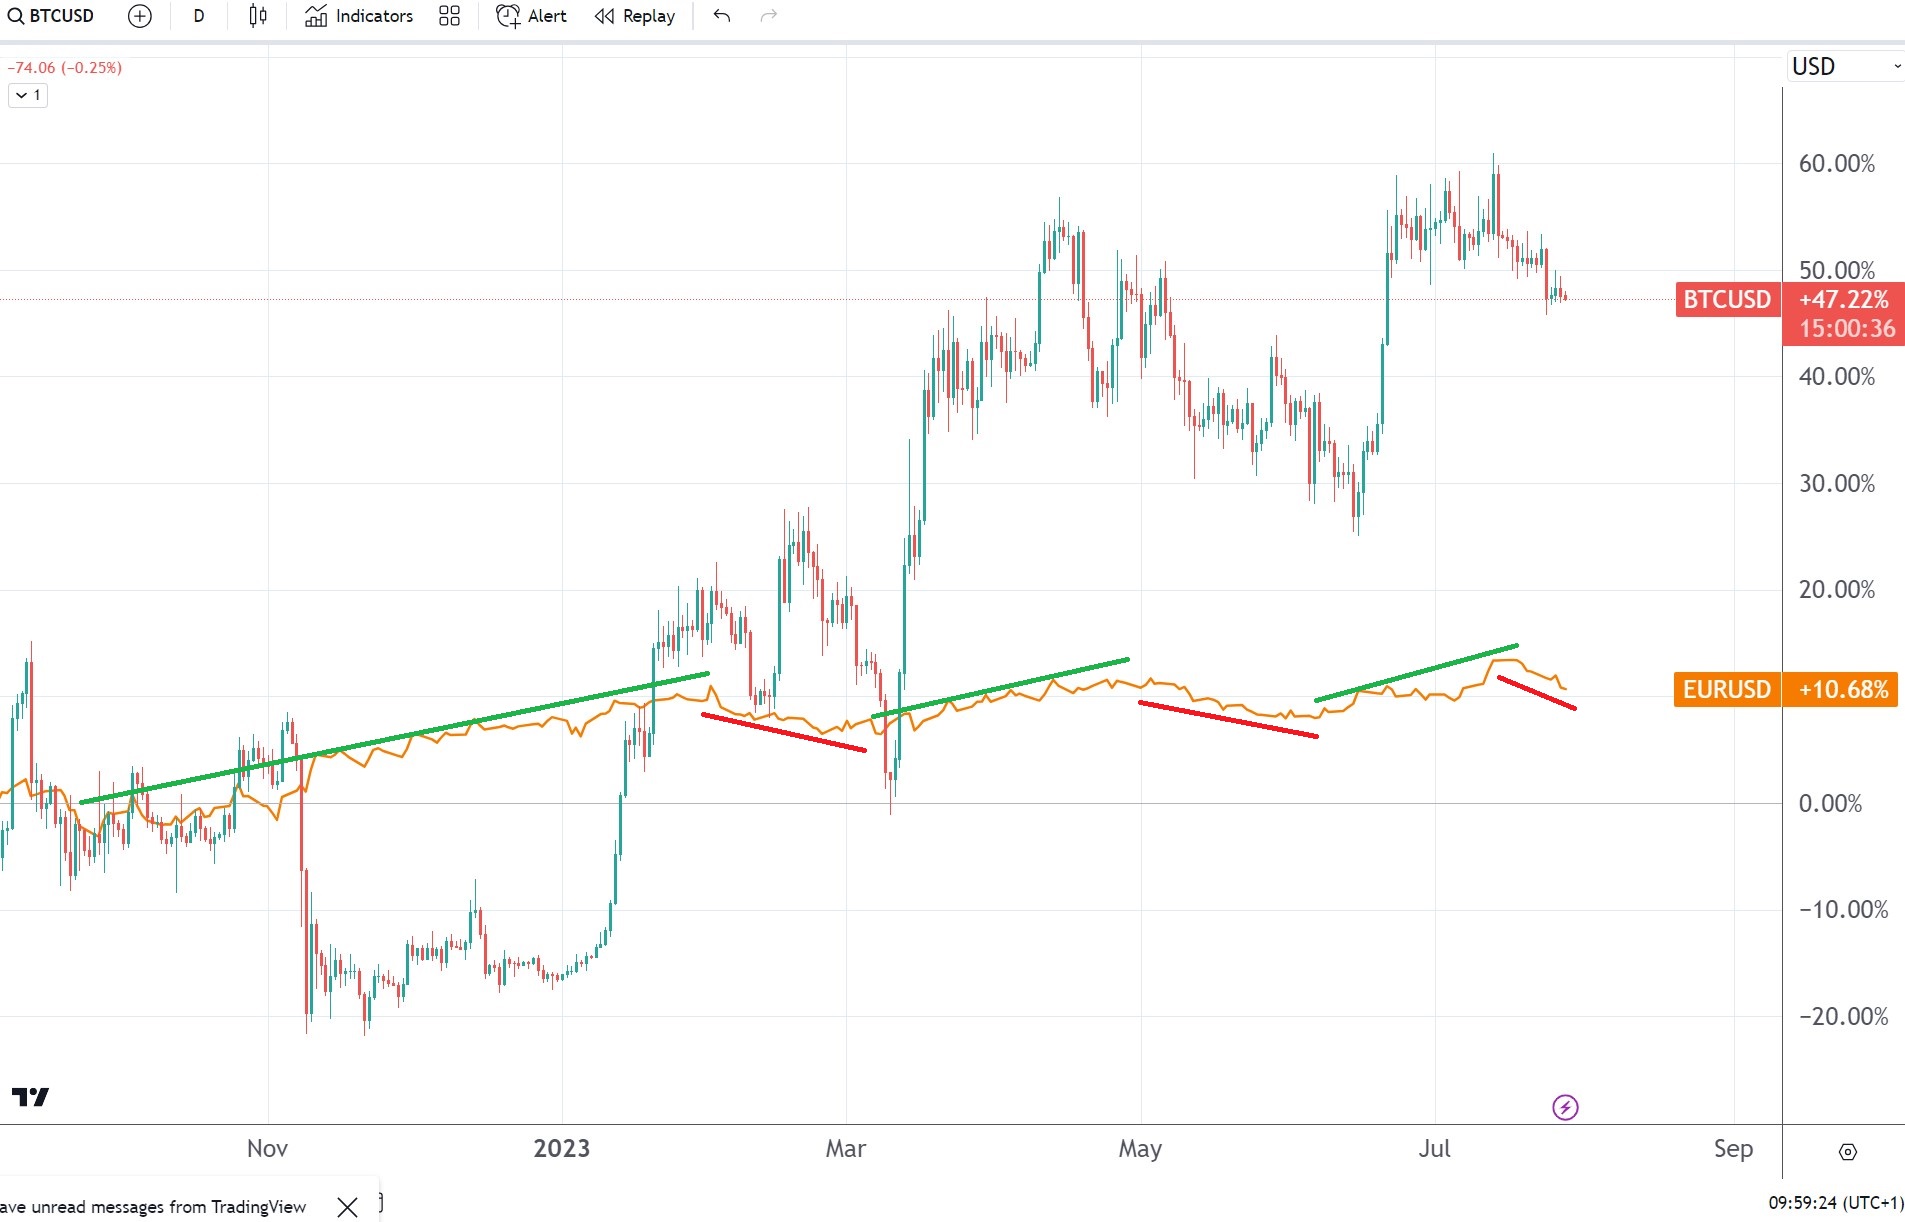
EUR/USD bottomed in October last year and has rallied ever since. Sure enough, corrections appeared, but the overall trend remained in place.

The chart above shows the different cycles that the EUR/USD formed from left to right. Unsurprisingly, Bitcoin followed.

For example, despite making a new lower low at the end of 2022, Bitcoin bounced and rallied at the start of the new year. Basically, it caught up with the EUR/USD bullish trend.

Since then, every correction or rally on the EUR/USD pair was met with a similar response from Bitcoin. Therefore, it is fair to assume that if Bitcoin hodlers hope for the price to break and hold above $30k, it can only do so with a bullish EUR/USD price action.

The post Bitcoin price forecast with the help of EUR/USD appeared first on CoinJournal.

Optimism and Arbitrum metrics diverge as OP token outperforms

  • Optimism and Arbitrum are some of the best-known layer-2 networks.

  • The two network’s metrics have diverged in the past few days.

  • These metrics include the number of users and open interest.

Optimism and Arbitrum ecosystems have diverged in the past few weeks. Arbitrum’s number of active addresses has dropped from an all-time high of 191,612 in March this year to over 148k. Most recently, Optimism’s users has been in an upward trend and reached a high of 132,893.

The same trend is happening in their the performance of their decentralized finance (DeFi) industry. Data compiled by DeFi Llama shows that Optimism’s total value locked (TVL) in its ecosystem stands at over $1.27 billion while Arbitrum’s stands at over $3 billion.

The two ecosystems have been relatively stable in the past few weeks. However, while Arbitrum’s TVL has dropped by 0.40% in the past 30 days, Optimism’s TVl has risen by over 13% in the past 30 days. This makes it second only to Solana whose TVL has jumped by more than 30%.

TVL is an important metric in the crypto industry in that it shows the amount of money locked in a network. Ideally, a network with a higher TVL is seen as being more active. In this regard, the most active ecosystems are Ethereum, Tron, and BNB Chain.

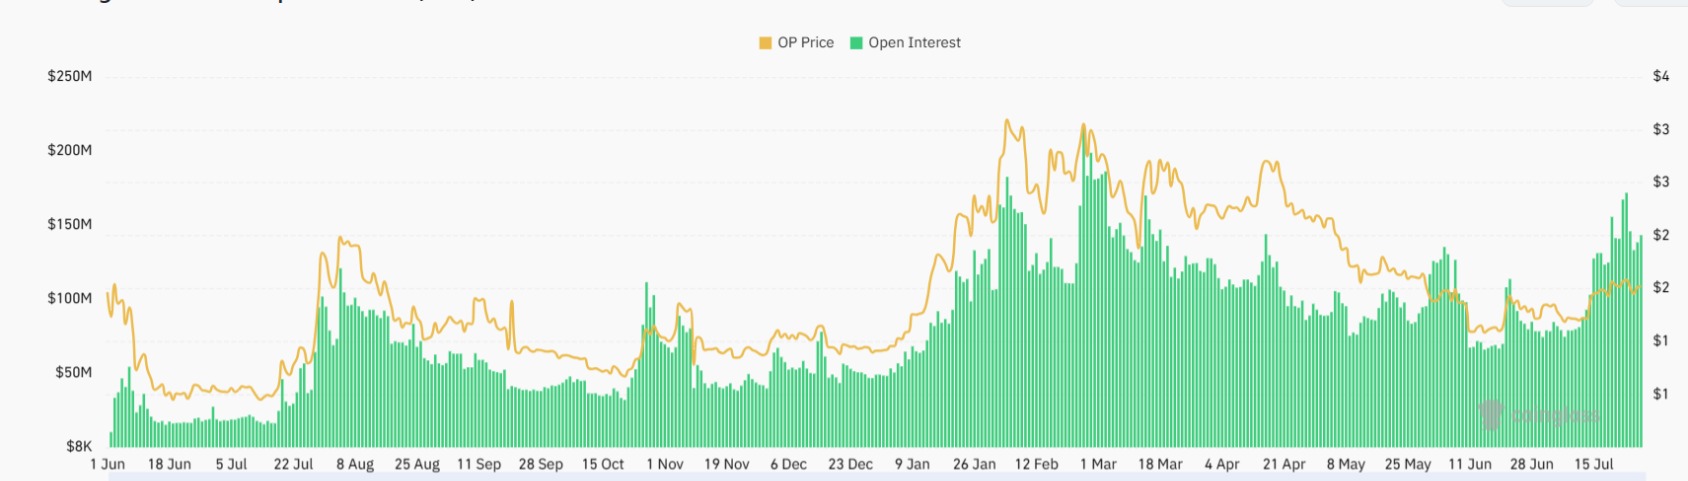
Additional data shows that the open interest of Optimism and Arbitrum’s tokens has diverged. The open interest of Arbitrum futures stands at $160 million, where it has been in the past few months. Optimism’s open interest, on the other hand, has been in an upward trend as you can see below. It rose to over $171 million this month and has now stabilised at $143 million.

A likely reason for this divergence is Worldcoin, the recently launched cryptocurrency. The WLD token has done well mostly because of the underlying technology and the fact that its creator is the founder of OpenAi, the company that introduced ChatGPT. Worldcoin is built on top of  Optimism.

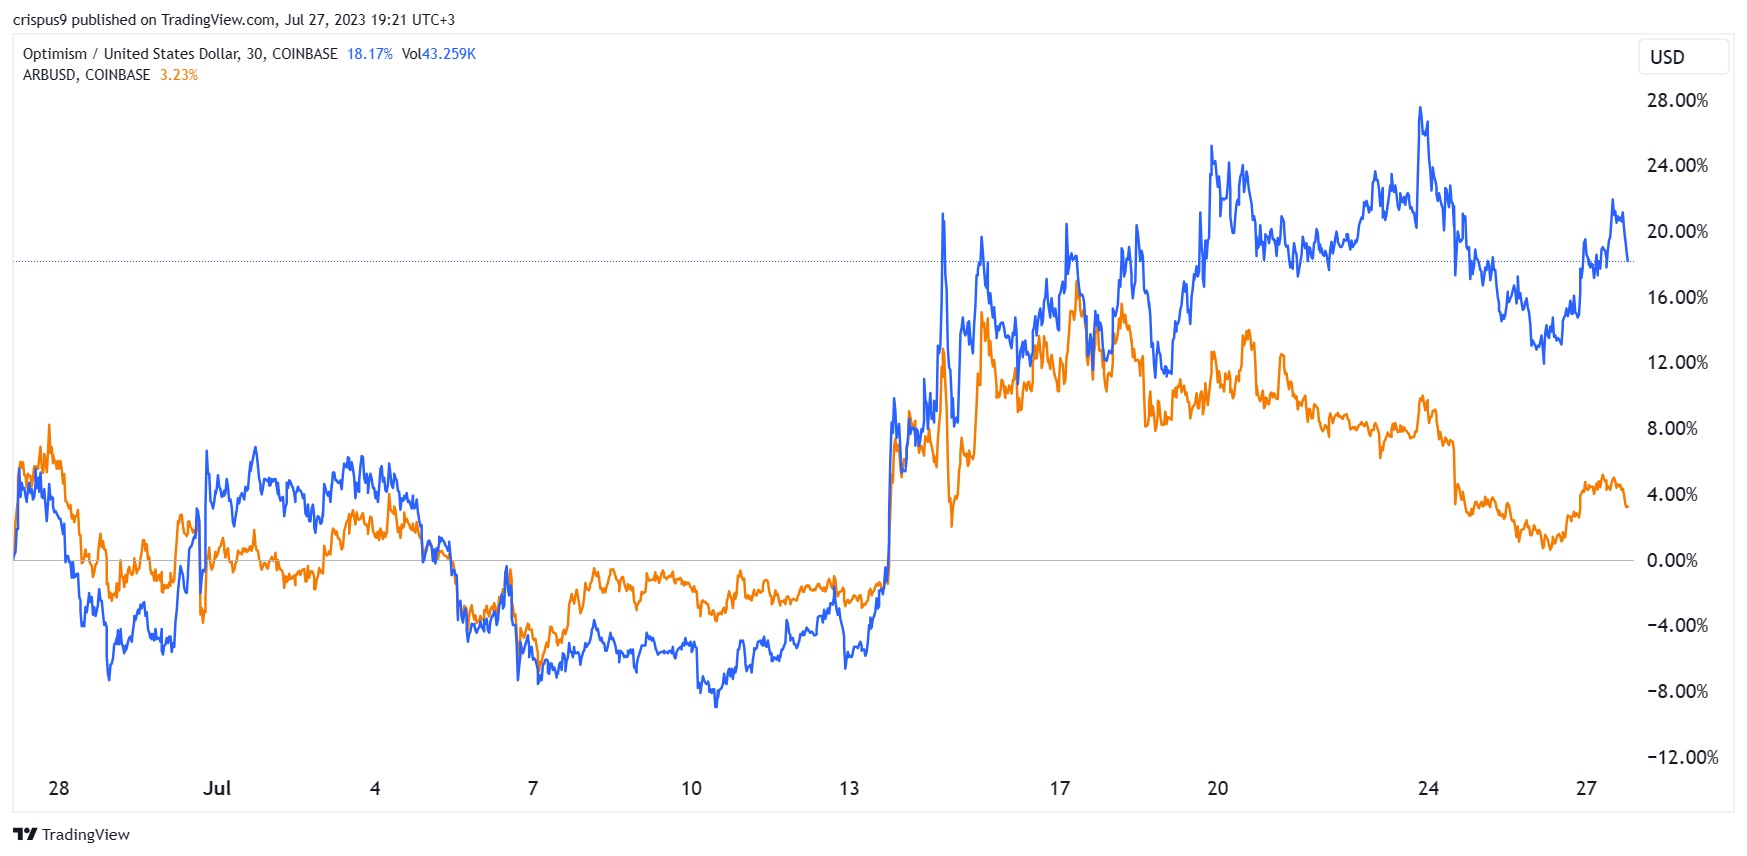
At the same time, the OP token has outperformed Arbitrum’s token. OP has risen by more than 20% this year while ARB token has risen by 4% in the past 30 days. 

Looking ahead, the next catalyst for Optimism token will be the upcoming token unlock that will happen on Sunday. The event will see the number of outstanding tokens jump according to the vesting schedule.

How to buy Optimism

The post Optimism and Arbitrum metrics diverge as OP token outperforms appeared first on CoinJournal.

Bitcoin inverse relationship with dollar weakening

  • The US dollar is the global reserve currency, meaning it is a key influence on all risk assets
  • Bitcoin has seen its negative correlation with the dollar pick up since the transition to a tight monetary regime, meaning it tends to strengthen when the dollar falls
  • This inverse relationship has softened in recent weeks, as Bitcoin has failed to capitalise on dollar weakness arising from lower inflation in the US
  • If history is to be followed and the correlation returns, Bitcoin could be in a place to advance


The status of the US dollar as the world’s reserve currency means it exhibits an enormous influence on risk assets not only in the US, but across the financial world. 

Bitcoin is no exception. We have seen an inverse relationship between the two assets play out over the last few years, meaning that as the dollar weakens, Bitcoin tends to strengthen, and vice-versa. 

This is for a couple of reasons. Firstly, Bitcoin is commonly quoted in USD due to, as mentioned above, the dollar being the global reserve currency. Therefore, it is simple math that when the denominator weakens (dollar), the ratio goes up, all else equal. 

However, the effects run deeper. Across international trade, debt and non-bank borrowing, the dollar reigns supreme. Firms issuing debt in foreign currency do so via the dollar an estimated 70% of the time (the euro is next with approximately 20%). Again, this is due to its status as the global reserve currency (we see the same in sovereign debt markets). As the dollar weakens, the cost of servicing this debt falls, greasing the wheels of global liquidity. Hence, risk assets tend to appreciate as the dollar falls, albeit a generalisation. 

For Bitcoin, we saw this in effect in 2022, as the dollar surged to a twenty-year high while Bitcoin was ravaged in line with risk assets across the market. Yet in the last month, the correlation has been fading and heading towards zero (i.e. no relationship at all). 

The above chart shows that this has happened a few times before in the last six months, only for the correlation to soon return (i.e. dip back down towards -1). The first major deviation came in March, when the regional bank crisis was triggered amid the sudden collapse of Silicon Valley Bank, sparking mass volatility in the market, with Bitcoin gaining nicely in the aftermath. More recently, the deviation seem to have been caused by the crypto-specific episodes featuring the SEC’s lawsuits against Binance and Coinbase, and the spot ETF applications from a slew of large asset managers. 

In the last week, the dollar has weakened further, continuing its steep downward trend. Its fall of nearly 2.5% is its worst drop since November, when softer-than-expectation inflation readings landed, fuelling speculation that the Federal Reserve would pare back on interest rate rises sooner than previously anticipated. Higher interest rates propel dollar strength, as capital is attracted to the dollar to exploit the higher yield on offer. 

Ten days ago, inflation landed at 3%, again softer than expected and causing a repeat of November’s episode: yet more dollar decline as the market positions itself for a potential end to the rate hiking regime. There is also the case of the dollar strengthening during times of macro uncertainty because, as the reserve currency, it is the safest asset on record. With correlations going to one in a crisis, there tends to be a significant strengthening of the dollar when fear increases. 

This is part of the reason for the dollar’s relentless advance in the first three quarters of last year, while the subsequent easing this year has seen the opposite. The below chart shows this relationship over the last half-century, with periods of recession (grey on the chart) typically resulting in gains for the greenback.  

Looking forward, one can imagine a scenario where the dollar continues to head lower. Inflation in the US is far lower than most other countries; eurozone inflation is at 5.5%, while the UK is at 7.9%, to name a couple. The Fed should have a greater ability to ease off the rate hikes if that divergence is maintained and inflation in the US continues to fall. 

For Bitcoin, should its inverse relationship with the dollar return, this could mean it may in a position to take advantage. It should be noted, however, that crypto-specific risk is high, which can overshadow any dollar effects easily. Not to mention the macro climate remains uncertain, even if things are brightening up. But history tells us that a weakening dollar is a boon for Bitcoin, and the past nine months have been no exception to this rule. 

The post Bitcoin inverse relationship with dollar weakening appeared first on CoinJournal.

A temperature check on crypto as market eyes end of rate hiking cycle


Key Takeaways

  • The Federal Reserve increased interest rates 0.25% Wednesday, but the market is anticipating the hiking cycle is coming to a close
  • Optimism is flowing in crypto markets, which saw crushing losses in 2022 as rates rose swiftly
  • While the Fed has said it no longer forecasts a recession, this could be a double-edged sword for crypto
  • Fed may be reluctant to cut rates, instead electing to for the higher for longer approach, something which could restrain crypto
  • Employment is at half-century lows, wage pressure remains and core inflation has been stickier than the headline number
  • Overall, macro environment is far brighter than nine months ago, but caution may be prudent for crypto investors despite market-wide sentiment spiking rapidly

Following the latest 25 bps increase to the federal funds rate Wednesday, which was widely anticipated ahead of time by the market, the most important interest rate in the economy is now a remarkable 525 bps above where it was prior to March 2022, when the Fed first hiked rates.

Finally, after a relentless liquidity squeeze, the market is anticipating that the end of the road may be nigh. For Bitcoin investors, this is music to their ears. Or at least that is what many in the sector are currently proclaiming. The only thing is, the true story may be a bit more convoluted. 

Bitcoin has moved with yield expectations

Firstly, it is unquestioned that the transition to a higher yield environment has been a death wish for crypto. As inflation became rampant last year and we transitioned to a new paradigm of tight monetary policy after a decade of essentially-free money, digital assets were crushed. Liquidity was sucked out of the entire system, hurting assets which reside on the long end of the risk spectrum the most. And that is certainly where crypto has set up shop in its brief existence thus far. 

The below chart shows this as well as any. Plotting the two-year treasury yield, which moves with rate expectations, on an inverted axis against the Bitcoin price shows how much the latter has dipped in line with the rise in yields. And we know that where Bitcoin goes, crypto tends to follow. 

The optimism being spouted about now is centred on the hope that much-coveted rate cuts are imminent. Yet there is reason to believe that this may still be premature, for a number of reasons. The bulk of Powell’s comments from Wednesday’s meeting can be dismissed as diplomatic answers structured to leave the Fed with as much optionality as possible going forward, but one admission was notable: the revelation that the Fed is no longer forecasting a recession.  

“So the staff now has a noticeable slowdown in growth starting later this year in the forecast, but given the resilience of the economy recently, they are no longer forecasting a recession,” Powell said. 

While this may sound like good news – and it is! – this also means that, perhaps counter-intuitively, Bitcoin may not have quite the boost behind it that it may have otherwise hoped for. The reason is that, if we go back to Economics 101, the Fed utilises rate cuts to stimulate a sluggish economy. If a recession is no longer anticipated, it is less likely these cuts will come.

The Federal Reserve has been extremely reluctant to cut rates in the last few decades unless explicitly forced to, such as when the economy went into a tailspin as the COVID pandemic suddenly emerged in March 2020. If we view the below chart, showing the fed rate all the way back to 1990, we see that without a recession, the administration has been cautious for the most part. And with inflation remaining higher than its 2% target, it feels ambitious to assume it will change that approach anytime soon. 

While rate hikes may be coming to an end, rate cuts don’t feel like they will transpire anytime soon. 

This thought is reinforced when digging into the numbers underlying this unique current macro situation. While the headline figure of 3% inflation is drawing all the attention, the core number is perhaps the better gauge; this strips out the volatile effects of food and energy and can be more relevant for the Fed’s policy decisions. Looking at this core number, it has dropped only 110 bps in the last year and remains at a stout 4.8%. This contrasts with a fall of 690 bps in the headline figure over the same period. 

Not to mention that with the way the CPI is structured as a YoY number, we are into the stage of the year where inflation was always going to fall. This is because there were such hot readings landing at this time last year, when energy prices were sky-high and inflation came within 10 bps of hitting double digits. These readings dropping out of the index creates a more dramatic reduction in the YoY number. 

While 3% may sound close to 2%, this difference also remains a chasm, should the Fed remain determined to get back to its original target. Jim Bianco, speaking to the On the Margin podcast this week, had a good way of explaining why this matters.

“The Fed would tell us that the neutral funds rate is half a percent above inflation…so if the long-run (inflation) rate is 3% (as opposed to 2%), the neutral rate is 3.5%, so they are 200 bps above that (at the current fed rate). When the yield curve normalises out again, it should be positive 150 bps – that is historically where it has been. 

With a 150bps spread on the yield curve, he concludes that the 10-year yield must be at 5% to be neutral. Currently, the 10-year yield is at 3.9%, meaning via Bianco’s summation, rates would need to come up 110 bps to hit the Fed’s notion of neutrality under a 3% inflation target regime. This illustrates how the journey to 2% remains important, should that still be the Fed’s target (which Powell has adamantly repeated it is). 

Lagged effects of monetary policy 

In addition to the inflation number, there is no getting around the fact that wage pressure remains high and unemployment is at 3.6%, hanging around the lowest mark in half a century. This, again, is great news for the overall economy, but will also spell concern in the Fed that inflationary pressure remains and the fight is not yet over. Cutting into this environment feels like a risk that Powell and co. are not in a position to take, and perhaps won’t be for longer than some anticipate. 

With monetary policy operating with such a notorious lag, and the fact this hiking cycle has been among the swiftest in modern history, it needs to be caveated that, while the Fed is determined to keep all options open, there genuinely is a lot of uncertainty. 

For crypto, this bears consideration amid the tangible excitement that has begun flowing through certain circles. Undoubtedly, this has been a tremendous run and the industry would have snapped your hand off if you offered them this position nine months ago, when FTX circled the drain and threatened to pull a chunk of the entire asset class down with it. But the battle has not quite been won yet, even if the tide has begun to turn. 

The post A temperature check on crypto as market eyes end of rate hiking cycle appeared first on CoinJournal.

The unending Dogecoin story and why Shiba Memu is a solid meme competitor

  • Shiba Memu is a self-marketing crypto project powered by AI

  • The entry in Shiba Memu happens Dogecoin is speculated for use in Twitter payments

  • The potential for Shiba Memu is huge due to the twin capabilities brought by AI and blockchain

Will Dogecoin (DOGE) finally be used as a form of payment on Twitter? Well, the speculations are back again, but before we get to it, Shiba Memu (SHMU) could be the ultimate meme you would like to explore. Combining AI and blockchain, Shiba Memu could be a time-ticking meme token waiting to explode and swallow its predecessors. The token is on presale and selling fast.

Speculations of Dogecoin use in Twitter payments are back!

This is an old story that redeems itself every day. Twitter owner Elon Musk has vehemently toyed with the idea of Dogecoin as the payment medium on Twitter. While sceptics might want to give up on Musk’s theatrics, the billionaire investor isn’t giving up any time soon.

Recently, Musk updated his Twitter bio with the Dogecoin (Ɖ) symbol, raising speculations over the longstanding question. The move was consequential as DOGE rose by double-digits. The meme token has now eclipsed Cardano by market cap. 

The gains in DOGE are not new. Meme cryptocurrencies have risen by more than four-digit percentages at the slightest of positive speculation. They have, in turn, generated enormous and quick bucks for investors able to capitalise on positive developments. Shiba Memu is positioned to ride the AI frenzy and become among the most sought meme cryptocurrencies.

What is Shiba Memu?

Shiba Memu is an AI-led meme crypto project that markets itself. The project will use AI-based software to write its own PR and self-promote on social networks. Shiba Memu can also learn from successful marketing strategies to improve its creative advertising.

Being AI-powered also means that Shiba Memu can work 24/7. It can crawl the web all day and night and find the best ideas in creative advertising. The Shiba Memu team believes this capability will enable it to perform the work of 100 marketing agencies combined. 

As such, Shiba Memu is made to be self-sustainable. It can deliver a unique investment opportunity beyond a meme label. In the future, the aim is to make Shiba Memu more intelligent and powerful.

What is the market potential of Shiba Memu?

Shiba Memu carries a lot of potential owing to the popularity of the meme token market. The total value of the meme market was $20 billion in early 2022, up from $0 in early 2020. 

But Shiba Memu isn’t your usual meme cryptocurrency. The token enters the scene when AI is the hottest thing in fintech. Times have shown what AI can do, and Shiba Memu capitalises on this trend. 

With the meme sector still recovering from a prolonged crypto winter, Shiba Memu could be a game-changer. It allows investors to bet on a token with huge price potential and benefit from the first-mover advantages.

 Is Shiba Memu a 10x investment?

Meme cryptocurrencies are an exciting asset class. The price movements can be wild, which positions Shiba Memu for potential sky-high prices. A price increase of 1,000% is just an underestimation, as we have seen meme tokens rise by bigger percentages. 

With the enthusiasm that Shiba Memu is generating, investors should consider it a more than 10x investment. A price jump could be unstoppable once a FOMO around the cryptocurrency kicks in. 

Shiba Memu’s unique presale

The Shiba Memu presale is unique and is happening fast. It will be an eight-week presale and will end with as much amount that is raised. 

The second thing is that the price of SHMU increases daily at 6 PM GMT. That means you spend less buying now than 24 hours later. By the time the presale ends, the token’s value will have doubled to $0.0244 from the initial price of $0.011125.

The post The unending Dogecoin story and why Shiba Memu is a solid meme competitor appeared first on CoinJournal.