
Bitcoin Cash price prediction as volatility and volume slumps

  • Bitcoin Cash, like other cryptocurrencies, remained in consolidation in July.

  • There are signs of rotation moving from digital currencies to stocks.

Bitcoin Cash (BCH) price had a difficult performance in July as the fear and greed index remained neutral at 50. The coin dropped to a low of $230 in July, down from the monthly high of $330.53. 

Rotation from crypto to stocks

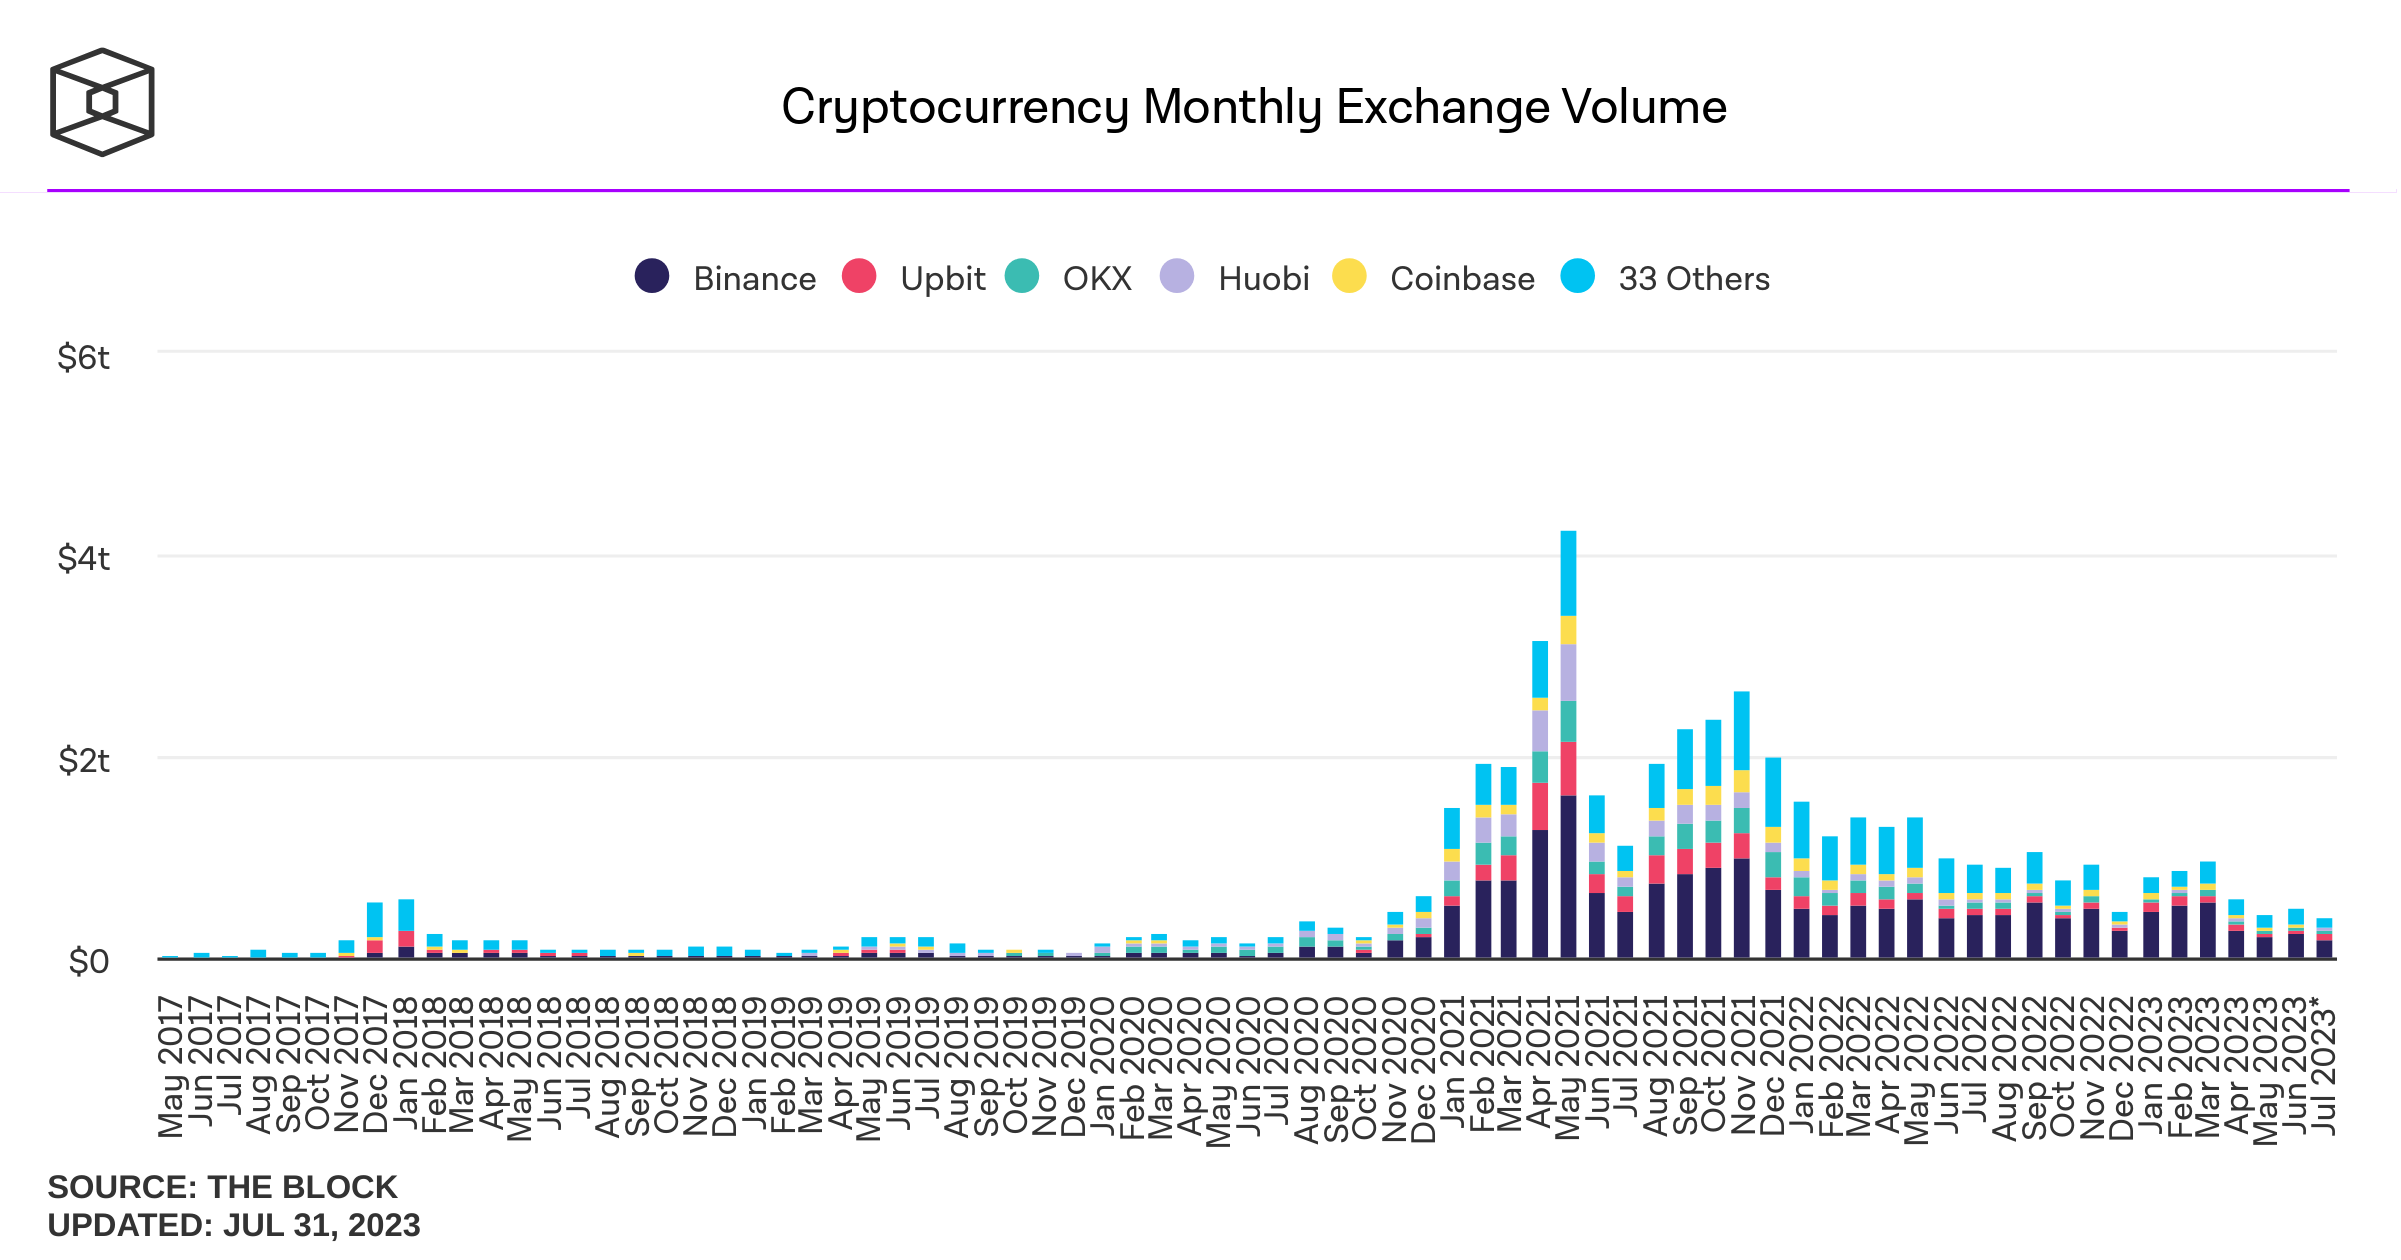
Bitcoin Cash price remained in a tight range as demand and volatility retreated. Data shows that the volume of cryptocurrencies traded in exchanges dropped sharply in July. This happened even after a number of important catalysts happened during the month.

For example, data published by the Bureau of Labor Statistics (BLS) showed that the America’s consumer price index (CPI) dropped from 4.1% to 3.0%. The closely watched personal consumption expenditure (PCE) index dropped from 4.0% to 3.1%. 

These numbers mean that the country’s inflation is falling at a faster pace than expected. As a result, investors believe that the Federal Reserve has completed hiking interest rates. It hiked them by 0.25% last Wednesday to the highest level in 22 years.

Another important crypto news in July was the partial victory by Ripple in its long-running case with the Securities and Exchange Commission (SEC). In her judgment, the judge ruled that XRP was not a financial security.

Therefore, Bitcoin Cash price likely retreated as investors moved from cryptocurrencies to stocks. The Nasdaq 100 index and S&P 500 indices surged to the highest level in months, with the former soaring by 42% this year. As a result, there is a likelihood that many crypto investors moved their funds to stocks.

Bitcoin Cash price prediction
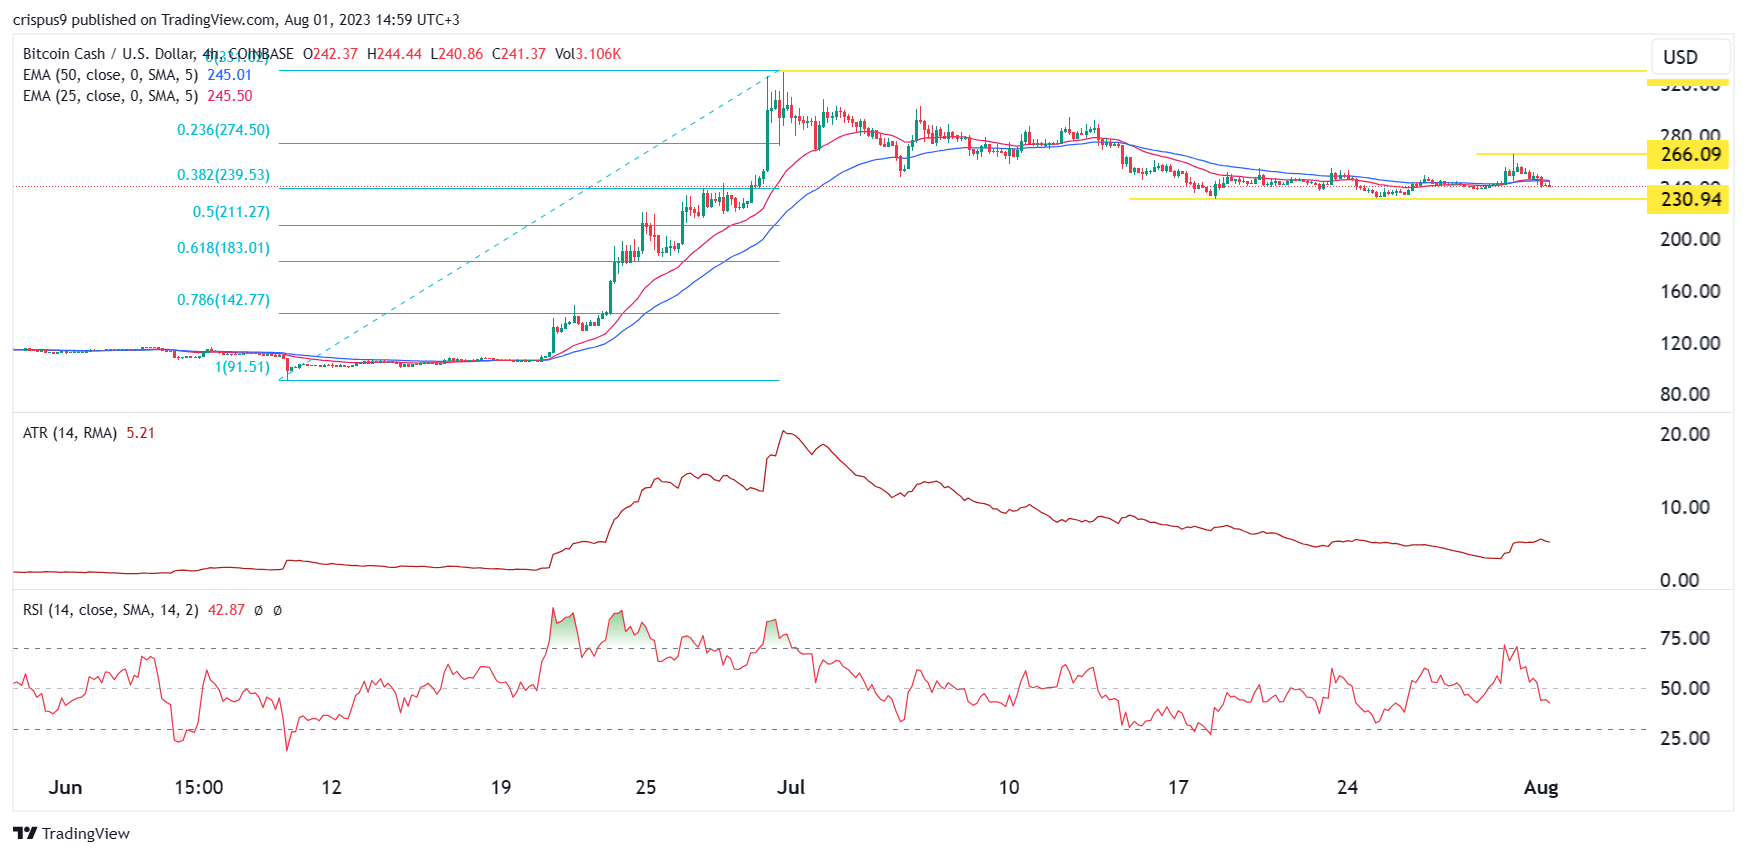
The 4H chart shows that the BCH price has moved sideways in the past few weeks. It has moved to the 50-period and 25-period moving averages. Bollinger Bands have narrowed. The coin has moved above the key support level at $230.94, the lowest level in July.

The Relative Strength Index (RSI) has moved below 50 while the Average True Range (ATR) has retreated. ATR is one of the most popular measures of volatility. 

Therefore, there is a likelihood that the indicator will remain in this consolidation phase in the coming days. A drop below the support at $230 in a high environment will push it to the next support at $200. A move at $266 will open the possibility of the Bitcoin Cash price rising to $300.

How to buy Bitcoin Cash

eToro

eToro is a multi-asset investment platform with more than 2000 assets, including stocks, ETF’s, indices, commodities and Cryptoassets. eToro offers over 60+ Cryptoassets to invest or invest in their CryptoPortfolio where investors can benefit from the accumulated growth of Bitcoin, Ethereum, XRP, Litecoin and other leading cryptocurrencies. eToro users can connect with, learn from, and copy or get copied by other users.

Buy BCH with eToro today

Bitstamp

World’s longest-standing crypto exchange. Since 2011 Bitstamp has been providing a secure and reliable trading venue to over four million individuals and a range of institutional partners.

Buy BCH with Bitstamp today

The post Bitcoin Cash price prediction as volatility and volume slumps appeared first on CoinJournal.
Crypto’s correlation with stocks rising again following temporary deviation


Key Takeaways

  • Crypto had moved in line with stocks and other risk assets throughout the interest rate tightening cycle
  • This relationship weakened in June amid the crypto regulatory crackdown
  • The correlation has recently picked up again, however
  • Going forward, relationship may change again as the market anticipates the tightening cycle is coming to a close

We know that within the digital asset space, the different cryptocurrencies are highly correlated. As a generalisation, it is fair to say that many altcoins tend to trade like levered bets on Bitcoin. 

Going beyond the asset class and assessing correlations with other asset types becomes more interesting. One of the most intriguing trends to track is the correlation between Bitcoin and stocks. If we want to assess Bitcoin through a macroeconomic lens, its relationship with other asset classes is of vital importance. 

The last eighteen months have thrown this relationship into a new light, as correlations have been extremely high amid one of the fastest interest rate tightening cycles in recent history. With liquidity sucked out of the economy, risk assets were hammered last year, including Bitcoin. 

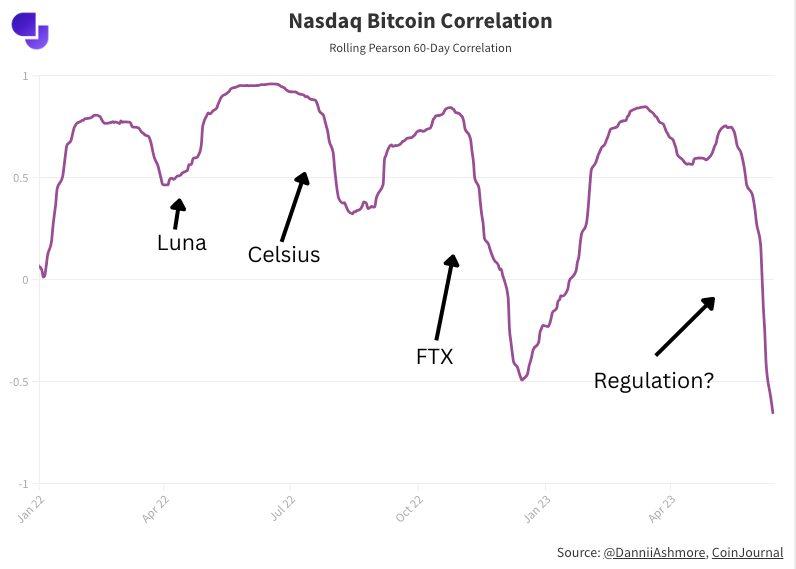
Compared to the tech-heavy Nasdaq, Bitcoin’s correlation has been persistently high throughout this period, bar a few noticeable instances. As displayed on the below chart from an analysis we compiled six weeks ago, the collapses of Luna, Celsius and FTX saw deviations in this relationship. 

These explain themselves, as dramatic crypto-specific episodes that had no effect on stocks. However, the more recent deviation was bigger than any: coming in June amid the regulatory crackdown (chart is taken from June 15th, a week after the Binance and Coinbase lawsuits). 

In fact, this deviation brought the Nasdaq’s correlation with Bitcoin to a five-year low. If we now re-run this chart, we see the correlation has picked back up again, rising to 0.5 and trending upwards.
 

This highlights what we already knew: the deviation is only temporary. It came following a month where the Nasdaq jumped 10% off softer forecasts around the future path of interest rate hikes, while Bitcoin fell 9% over the same time period as lawmakers tightened their squeeze on the industry, suing the two largest exchanges and confirming several tokens constituted securities.  

The climate has picked up for crypto since. Ripple won an important case (or, partially won, but the result was undoubtedly positive for the space), while a slew of spot ETF applications have also served to increase optimism. 

While the deviation was always going to be temporary, going forward in the medium-term, things could get more interesting. This is because, finally, the market is anticipating that the majority of interest rate hikes are in the rearview window, with perhaps only one more still to be endured, if even. 

This could release the shackles which have been around Bitcoin’s ankles, and it remains to be seen how the asset will henceforth move in relation to the stock market. We know that the correlation picked up as soon as the Federal Reserve began hiking interest rates; correlations go to 1 in a crisis, and there is a flight to quality – risk assets suffer in that scenario, and that is exactly what we saw. 

There is every chance that both stocks and Bitcoin will continue to trade in tandem, but if/when this tightening cycle ends, it will at least give the market a fresh opportunity to trade them whilst global liquidity is not being pulled off the table. 

Regardless of the relationship between the duo, the below chart shows just how dependent Bitcoin has been on yields – the two-year treasury yield, plotted on an inverse scale, has moved exceptionally closely with Bitcoin, ever since the latter’s all-time high in November 2021. 

How will Bitcoin’s relationship with gold change?

It is Bitcoin’s relationship with gold that provides an equal amount of intrigue, given the former’s designs on becoming some sort of digital equivalent of the latter. Should Bitcoin become a store of value, it will need to become a little more boring with regard to price movements – something gold is well known for. 

However, correlation between the two assets has dipped, moving in the opposite direction to that of stocks. From rising markedly this year, it has fallen sharply in the last month. 

If Bitcoin is to achieve what so many want to do – become an uncorrelated asset capable of offering a portfolio hedge properties – it must flip the script here. Its relationship with stocks will need to loosen, while it will need to get closer to the way gold trades. 

Having said that, Bitcoin has been around only 14 years, and has traded with reasonable liquidity for far less than that. It is still finding its feet, and it remains early – certainly compared to gold, which has been around for thousands of years. 

The post Crypto’s correlation with stocks rising again following temporary deviation appeared first on CoinJournal.

Bitcoin volatility at three-year low as crypto markets lull


Key Takeaways

  • Crypto volatility has been dropping all year, with Bitcoin’s volatility now at three-year lows
  • Volume is also dropping, as the calm markets are not welcomed by traders
  • Despite downward-trending volatility, crypto remains highly volatile when compared to other asset classes

Crypto markets are known for violent volatility, capable of both spiking and collapsing in the blink of an eye. 

Thus far this year, however, that hasn’t been the case. Volatility has been trickling steadily downward across the space. Assessing the realised volatility of Bitcoin over a rolling one-month window, the metric is currently at a three-year low. 

This comes despite Bitcoin having had a bumper year thus far, the asset currently up 76%, treading water around the $30,000 mark. In the past, Bitcoin has oscillated wildly, but this run-up from the low of $15,500 late last year has been distinguished by a steady climb rather than the turbulent ups and downs we have come to expect. 

The pattern is not unique to the world’s biggest crypto, either – volatility is falling across the board. The easy way to illustrate this is by looking at Ether. Historically, the price of ETH has been more volatile than BTC, but the divergence has narrowed this year, and Ether is now trading with similar volatility to its big brother. 

This relative calm in crypto markets is good on one level, given one of Bitcoin’s most-cited criticisms is its extreme volatility, which most agree it will need to overcome should it ever take the status of a reputable store of value. 

Not everyone is a winner, though. Traders rely on volatility and hence these serene times are not exactly a boon. If we look at spot trading volume, the drawdown has been steep. Granted, there are myriad factors at play here, including regulation, a drawdown in prices, lockdowns ending, scandals (FTX and the SEC lawsuits) and so on, but the lack of volatility is not helping. 

The below chart from The Block shows quite how far spot volume has fallen. 

Even derivatives trading volume, which had been more stout, has fallen off since April – likely a better gauge for traders than assessing spot volume. Liquidity is not as much of a concern in derivatives markets as it has become in spot markets, but the last few months have begun to see some thinning out there, too. 

While the falling volatility is notable, it should be noted that crypto remains a league above trad-fi markets with regard to this metric. Even this three-year low still translates to an annualised volatility of 25% for Bitcoin, which would not be deemed low-risk by any stretch of the imagination. 

To put this up in lights, comparing Bitcoin to gold is always illustrative. Gold is the store of value which has been around for thousands of years, the shiny metal known for its inflation-hedging abilities and lack of correlation to risk assets. For many, Bitcoin’s vision is to claim the title of some sort of digital gold. 

The below chart displays the current gulf between these assets – even after the dampening down in crypto volatility this year, it’s on a completely different planet to gold. 

Alternatively, one can simply compare the daily returns of the assets, which conveys the same thing. 

Thus, while crypto volatility is currently sluggish, it has a long way to go before it matches gold. More importantly, there is no guarantee that this volatility will stay low. Quite the opposite – given the low liquidity in the space, less capital is needed to move crypto markets than has been the case previously. 

In light of this, it feels like the downward trend in volatility (exacerbated in the last couple of months by a classic summer lull in trading) should return. Not to mention the fact that with the interest rate hiking cycle coming to a close, markets could be at an inflection point. It is always hard to predict the future in crypto, but it feels unlikely that digital assets’ volatility will stay at these uncharacteristically low levels for long. 

The post Bitcoin volatility at three-year low as crypto markets lull appeared first on CoinJournal.

BNB/USD vulnerable as a bearish flag formation points to a move below $200

  • BNB/USD forms a possible bearish flag pattern
  • The US dollar strength is not responsible for the BNB/USD bearishness
  • $200 provides support for now

Bitcoin rallied in 2023 and holds onto its gains. Most other major cryptocurrencies did so too, but some exceptions exist. 

One is Binance Coin (BNB). 

Sure enough, it rallied at the start of the year, following Bitcoin’s lead. But then it gave up all of its gains – and some more. 

One cannot blame the US dollar’s strength as the cause for the BNB/USD decline. After all, the dollar’s strength is not visible in other cryptocurrencies. 

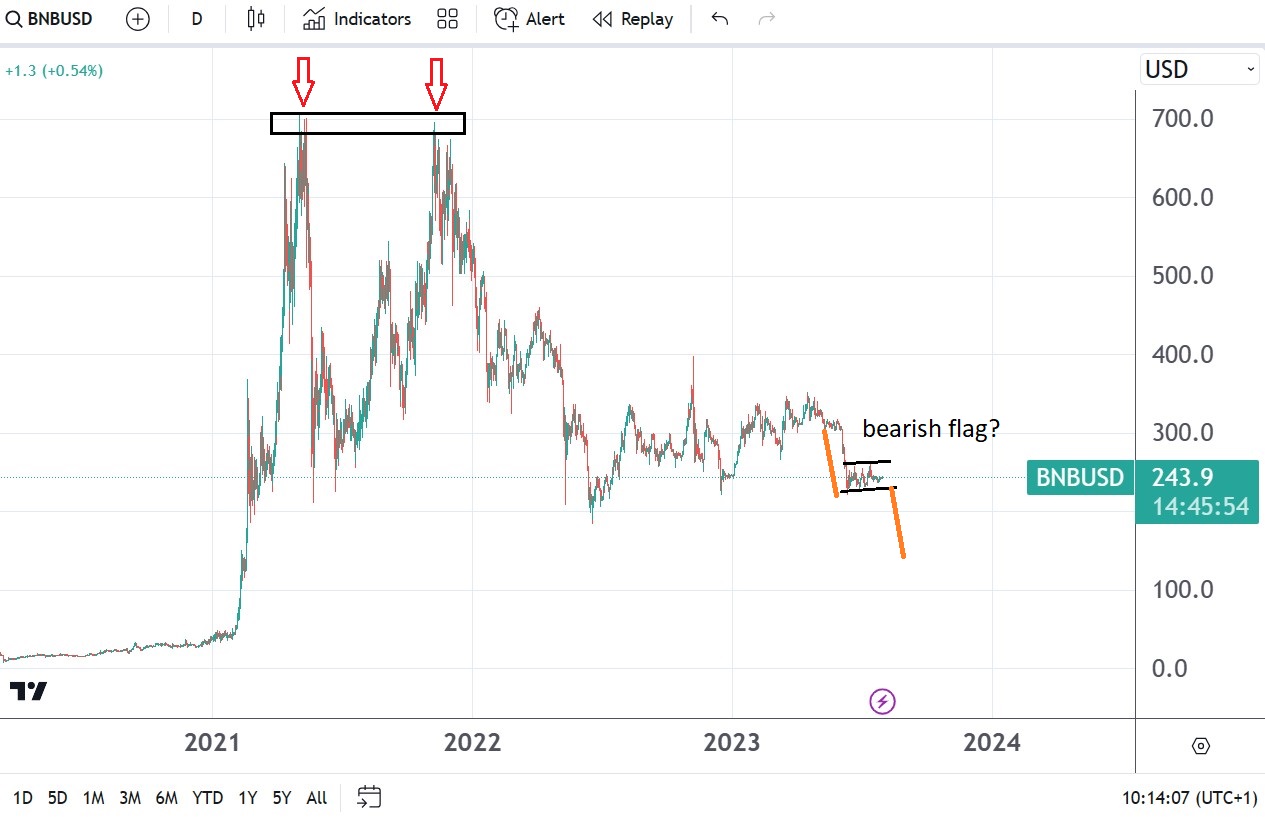
Instead, it appears to be the Binance Coin that trades with a bearish tone. That is particularly true if one looks at the technical picture, which shows the bearish pressure building as the market nears the $200 support level. 

Binance Coin chart by TradingView

A bearish flag pattern suggests that BNB/USD will break the $200 support level

A bearish flag pattern is a continuation pattern forming in a downtrend. The consolidation area follows a steep decline, and the breakout or the measured move equals the distance that the market traveled prior to the consolidation. 

If, indeed, BNB/USD formed a bearish flag pattern, then the support in the $200 area should give way. The pattern’s measured move, seen in orange above, points to $150 and lower. 

What should worry investors is the inability of the market to bounce while other cryptocurrencies hold near their yearly highs. It points to other factors weighing on the market, different than the US dollar’s strength. 

The post BNB/USD vulnerable as a bearish flag formation points to a move below $200 appeared first on CoinJournal.

ETH/USD price forecast as July comes to an end

  • Ethereum is consolidating around the yearly highs
  • $2,000 proves to be stiff resistance
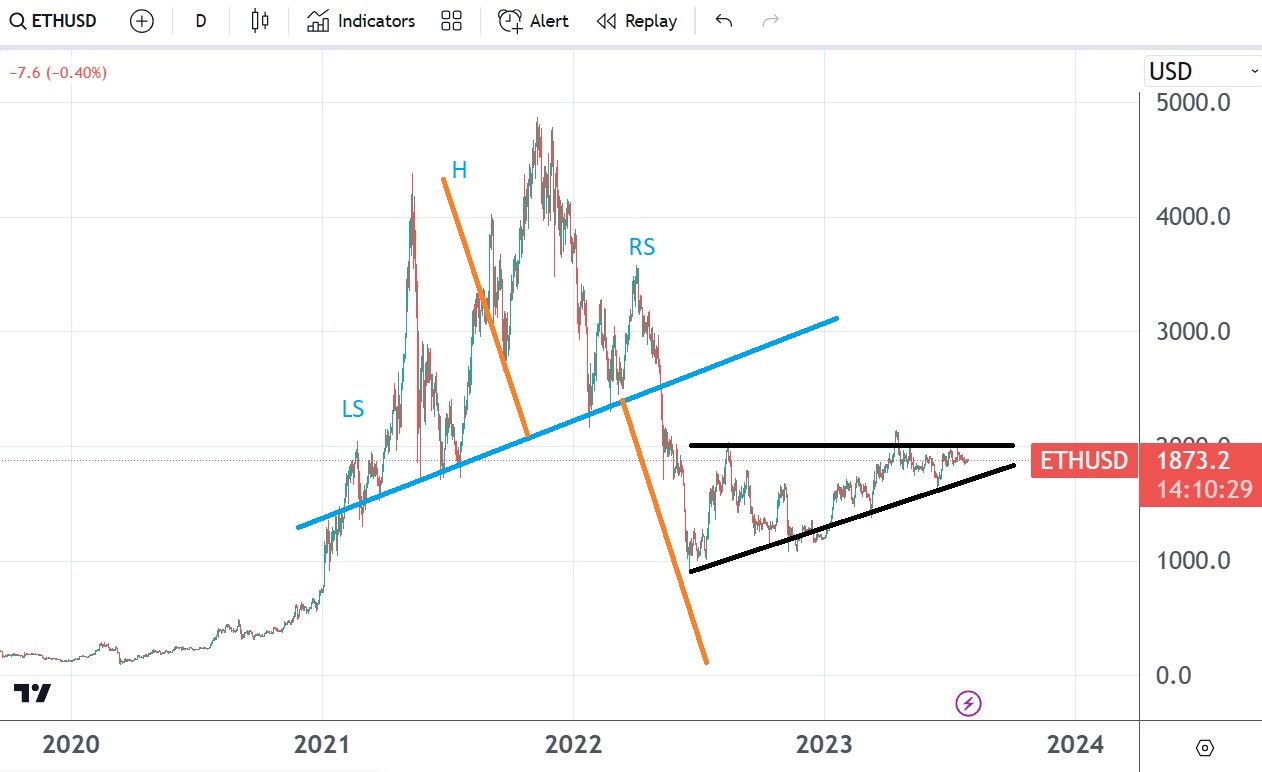
  • ETH/USD price action holds between a $1,000 range since May 2022

There is only one trading day left in July, and the cryptocurrency market is consolidating. That is particularly true of major cryptocurrencies such as Bitcoin or Ethereum, as they both hover around their yearly highs against the US dollar. 

Ethereum found strong resistance at the $2,000 area in 2023, just as it found strong support at $1,000 last year. The question now is whether resistance holds and the price will be sent back to $1,000? Or will bulls manage to push over resistance, and the rally will continue in the last months of the year? 

ETH/USD remains bullish while the price holds above $1,000

The rally in the cryptocurrency market seen in 2023 triggered enthusiasm among cryptocurrency investors. However, without more follow-through, the bullish sentiment will dissipate soon. 

Ethereum chart by TradingView

A quick look at the chart above reveals a $1,000 range since May 2022. More precisely, the market moved between $1,000 and $2,000, clearly with an upside bias but failing to make a meaningful break higher. 

Since touching the $1,000 support level in 2022, ETH/USD started a series of higher highs and higher lows, typical in bullish formations. Because the higher lows formed against horizontal resistance, it looks like the market builds energy to break higher. However, the bullish bias should hold only if the price does not break the higher lows series. 

If it does, the focus suddenly turns to the $1,000. A clear break there brings back the previous head and shoulders pattern with a measured move much lower than $1,000. 

The post ETH/USD price forecast as July comes to an end appeared first on CoinJournal.