Filecoin price prediction: is it safe to buy the FIL dip?

  • Filecoin price remained under intense pressure this week.

  • The coin has plunged to the lowest level since June 10th.

  • The developers introduced slasher and lotus disputer.

Filecoin price remained under intense pressure following last week’s crash. The token was trading at $3.37 on Tuesday, lower than last month’s high of $4.93. Its market cap has slipped to more than $1.5 billion.

Latest Filecoin news

Filecoin, the giant blockchain network for the storage industry, introduced two important features on Monday. In a statement, they launched Lotus Slasher, a feature that will improve network security and integrity.

Lotus slasher look for consensus faults where block producers engage in malicious activities. When the network detects these activities, it will fine the producer by reducing the offender and rewarding the reporter.

The other product was Lotus Disputer, where disputers will be able to challenge and verify proof of storage and slash providers who submitted invalid WindowPosts in the network.

The goal of these products is to strengthen the ecosystem by aligning incentives and allowing the community to self-police.

For starters, Filecoin is a leading project that is in the storage and cloud computing industry. The network makes it possible for users to provide storage to other people and companies in a decentralized way.

Filecoin has also introduced new features that help them do computing. These features aim to position it as the best alternative to Amazon’s AWS and Microsoft Azure. Also, Filecoin launched FVM, a platform that makes it possible for developers to launch dApps in its ecosystem.

Filecoin price prediction
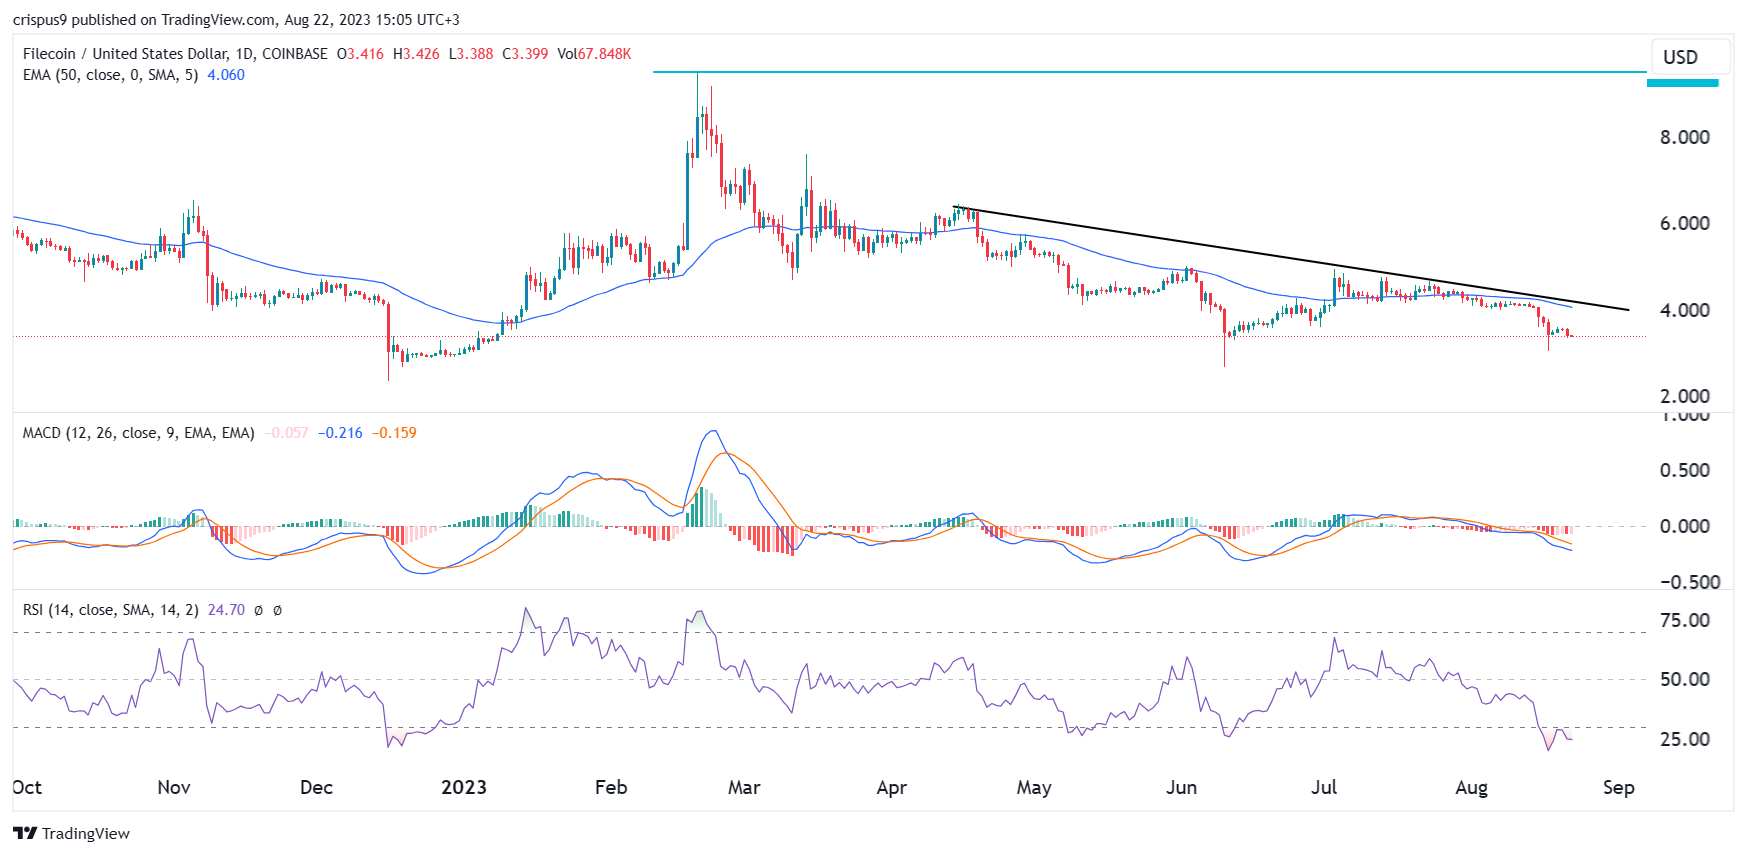
The daily chart shows that the FIL price has been in a bearish trend after peaking at $9.49 earlier this year. The decline gained steam after last week’s crypto crash, which pushed it to the lowest level since June 10th. Filecoin has dropped below the descending trendline shown in black.

It has also moved below the 50-day moving average while the Relative Strength Index (RSI) and the MACD have drifted downwards. Therefore, the coin will likely have a bearish breakout, as sellers target the key support at $2.80, the lowest level on June 10th.

How to buy Filecoin

eToro

eToro is a multi-asset investment platform with more than 2000 assets, including stocks, ETF’s, indices, commodities and Cryptoassets. eToro offers over 60+ Cryptoassets to invest or invest in their CryptoPortfolio where investors can benefit from the accumulated growth of Bitcoin, Ethereum, XRP, Litecoin and other leading cryptocurrencies. eToro users can connect with, learn from, and copy or get copied by other users.

Binance

Binance has grown exponentially since it was founded in 2017 and is now one of, if not the biggest cryptocurrency exchanges on the market.

The post Filecoin price prediction: is it safe to buy the FIL dip? appeared first on CoinJournal.
Shiba Memu token is thriving despite the painful crypto sell-off

  • Bitcoin and other cryptocurrencies plunged hard last week.

  • This decline happened amid a sense of fear in the financial market.

  • Shiba Memu token sale has gained steam as the developers raised over $2.1 million.

Cryptocurrency prices had their worst performance this year as Bitcoin plunged from $29,000 to below $26,000. Most coins and tokens were deeply in the red as demand waned and a sense of fear spread in the market. Despite this retreat, Shiba Memu’s token sale continued, with the developers raising over $2.18 billion.

Why did cryptocurrencies slip?

There are several reasons why most cryptocurrencies plunged last week. First, the coins dropped because of a potential shakeout. A shakeout refers to a situation where a financuial asset dips sharply and then resumes the bullish trend. 

The most recent shakeout happened when Bitcoin fell from $25,000 to $19,000 and then resumed the bullish comeback to the year-to-date high of $32,000. It is still unclear whether the current decline was a shakeout or the start of a new bear run.

Second, Bitcoin dropped because of technical reasons. Bitcoin formed a double-top pattern at $32,000. In price action analysis, this pattern is usually a bearish sign. Therefore, from these technicals, there is a likelihood that the coin will continue falling.

Third, a sense of fear spread in the market as evidenced by the stock and bond market sell-off. Bond yields in most developed countries jumped, with US 10-year rising to 2012 highs and the 30-year reaching the 2007 highs. Bond yields move inversely to prices.

Further, cryptocurrency prices dropped because of the Chinese economy, which is going through the deepest slowdown in years. Data published last week showed that most parts of the economy like retail, industrial production, and fixed asset investments are slowing at a fast pace. China is still an integral part in the crypto industry, accounting for 20% of Binance volume.

Shiba Memu is still thriving

Shiba Memu, an upcoming cryptocurrency that combines aspects of meme coins and artificial intelligence, is thriving. Data available in its website shows that the developers have raised over $2.1 million from investors around the world. They have done that by raising over 68.1 million tokens in the past two months.

Shiba Memu’s token sale is unique because the price of the token is raised every days. This means that investors who bought the token on the first day have seen their value jump sharply even without doing anything. 

Shiba Memu is thriving because of the industries that the developers are targeting. AI has become the fastest-growing industry this year, helping to push Nvidia’s market cap to over $1 trillion. Similarly, meme coins have thrived, with some tokens like Pepe transforming some people into instant millionaires.

With the rising hype, there is a likelihood that the Shiba Memu price will also jump when it debuts in centralized and decentralized exchanges soon. You can buy the Shiba Memu token here.

The post Shiba Memu token is thriving despite the painful crypto sell-off appeared first on CoinJournal.

Over a billion dollars liquidated in crypto’s worst day since FTX


Key Takeaways

  • Last week saw crypto suffered its worst 24 hours since FTX as over one billion dollars in derivatives were liquidated on Thursday
  • Derivative volume outstrips the extremely low spot volume, with cascading liquidations having the potential to exacerbate price moves
  • Volatility was sparked by sell-off in the bond market
  • Developments re-affirm how vulnerable Bitcoin is in the short-term to the highly unusual macro climate 

Following an extended period of rest in the crypto markets, the beast re-awakened last week. Crypto markets plummeted late Thursday and early Friday, led as always by Bitcoin. The world’s largest cryptocurrency shed 7% in what amounted to the largest one-day drop since the spectacular collapse of FTX last November. 

The year 2023 has been characterised thus far by the unusual fact that crypto’s rise has been slow and steady. Aside from a jump in March amid the regional bank crisis, Bitcoin has been perceptively devoid of the usual spikes and freefalls. 

The Bitcoin price displays this clearly in the next chart, as well as Friday’s trip south.

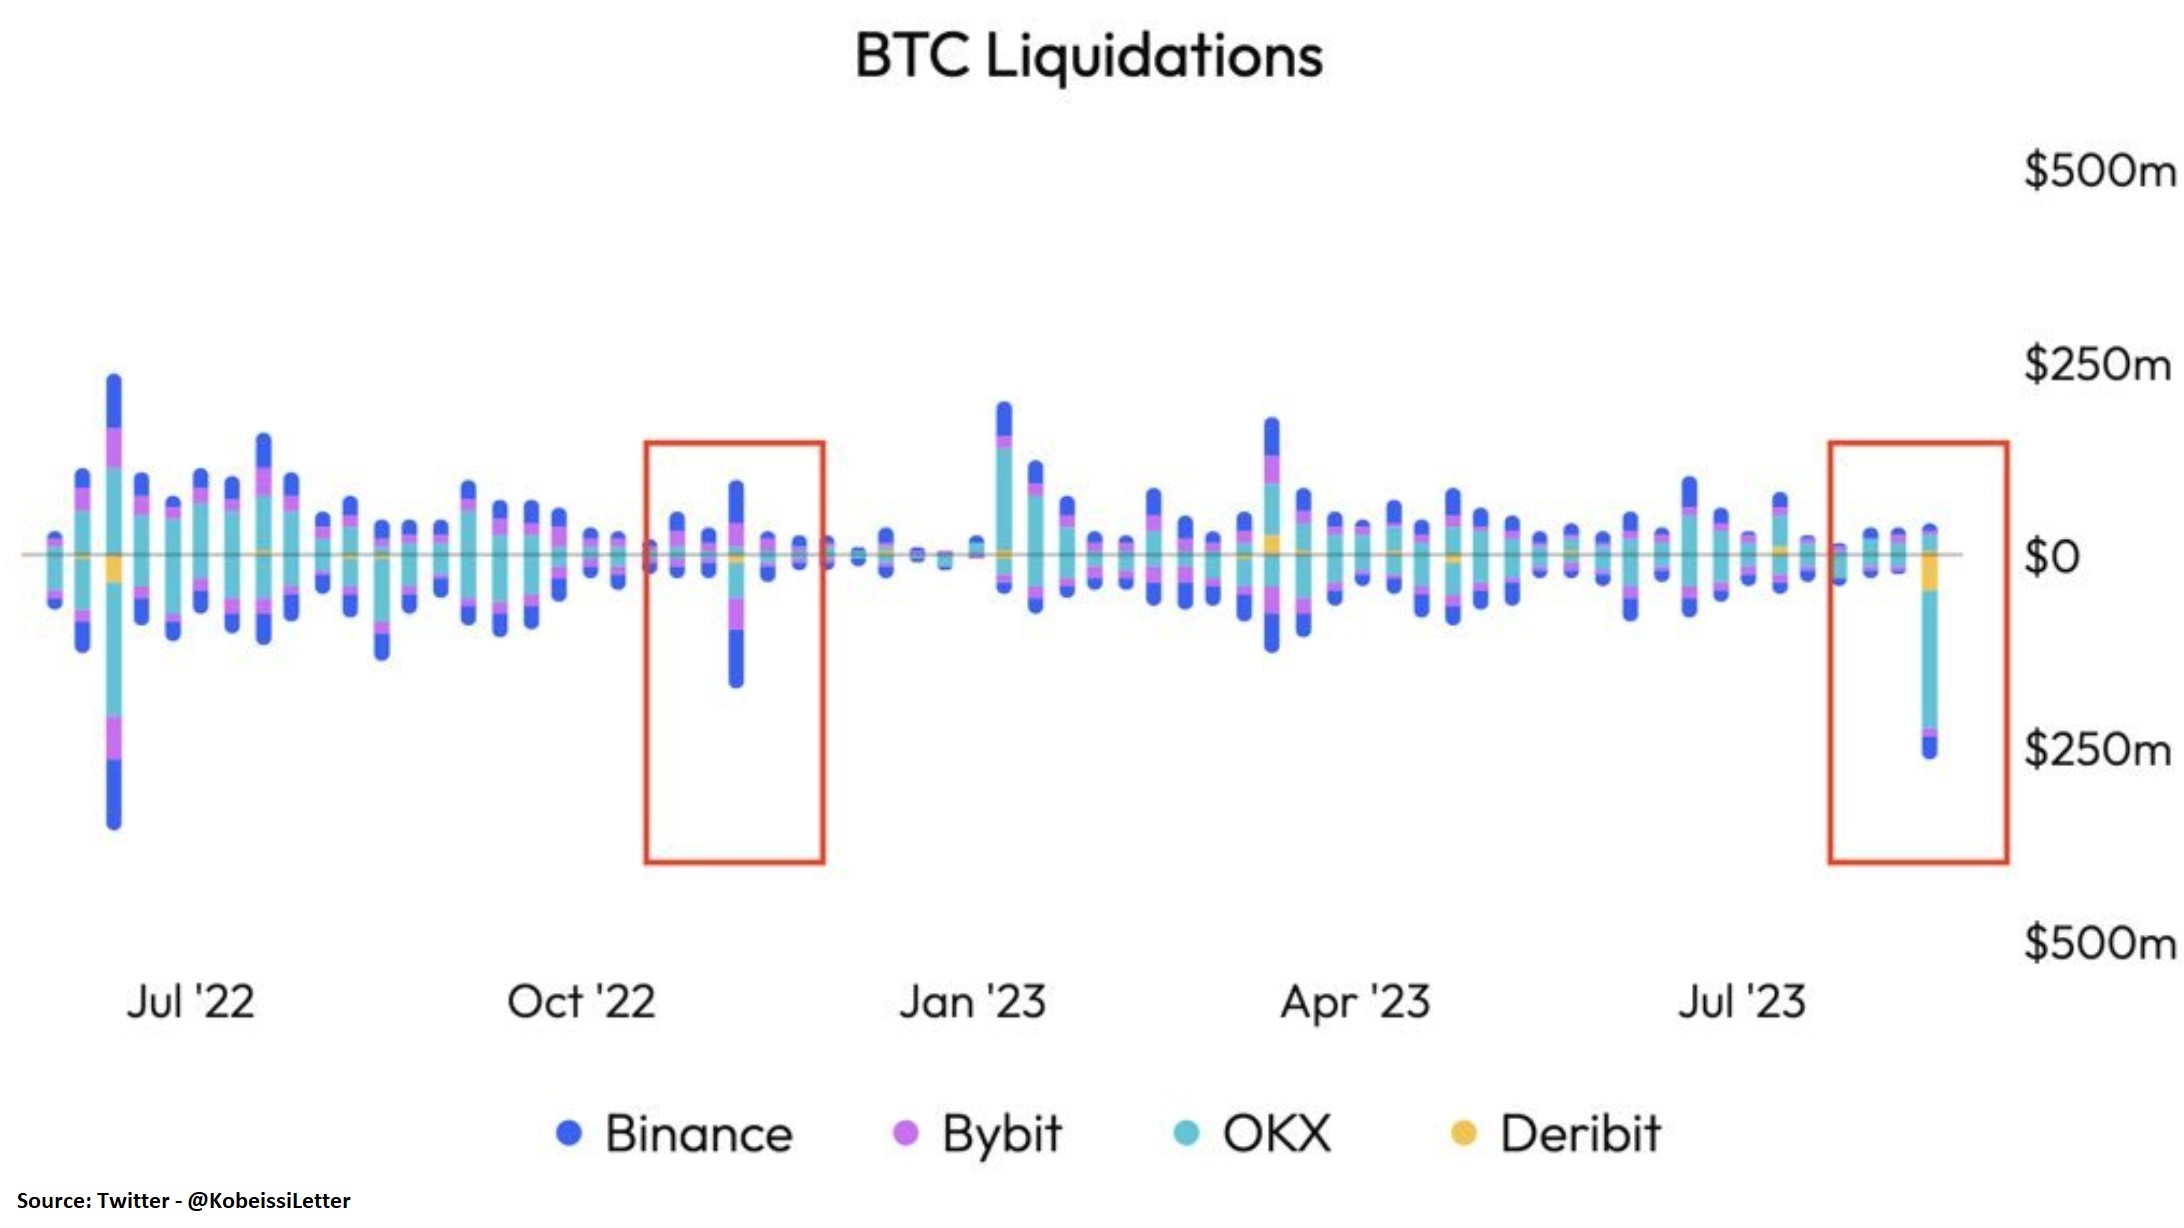
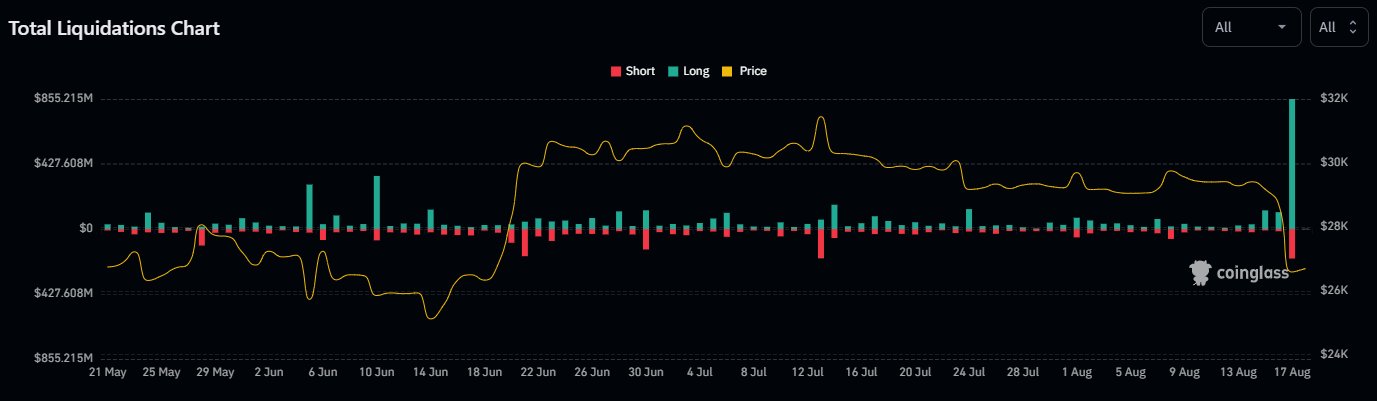
Digging further into last week’s price drop shows that, remarkably, Bitcoin fell 8% in just ten minutes from 9:35 PM GMT on Thursday evening. Looking at data from Coinglass, this contributed to a surge of liquidations. All in all, over one billion dollars was liquidated in what amounted to the biggest day of liquidations since the FTX demise (anytime the phrase “since FTX” is used in crypto, it rarely spells good news). 

The flood of liquidations highlights how much greater the volume was in derivatives markets than spot, with the latter remaining extremely thin. Order books have been perceptibly shallow ever since Alameda evaporated amid the FTX debacle (liquidity was thin even before then). 

What caused the sell off?

The underlying cause of the volatility was a sell-off in the bond market, with yields spiking to multi-year highs. Yields on long-term US government debt neared their highest level since 2007, UK 10-year gilts rose to their highest yield since 2008, and Germany’s 10-year bund reached its highest yield since 2011. 

Higher yields spell trouble for risk assets, as we are well aware by now, with Bitcoin sent tumbling amid the tightening monetary environment last year. The recent move was borne out of investors betting that high interest rates will persist for longer than previously anticipated, or further hikes may not be as improbable as previously expected. 

The inverse relationship between Bitcoin and yields has been strong, demonstrated in the below chart. Hence, Bitcoin’s drop is not surprising in the context of the developments in the bond market last week. 

The sell-off reaffirms how vulnerable Bitcoin is to a macro situation that continues to perplex – high but falling inflation, while high interest rates contrast with record-low unemployment and relatively resilient economic data. 

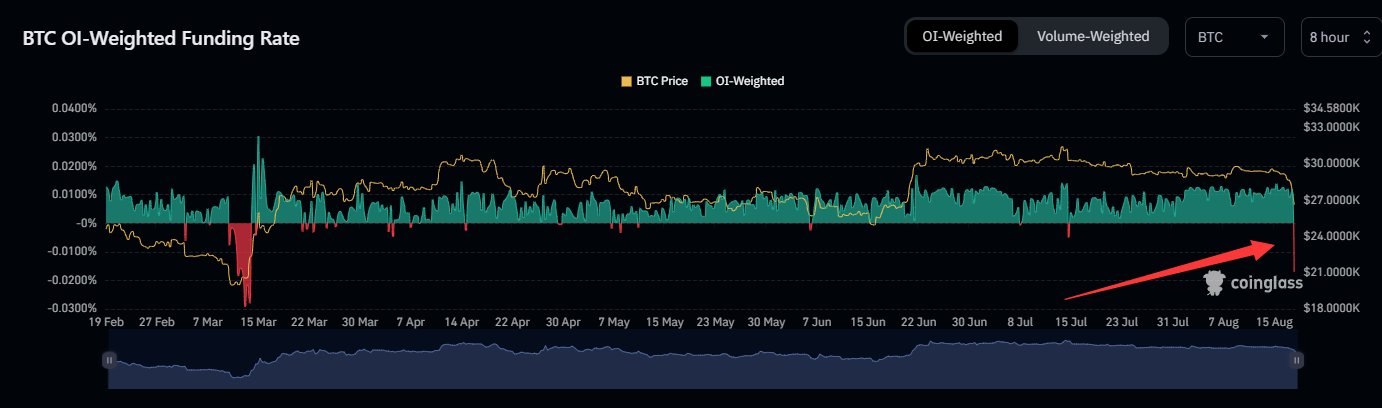
Getting back to the derivatives market, the shift was further evident by looking at funding rates, with the Bitcoin OI-weighted funding rate dipping below -0.01% for the first time since March. 

Finally, negative funding rates and freefaling open interest returned. It took a while, but volatility has returned.

What next for crypto?

What this spells going forward is up for debate. Some analysts affirm this is a mere blip, a drop sparked by complacent overleverage following a period of calm that felt like forever. A slight increase in hawkish sentiment going forward won’t ultimately change much, they argue, for an economy which seems increasingly ambitious about achieving a soft landing. 

On the other hand, some fear there could be a return to 2022-like conditions. While that may seem extreme, there is every change there is a recalibration away from the borderline-celebratory stance that interest rate hikes were complete and the soft landing was already guaranteed. 

If that were the case, this could mark the end of the bear market rally for crypto. Few assets are as sensitive to global liquidity as Bitcoin is, meaning a reversion towards the tightening seen last year would undoubtedly spell red candles on price charts.

This would be getting ahead of oneself, however. The macro climate remains largely unprecedented and very challenging to predict. Even the Federal Reserve’s language betrays this, with some notable see-sawing in recent meetings. 

Last Wednesday, meeting minutes said that there are “significant upside risks to inflation, which could require further tightening of monetary policy”. Going back to the meeting in July, minutes say that the Fed believed inflation was falling and risks “titled to the downside”, with Jerome Powell asserting that “given the resilience of the economy recently, (the Fed is) no longer forecasting a recession”. 

While these are not necessarily conflicting – one can have inflation and tightening without a recession, it is just quite difficult (but where we have been living for the last eighteen months) – it does highlight how uncertain the whole climate is. 

Bitcoin is again caught in the crossfire, a risk asset subject to the whims of the wider market as it grapples with this fast-changing environment. 

The post Over a billion dollars liquidated in crypto’s worst day since FTX appeared first on CoinJournal.

Bitcoin price tumbled last week on SpaceX liquidating stash

  • SpaceX’s Bitcoin liquidation triggered a massive drop in Bitcoin’s price
  • A double top pattern suggests more weakness might come
  • The measured move hints at further downside into the $20k area

Bitcoin price failed at the $30k level twice this year. After rallying from $16k, it formed a possible double top pattern that should worry investors.

The latest sign of weakness came last week. News that Elon Musk’s SpaceX liquidated its entire Bitcoin stash sent the price lower. More precisely, SpaceX sold Bitcoin worth $373 million.

It was one of the largest daily liquidations by volume in history. In just 20 minutes, Bitcoin price crashed by more than 7% on outflows bigger than during the FTX collapse.

SpaceX sold its Bitcoin holdings after Tesla did the same last year. More precisely, Tesla sold last year 75% of its Bitcoin holdings.

So what does it mean for Bitcoin price, and can the market bounce back?

A double top pattern might have formed at $30k

Since the start of the year, Bitcoin price have doubled. The rally was so powerful that it triggered a wave of enthusiasm among cryptocurrency investors.

But the failure to hold above $ 30k led to the formation of a possible double top pattern.

Bitcoin chart by TradingView

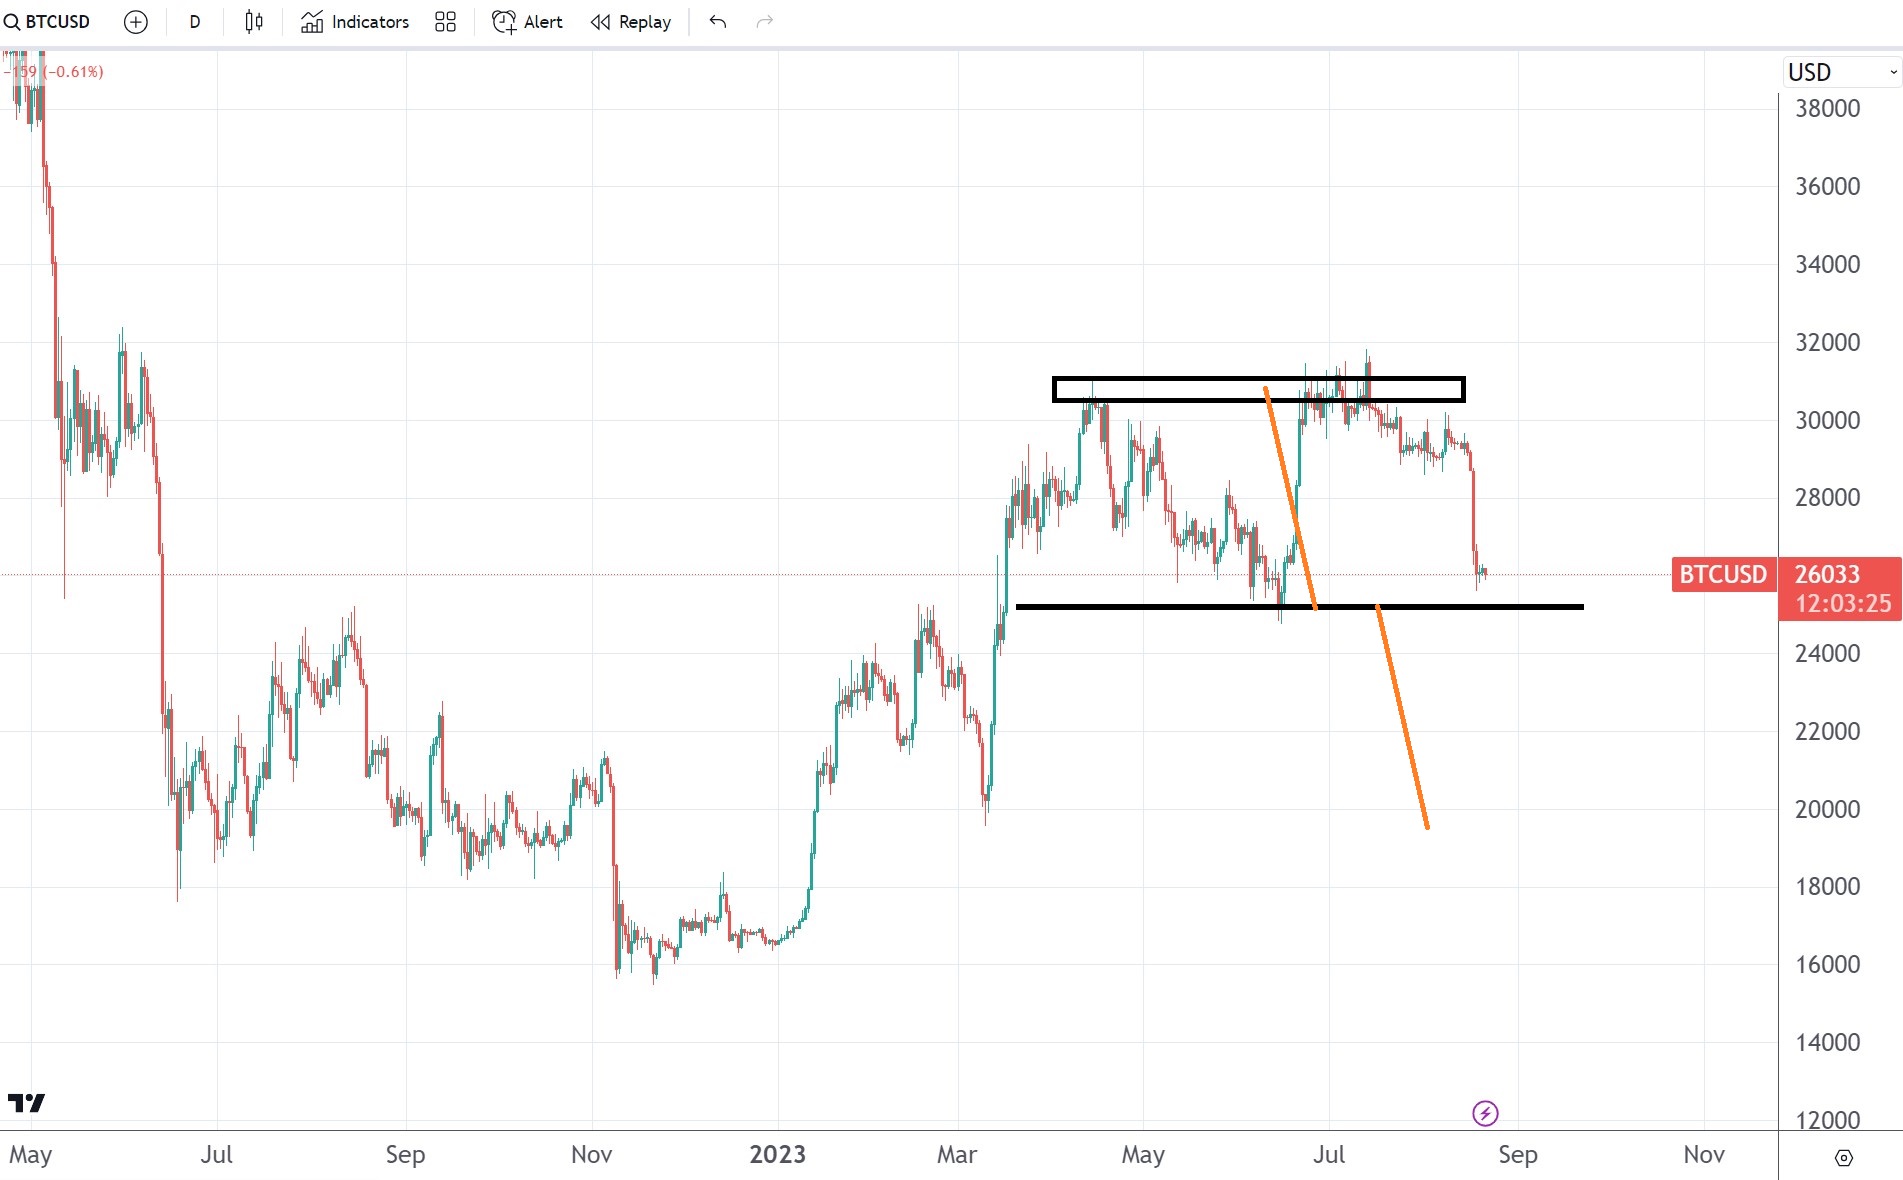
A double top is a reversal pattern with a measured move equal to the distance from the top to the neckline, projected from the neckline. The chart above shows the two tops formed at the $30k area and the neckline at the $25k area.

Therefore, the measured move equals $5k and, if projected from the neckline, suggests that Bitcoin might see $20k sooner rather than later.

The only way for bulls to get back in control is for Bitcoin to break above the double top area (i.e., $30k). For now, however, the bias is bearish, and the focus is on a potential bearish breakout below the neckline.

The post Bitcoin price tumbled last week on SpaceX liquidating stash appeared first on CoinJournal.

Crypto price predictions: Akash Network, THORChain, Bitcoin SV

  • Cryptocurrencies dipped sharply as bond yields surged.

  • Most coins attempted to bounce back, in what could be a dead cat bounce.

Cryptocurrencies stabilized on Saturday after going through one of their worst performance in the past few months. After consolidating at $29,000 for weeks, Bitcoin plunged to $25,000. Sei, one of the newest tokens, plunged by over 80% from its all-time high. This article will look at some of the top-performing tokens like THORChain, Bitcoin SV, and Akash Network.

Akash Network price prediction

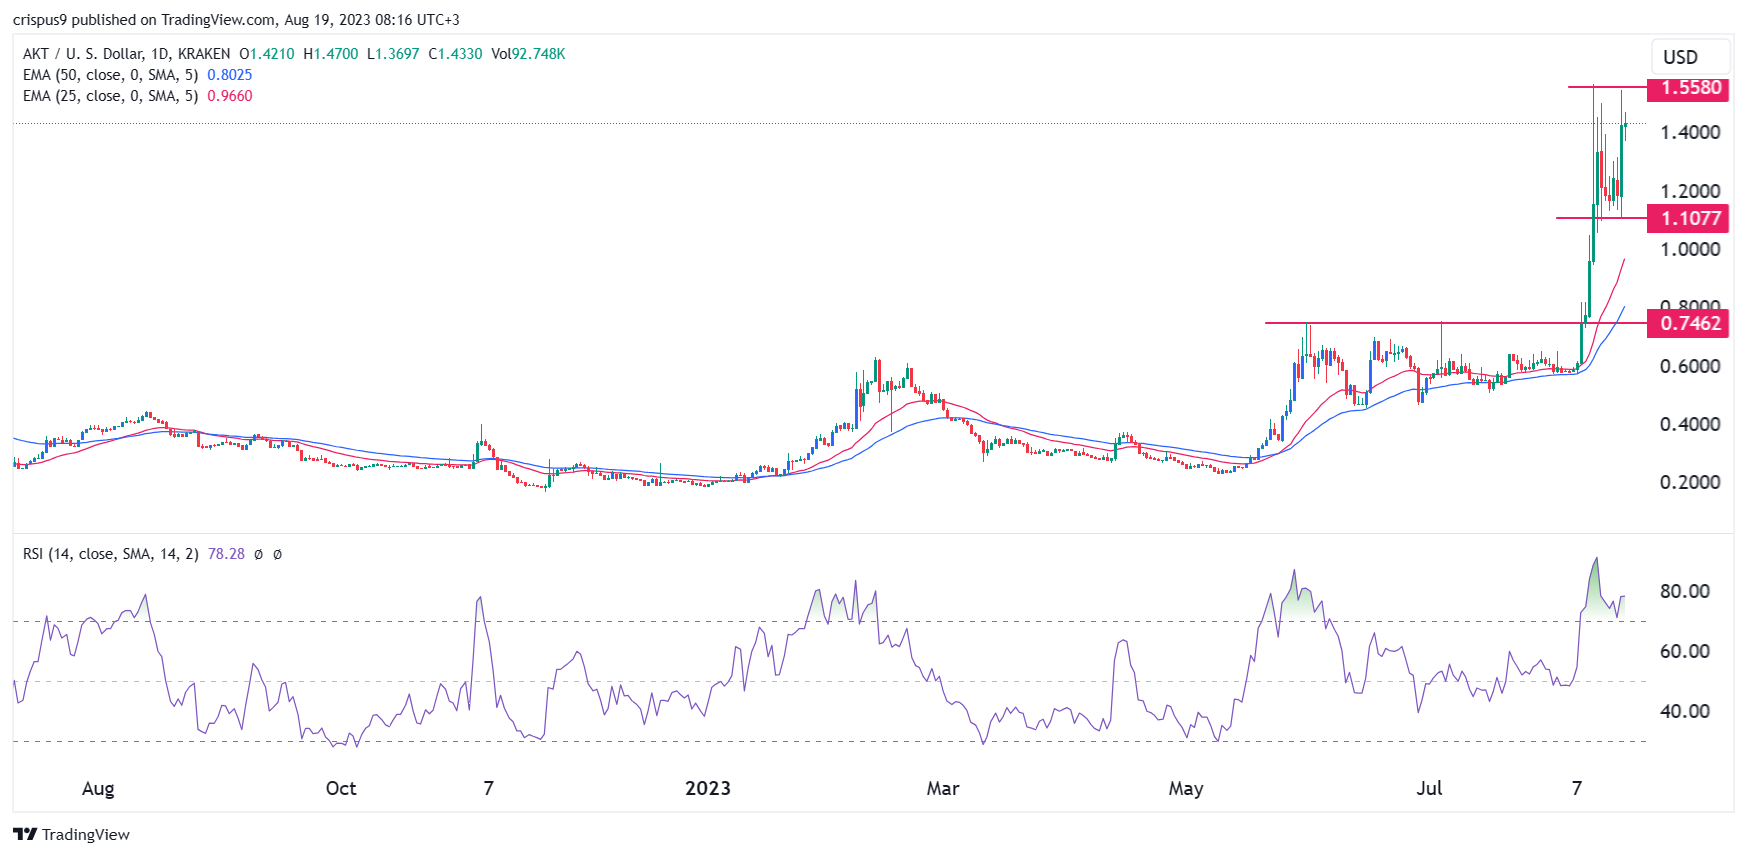
Akash Network’s AKT did not go through a major meltdown this week. On the daily chart, we see that the token rose to a high of $1.5580, the highest level since April last year. The token has moved above the 50-day and 25-day moving averages while the Relative Strength Index (RSI) has moved above the overbought level.

Akash Network has also flipped the important resistance level at $0.7462 into a support. This was an important level since it was the highest point on June 1st and July 4th. Now, the token has formed what looks like a double-top pattern whose neckline was at $1.1077. In most periods, a double-top pattern is usually a bearish sign.

Therefore, Akash Network price will likely retreat in the coming days as buyers start to take profit. If this happens, the next level to watch will be the psychological level at $1.0. 

THORChain price prediction

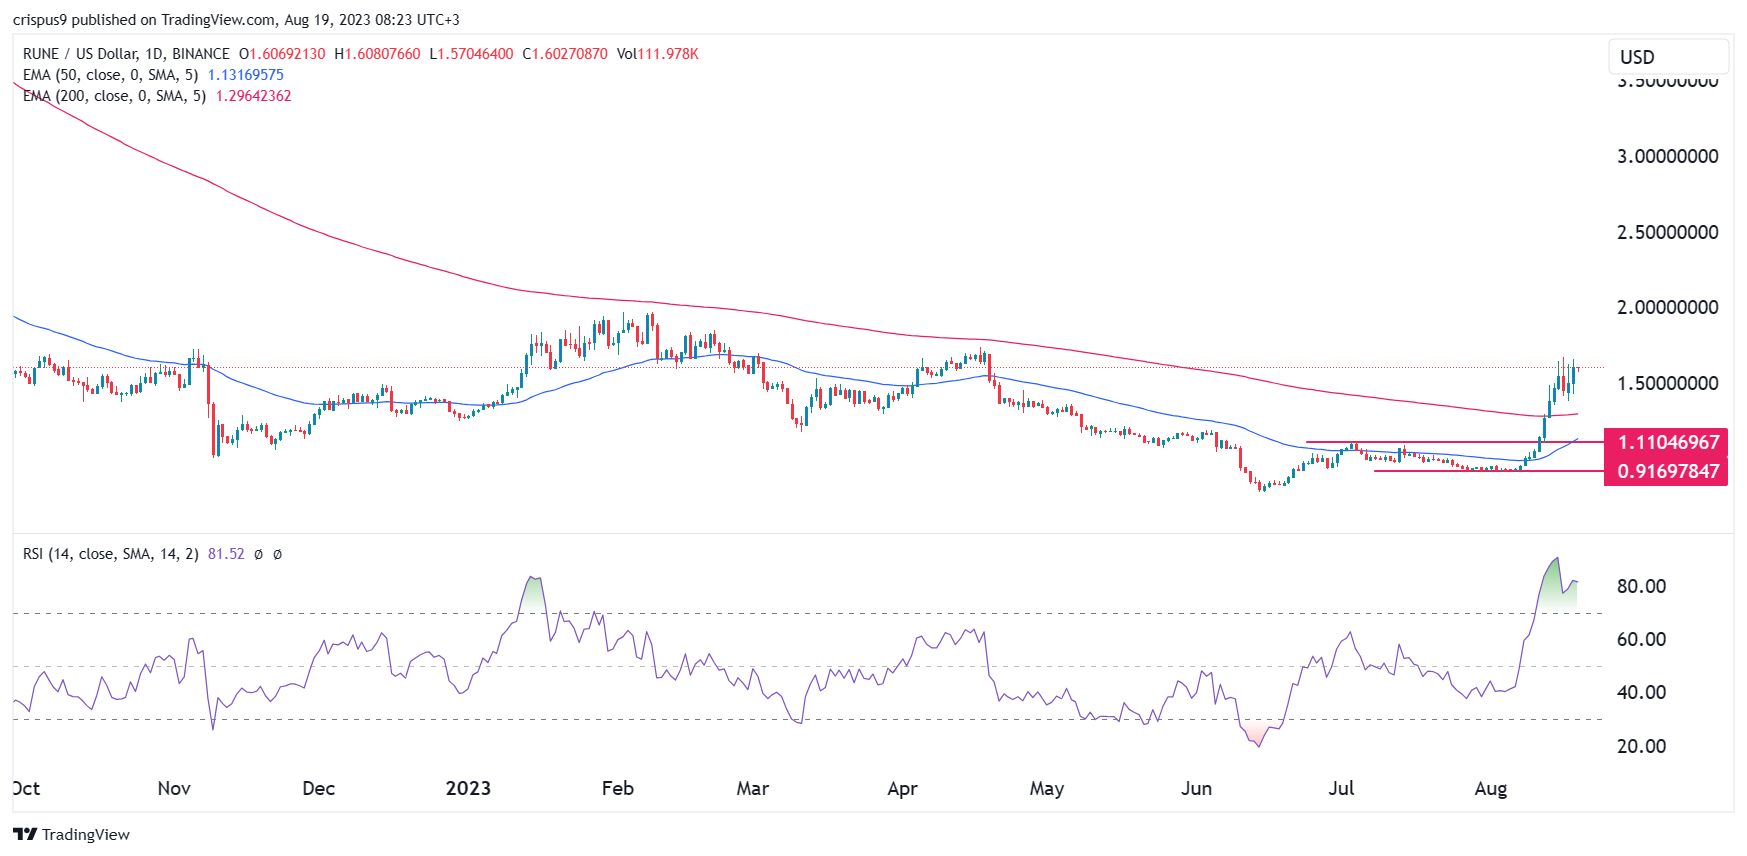
THORChain’s RUNE price has made a bullish breakout in the past few weeks. In this period, it has jumped from $0.9170 to a high of $1.60. It has flipped the important resistance point at $1.110, the highest point on July 3rd. 

Like Akash Network, the token has jumped above all moving averages and is about to form a golden cross pattern. This pattern usually forms when the 50-day and 200-day moving averages make a bullish crossover.

Oscillators like the Relative Strength Index (RSI) and the Stochastic Oscillator have moved above the overbought levels. The outlook for the RUNE price is bullish, with the next level to watch being at $2.

How to buy RUNE

KuCoin

KuCoin is a global cryptocurrency exchange for numerous digital assets and cryptocurrencies. Launched in September 2017, KuCoin has grown into one of the most popular crypto exchanges and already has over 5 million registered users from 200+ countries and regions. According to Alexa traffic ranking, KuCoin’s monthly unique visit ranks the top 5 globally.

Bitcoin SV price forecast

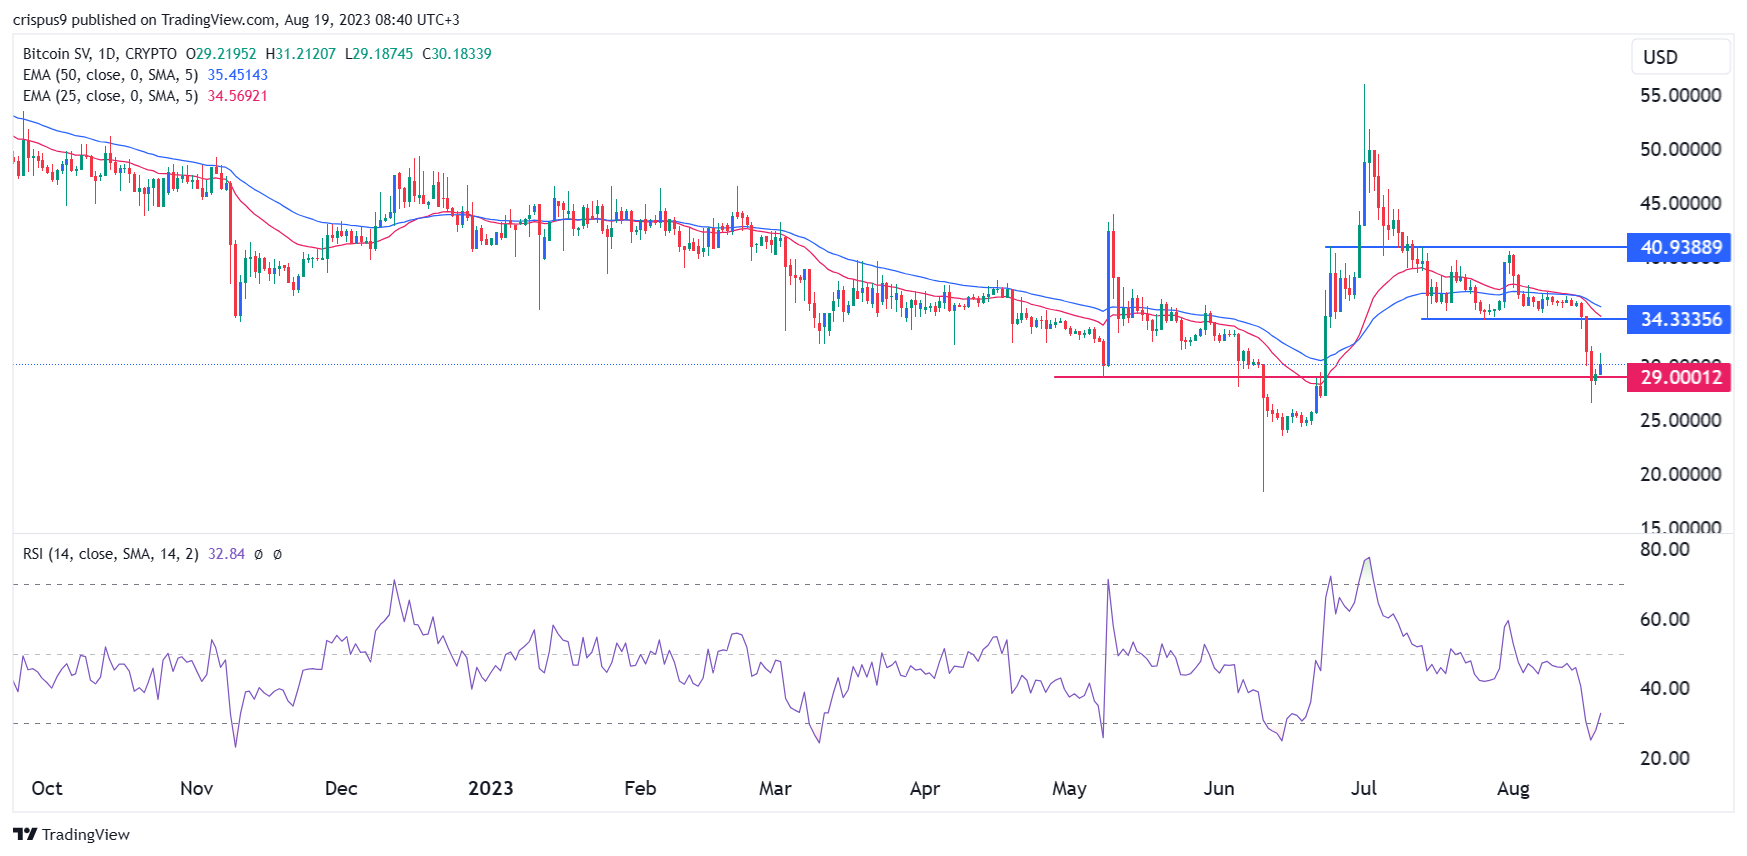
Bitcoin SV price was not left behind in this week’s crypto crash. This move was expected since BSV has a close correlation with BTC. As it dropped, the coin dropped below the important support at $34.33, the lowest level on July 27th. 

BSV has also slipped below the 25-day and 50-day moving averages. It has now rebounded and flipped the resistance at $29, the lowest point on May 8th. This rebound seems like a dead cat bounce, signaling that the coin will likely resume the bearish trend in the coming days. If this happens, the next level to watch will be at $25.

How to buy Bitcoin SV

OKX

OKX is a world-leading cryptocurrency exchange, providing advanced financial services to traders globally by using blockchain technology.

Bitvavo

The Bitvavo platform was launched in 2018, with the goal to bridge the gap between traditional currencies and digital assets. Bitvavo is making digital assets accessible to everyone, by offering transparent fees, a wide range of assets and an easy to use platform.

The post Crypto price predictions: Akash Network, THORChain, Bitcoin SV appeared first on CoinJournal.