Axie Infinity’s AXS price spikes as unique wallets soar: is it a buy?

  • Axie Infinity’s token jumped as the number of unique wallets jumped.

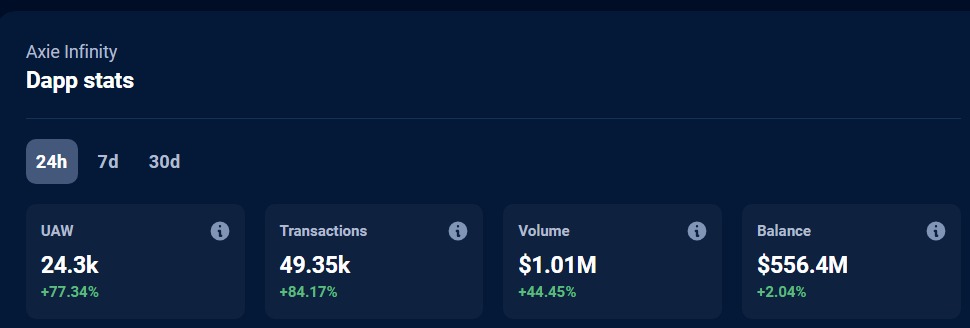
  • The UAW rose by more than 77% to 24.3k in the past 24 hours. 

  • They are still down by over 11% in the past 30 days.

Axie Infinity (AXS) price popped on Thursday and then pulled back. It jumped to a high of $5.13 and retreated to a low of $4.61. In all, the coin has dropped by more than 96% from the highest level on record.

Axie Infinity users falling

Axie Infinity is one of the biggest players in the blockchain gaming industry in the world. The developers created a platform where people can play games and then win rewards through the Smooth Love Potion (SLP) coin.

At its peak, Axie Infinity had hundreds of thousands of users who played for both fun and money. Recently, however, the platform has lost thousands of users as demand for these games wane.

Data by DappRadar shows that the number of Unique Active Wallets (UAW) in Axie Infinity dropped by more than 10% in the past 30 days to 76.6k. The volume of incoming funds in its smart contract dropped by 34% to over $22.36 million. As a result, the balance left in the network stans at over $550 million.

Axie Infinity’s user metrics are much higher than those of other popular platforms like Decentraland and The Sandbox, These platforms have less than 4,000 unique users every month. 

It is unclear why Axie Infinity price jumped on Thursday. A likely reason is that the coin jumped in sync with other digital currencies. Bitcoin has risen above $26,700 while Ethereum has moved to $1,635. In all, the total market cap of all cryptocurrencies jumped to over $1.06 trillion.

In most cases, altcoins like Axie Infiny tend to rise when Bitcoin is doing well. Therefore, since there is no major news driving the token, there is a likelihood that it will resume the bearish trend in the near term.

Another likely reason is that the UAW jumped by 77% in the past 24 hours to 24.3k. Transactions in the same period rose by 84% to 49k.
Axie Infinity price forecast
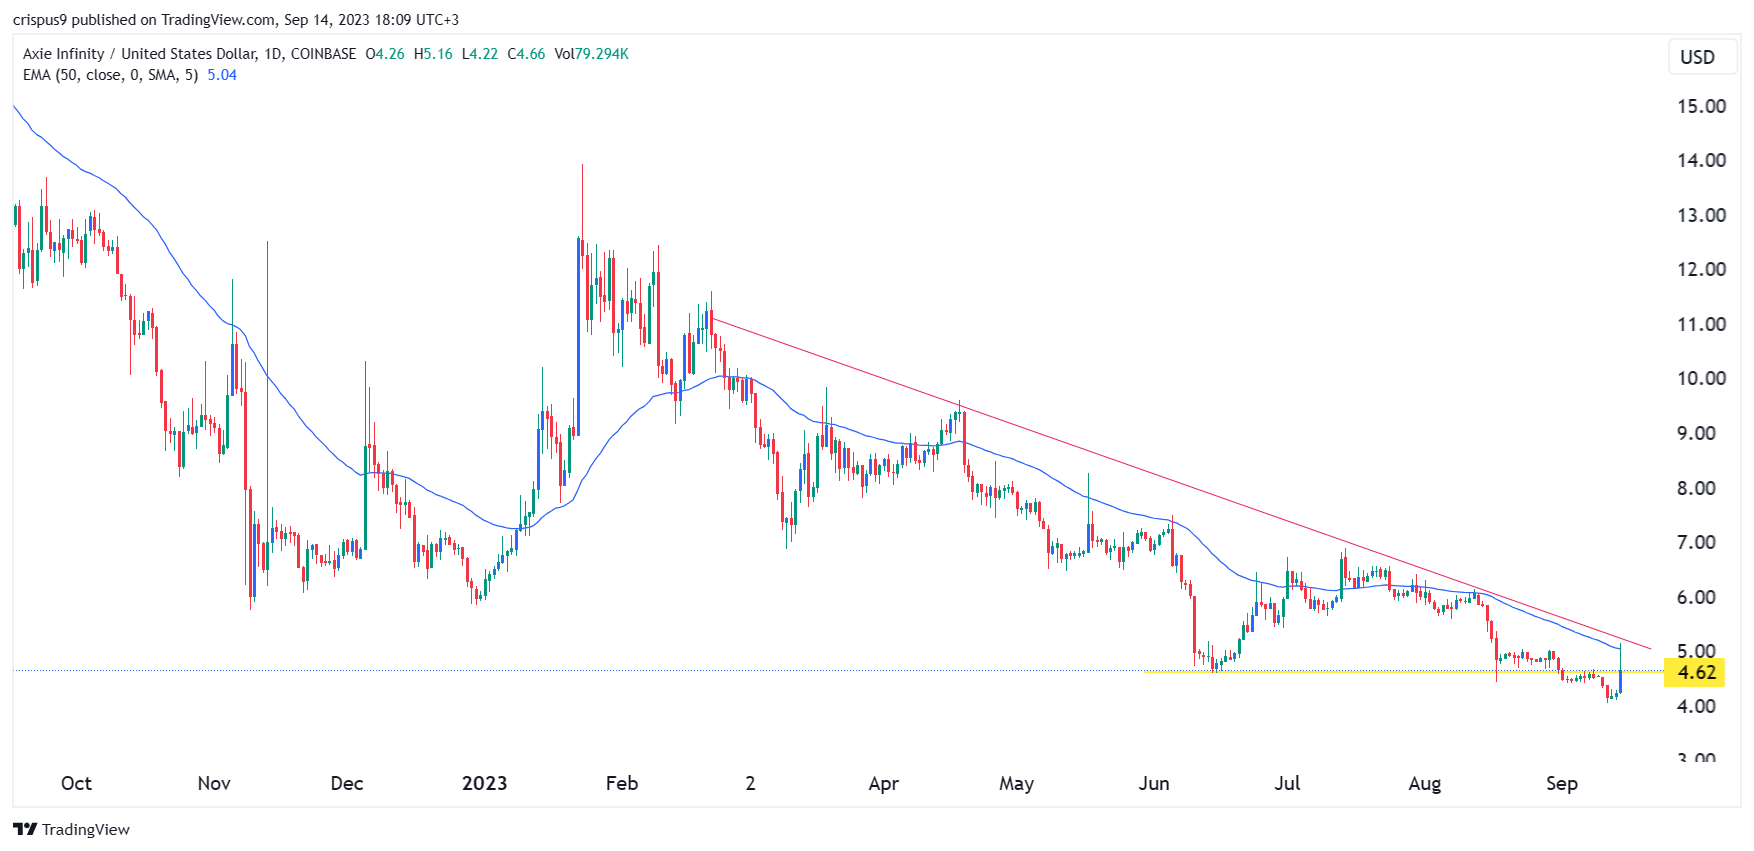
The daily chart shows that the AXS token price has been in a strong bearish trend in the past few months. It has remained below the descending red trendline that connects the highest swings since February. The coin is below the 50-day moving average and has retested the key resistance at $4.62. 

Therefore, Axie Infinity price will likely resume the bearish trend as bears target the key support level at $4. 

How to buy AXS

Skilling EU

Skilling is a regulated Forex and CFD broker that allows traders to access 800+ financial instruments, including 10 popular cryptocurrency CFDs with competitive pricing and fast execution time. Skilling offers a selection of trading platforms, including the proprietary Skilling Trader and popular, industry renown cTrader and MetaTrader 4 platforms, which can suit the needs of customers with different levels of trading experience.

eToro

eToro is a multi-asset investment platform with more than 2000 assets, including stocks, ETF’s, indices, commodities and Cryptoassets. eToro offers over 60+ Cryptoassets to invest or invest in their CryptoPortfolio where investors can benefit from the accumulated growth of Bitcoin, Ethereum, XRP, Litecoin and other leading cryptocurrencies. eToro users can connect with, learn from, and copy or get copied by other users.

The post Axie Infinity’s AXS price spikes as unique wallets soar: is it a buy? appeared first on CoinJournal.
Crypto price predictions: Shiba Memu, Synthetix, Solana

  • Shiba Memu, the fast-growing meme coin, has raised over $2.7 million.

  • Solana has been under pressure as holders wait a major FTX dump.

Cryptocurrency prices have stabilized in the past few days as investors react to the ongoing TradFi trend in the industry. On Tuesday, Franklin Templeton became the latest financial giant to file for a spot Bitcoin ETF.

As a result, Bitcoin has remained above the important support at $26,000 while tokens like Hedera Hashgraph, IOTA, Tron, and VeChain have risen by more than 5%. At the same time, Shiba Memu, an upcoming AI meme coin, has continued to thrive as its investments rise. It has now raised over $2.78 million in just a few months.

Shiba Memu prediction

Shiba Memu is an upcoming cryptocurrency at the intersection of meme coins and the growing trend of artificial intelligence (AI). The developers hope to make it the best alternative to other meme coins like Shiba Inu and Dogelon Mars.

They hope to do that by ensuring that it has utility in its network, unlike other meme coins like Pepe and Milady. As a result, according to its white paper, Shiba Memu will embrace key technologies like Natural Language Processing (NLP), sentiment analysis, and image and video analysis.

At the same time, Shiba Memu holders will have two main ways of generating returns. Like other tokens, they will make money when the price moves up. In fact, original Shiba Memu buyers have already benefited from this since the token price rises every day.

Second, they will make money through staking. Staking will incentivize these holders to be more active in the Shiba Memu ecosystem. The white paper adds:

“Staking with Shiba Memu stands as an innovative program for our platform AI to leverage its community’s knowledge and expertise in elevating its marketing efficacy and sector presence.”

You can buy the Shiba Memu token here.

Solana price prediction

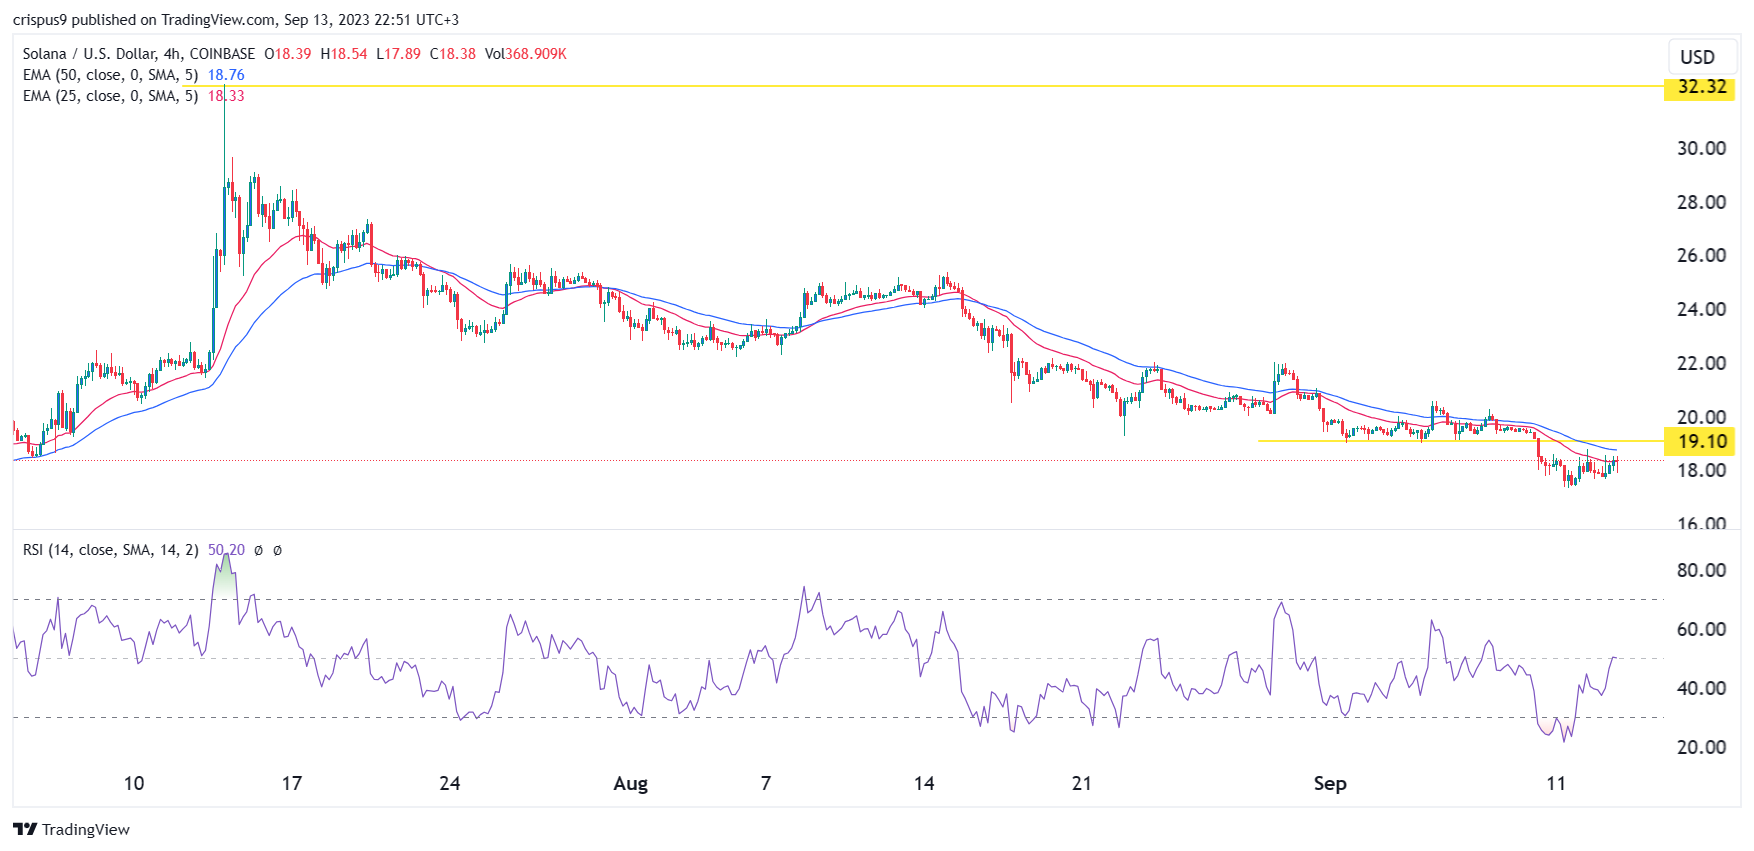
Solana price has been in a strong bearish trend in the past few months as demand for the coin waned. It has dropped from a high of $32.32 in July to the current $17.50. This sell-off has intensified after the judge overseeing the FTX bankruptcy case gave a green light to sell these assets. 

It is estimated that FTX had over $1 billion in Solana, which is a sizable amount since Solana has a market cap of over $7.5 billion. Therefore, the next price action for Solana will depend on how the administrators decide to sell them. A straight dump will push SOL price sharply lower. A slower and more orderly process will lead to stable price action. 

Technically speaking, Solana price remains below the 25-day and 50-day moving averages. It has also moved below the psychological level of $20 and the important support at $19.10 (1st September low). Therefore, Solana will likely continue falling as sellers target the key support at $15.

Synthetix price forecast

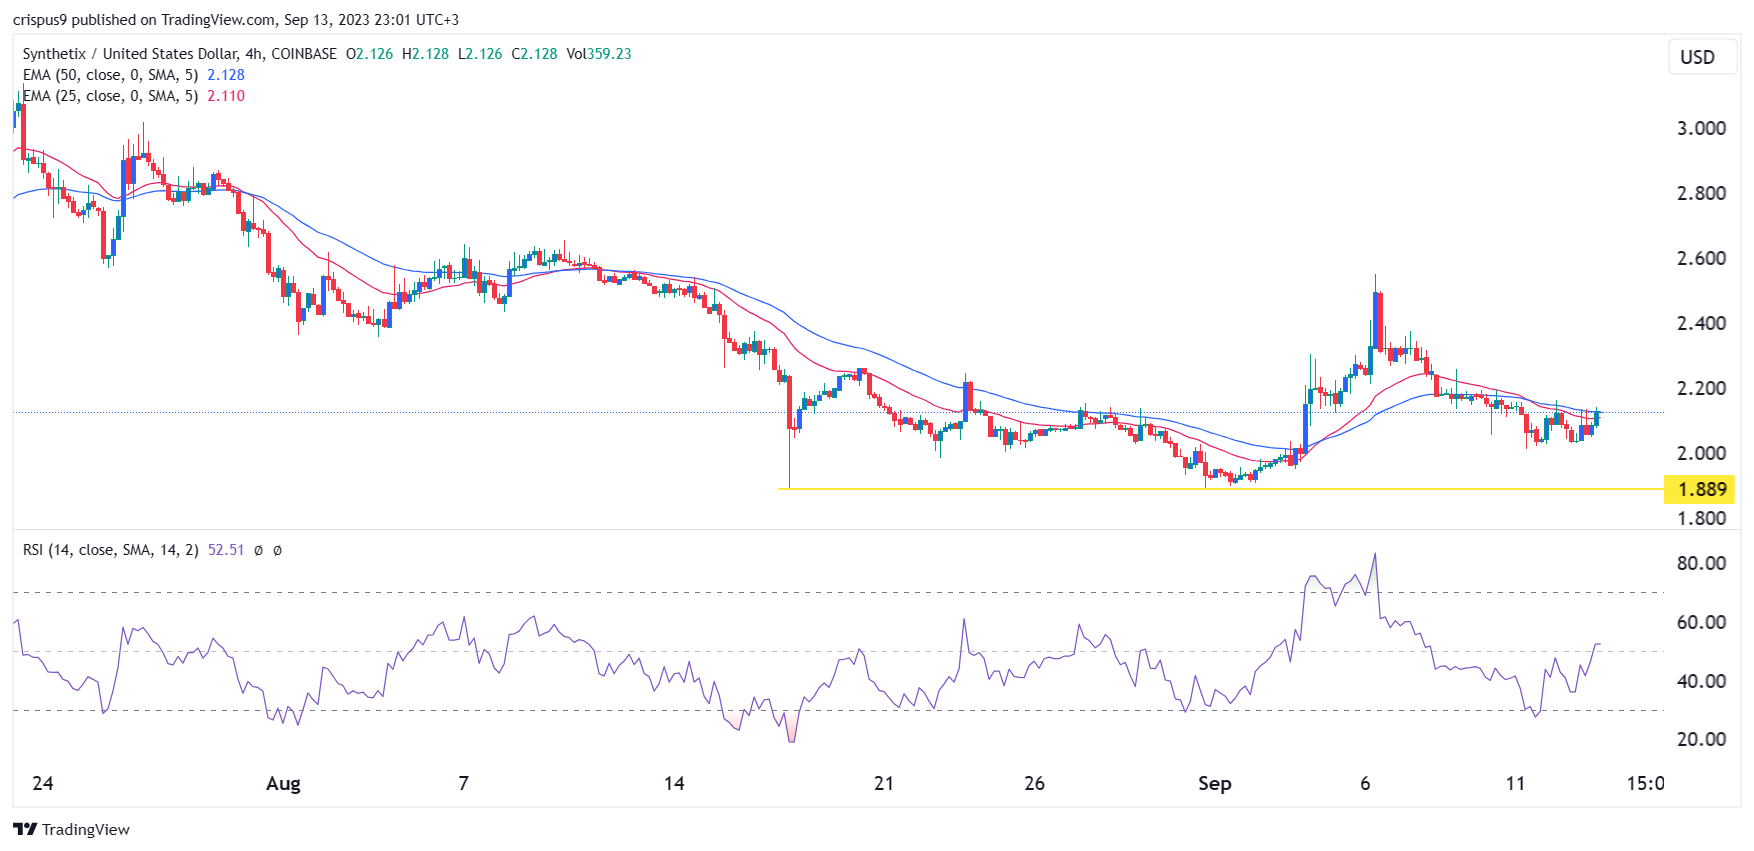
Synthetix price has moved sideways in the past few days. On the 4H chart, the token was trading at $2.12, a few points below this week’s low of $2. On the 4H chart, the coin has consolidated at the 25-day and 50-day moving averages. The Relative Strength Index (RSI) has drifted upwards and crossed the neutral point of 50.

Therefore, the SNX price will likely remain in this range in the next few days and then have a bearish breakdown to $1.88, the lowest level on September 1 and August 17.

The post Crypto price predictions: Shiba Memu, Synthetix, Solana appeared first on CoinJournal.

VeChain, Toncoin, Compound, Maker prices rise as US CPI spikes

  • Altcoins like Toncoin, Compound, Maker, and Hedera Hashgraph jumped on Wednesday.

  • The US published strong consumer inflation data as the CPI soared to 3.7%.

Cryptocurrency prices reacted differently to the latest US consumer inflation data. Toncoin’s TON token jumped by 10% while Compound, VeChain, Maker, and Aptos rose by over 9%. Bitcoin price remained comfortably above $25,000.

US inflation jumped in August

Crypto prices reacted mildly to the latest US inflation data. According to the statistics agency, the headline inflation jumped from 0.2% in July to 0.6% in August while core inflation rose to 0.3%. On a YoY basis, inflation rose by 3.7% while core CPI dropped to 4.3%.

Gasoline was the main cause of this inflation. Data by AAA shows that the average gasoline price has surged to over $3.85. This trend will likely continue rising as the price of Brent is now comfortably above $92 and WTI has jumped above $89.

Therefore, analysts believe that the Federal reserve will likely deliver another 0.25% rate hike in its September meeting. Before the report, most analysts were expecting the Fed to leave rates unchanged on Wednesday next week. In a note after the inflation data, analysts at ING wrote that:

“When measured to three decimal places, the 0.278% core print doesn’t look so bad. It is not a terrible miss, but markets will likely interpret it as showing the Fed can’t completely relax.”

Implications for cryptocurrencies

The latest inflation numbers have an implication for altcoins like Maker and Compound. For starters, these two are some of the biggest players in the DeFi industry. Unlike Uniswap and PancakeSwap, these platforms focus on lending and investing. 

People deposit their tokens and expect a return on their investments. The challenge is that the interest paid in these platforms is not competitive in the current environment. For example, the net earn APY of USDC  in Compound is 3.62%. 

In contrast, money market funds in the US are paying over 5%. Therefore, if the Fed continues its tightening, we could see more people move to money market funds and certificates for deposits (CDs).

All this explains why the total value locked (TVL) in these ecosystems has dropped sharply since the Fed started its rate hikes and quantitative tightening policy.

Rising inflation is also bearish for other cryptocurrencies like Bitcoin, Toncoin, and Ethereum, as I wrote here. In Toncoin’s case, the coin jumped after Telegram endorsed it.

The post VeChain, Toncoin, Compound, Maker prices rise as US CPI spikes appeared first on CoinJournal.

Bitcoin trades with a bullish bias ahead of the US inflation data

  • Financial market participants await the US inflation data
  • Bitcoin shows signs of a possible reversal
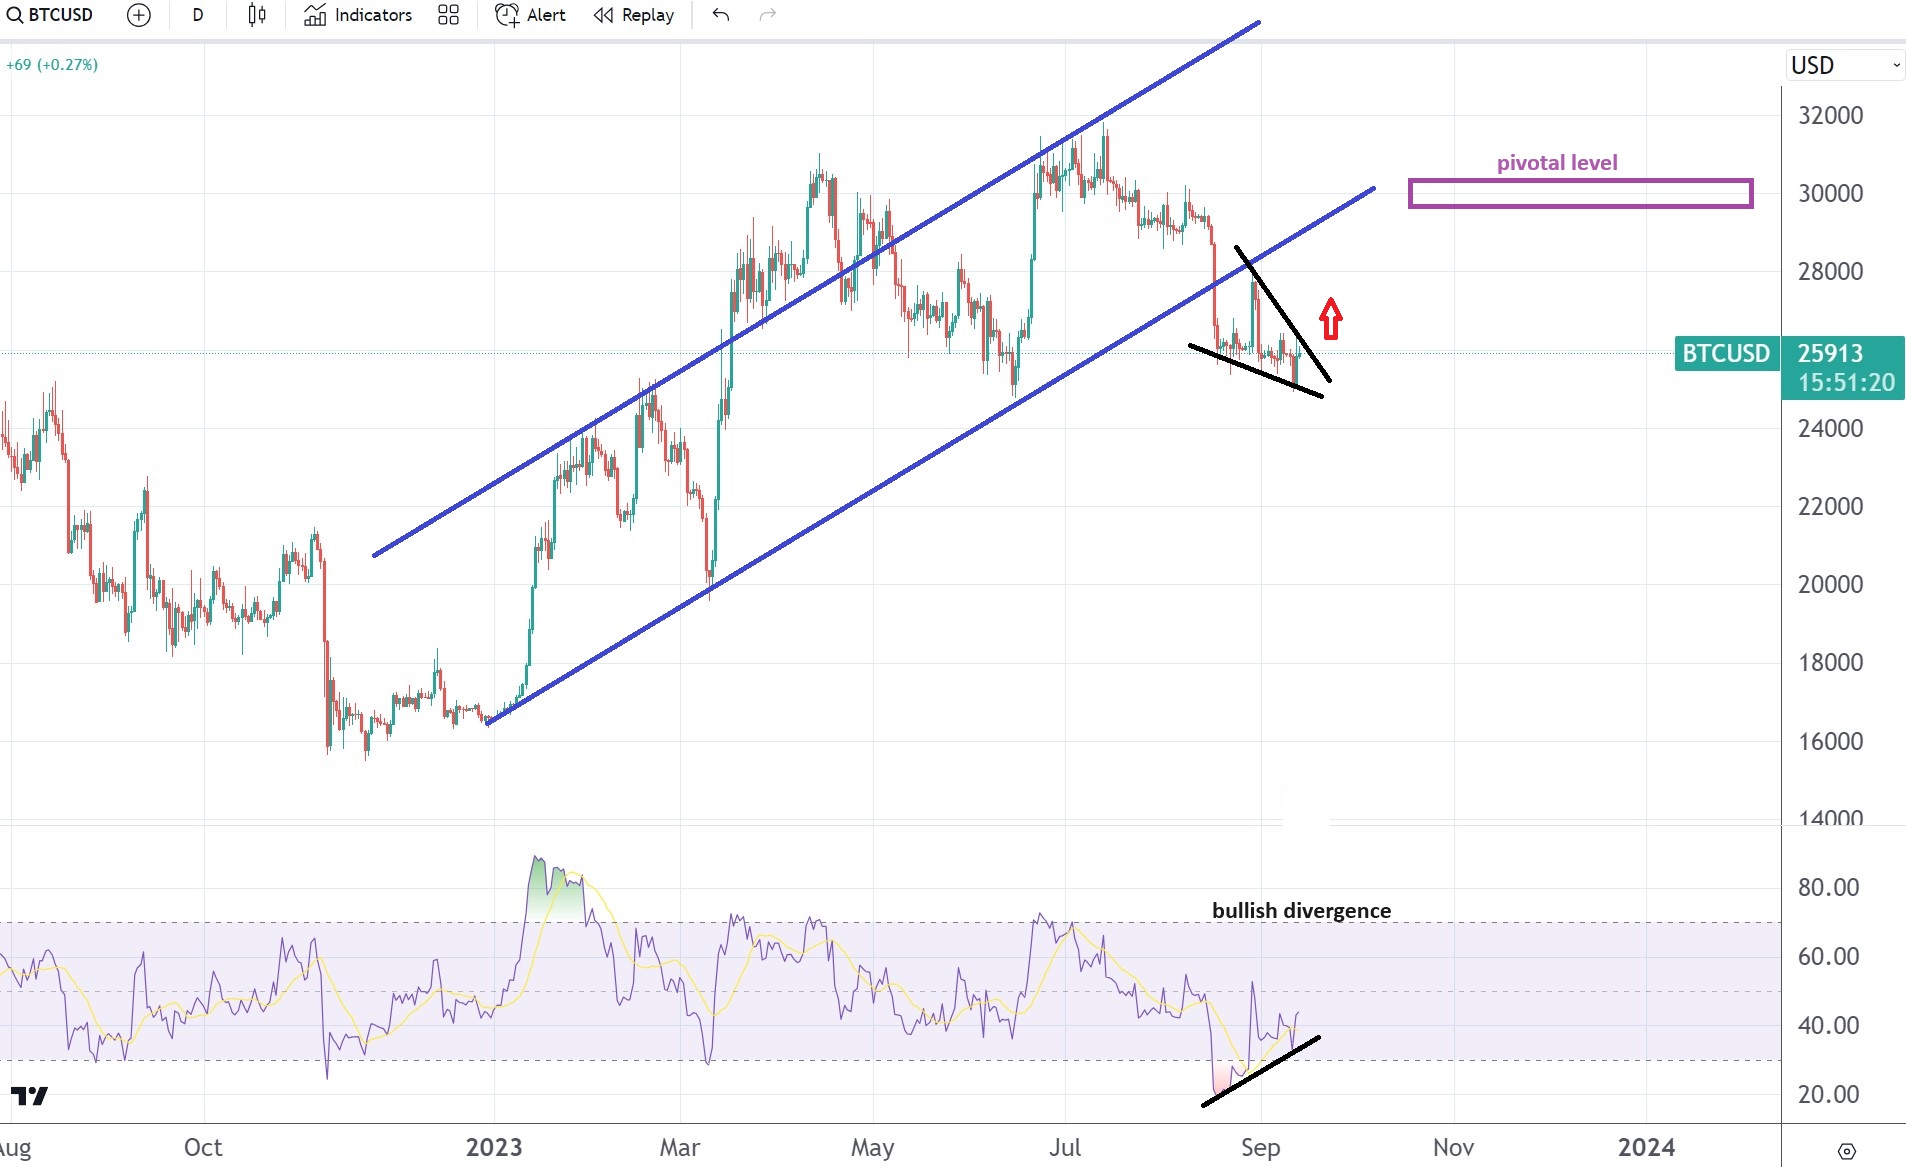
  • A falling wedge and a bullish divergence support the case for higher Bitcoin prices

Today is important for anyone interested in financial markets and US data. Because the US economy is the largest in the world and the US dollar is the world’s reserve currency, monetary policy is the main driver of financial markets’ volatility.

Volatility, or the lack of it, is the one that upsets cryptocurrency traders. Bitcoin went nowhere since it traded above $30k in April, as every rally was sold.

But a close look at the traditional currency market reveals that most fiat currencies have traded similarly against the US dollar. Therefore, if anything is going to push the cryptocurrency market’s volatility up, it is going to be the US dollar.

Core CPI expected at 0.2% in August

Today’s release in the United States is expected to show that the Core CPI in August has increased by 0.2% m/m while the headline inflation is set to rise to 0.6% m/m from the previous 0.2%.

But the bias is that inflation will surprise to the downside.

If that is the case, the bets will increase the Fed will hold rates steady and perhaps, it will be enough to convince market participants that there will be no rate hike anymore and that the Fed has already reached the terminal rate.

A bullish divergence supports the case for higher Bitcoin prices

The summer months brought broad US dollar strength across financial markets. EUR/USD dropped from above 1.12 to below 1.07. At the same time, Bitcoin declined from $32k to $25k as investors bought the US dollar.

Bitcoin chart by TradingView

However, recent price action suggests that there is scope for optimism. First, the market formed a bullish divergence with the RSI. Second, a falling wedge pattern suggests that a reversal might be in the cards.

All in all, we will all find out where Bitcoin goes next sooner rather than later. Now that the lull summer trading is gone, expect the market’s volatility to pick up as important economic data is due.

The post Bitcoin trades with a bullish bias ahead of the US inflation data appeared first on CoinJournal.

Crypto volatility continues to plummet, spot volume now at two-year lows


Key Takeaways

  • Volatility briefly rose in crypto markets last month but is back near all-time lows
  • Capital flight out of the space has been enormous, with liquidity also at multi-year lows
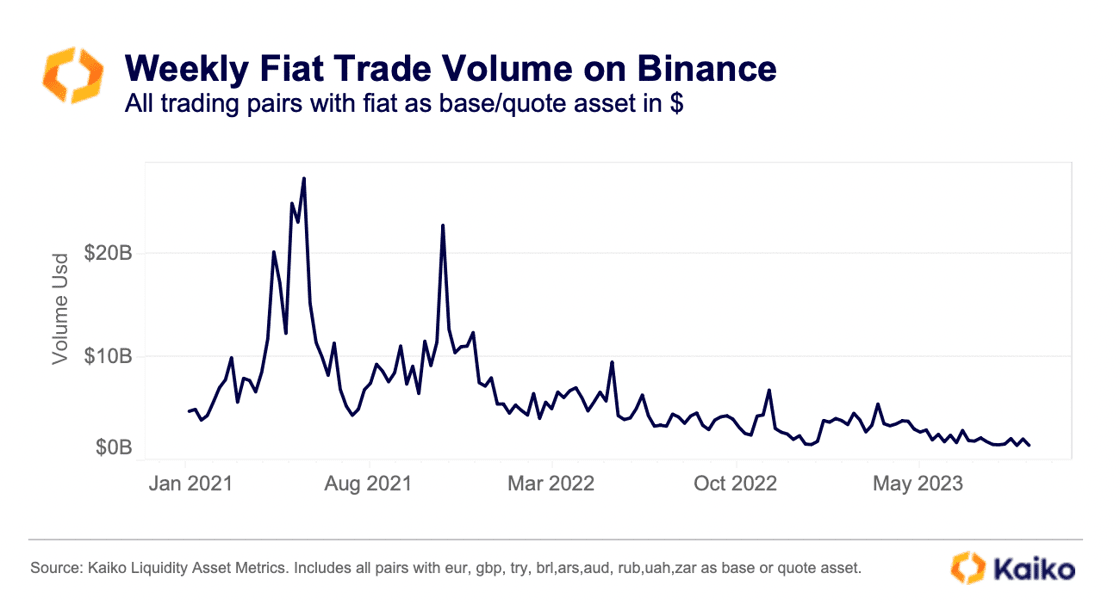
  • Trading volume continues to decline, with Binance’s volume down 95% from the peak in 2021
  • Ethereum is now trading at a similar volatility to Bitcoin
  • A combination of tight monetary conditions in the economy, as well as crypto-specific scandals and a regulatory crackdown, have all made their mark on the space

Volatility in the crypto markets is back to multi-year lows. After a brief pickup amid the positive ruling on the Grayscale ETF case last month, markets are back to the placid state we have become familiar with this year.

Looking at 90-day annualised volatility, both Bitcoin and Ethereum are close to the lowest levels we have seen. The chart below shows that, aside from three isolated episodes, we have seen volatility in a near-constant state of decline since Q1 of 2022. That marks the infelxion point for the wider economy, when we transitioned to a tight monetary environmen, kicking off what would prove to be a gruesome time in crypto.

The three episodes of reprieve with regard to volatility were the Terra collapse and subsequent summer of bankruptcies (from May 2022), the FTX collapse in November 2022 and, most recently, the banking contagion in March 2022. Otherwise, it has been a downhill ride.

The muted state of the once-volatile asset class is hurting market makers and liquidity. While the entire ecosystem has been ravaged, it is important to note that the macro environment has also pared down in volatility this year, as can be seen on the below chart where we have included the 90-day volatility of the Nasdaq for reference. 

However, the scale of the decline in crypto has gone above and beyond. While digital assets remain highly correlated with risk assets (the tech-heavy Nasdaq being the classic example), the capital flight and drain of both volatility and liquidity form the blockchain sector have been unmatched elsewhere.

Such is the lack of volatility that we are now even seeing Ethereum trade with similar volatility to Bitcoin (for a brief period, Ethereum’s volatility was even even lower than Bitcoin’s), despite the former traditionally operating at volatility levels above the world’s biggest crypto. 

On the one hand, this is positive for Ethereum and demonstrates a growing maturity. On the other hand, the convergence is emblematic of the drain in overall volatility from the space at large. 

Yet, in the context of what is happening across the space, the drawdown is not surprising. We keep mentioning the capital flight and dearth of liquidity; in looking at the numbers, the chasm compared to previous years is enormous. 

Fiat trade volume on Binance, the world’s biggest exchange with an approximate two-thirds market share of total volume, is down to its lowest level in more than two years. Fiat trade volume on Binance has declined by more than 60% since early January and is down 95% relative to its 2021 peak, according to data from Kaiko. 

While Binance is facing myriad issues which may have exacerbated the decline, the underlying fact remains: liquidity has fled the space at the speed of light, to the extent which has surprised perhaps even the most bearish of crypto analysts’ predictions. Not to mention, one of the many accusations levelled against Binance through several lawsuits is an alleged manipulation of trade volume, so perhaps the dropoff is even worse than those above numbers imply. 

Given volume and volatility go hand-in-hand, the subsequent drawdown in the latter is, therefore, not surprising. Crypto resides as far out on the risk spectrum as can be, and in a world that has seen interest rates jump from 0% to above 5% – and at a pace among the fastest in modern economic history – the fallout makes sense. And that is without even layering in the numerous scandals and crypto-specific episodes which have pushed market makers and investors alike away.

The post Crypto volatility continues to plummet, spot volume now at two-year lows appeared first on CoinJournal.