Shiba Inu is vulnerable close to support as interest in token wanes

  • Shiba Inu is experiencing declining Google search interest as price slips

  • The token remains the most held by Ethereum whales

  • SHIB will continue to drop in the bear market, but the price could find support soon

Shiba Inu SHIB/USD price has largely been influenced by retail interest and social media frenzy. That’s why a drop in interest has an adverse impact on price. Accordingly, “Shiba Inu” Google Search queries are at the lowest in more than a year in July. The drop in interest is reflected in the price, although the developing crypto weakness is also a cause. 

As press time, SHIB was down 7.82% in the last 24 hours. The decline takes the total losses in the week to nearly 10%. However, it should be remembered that SHIB has been on an upward momentum since mid-June. 

Whalestat data also indicates that SHIB remains the most held token, after ETH, by Ethereum whales. That signals the expectation of a price jump in the future. Thus, the drop in search interest may not accurately reflect price but can cause a short-term weakness.

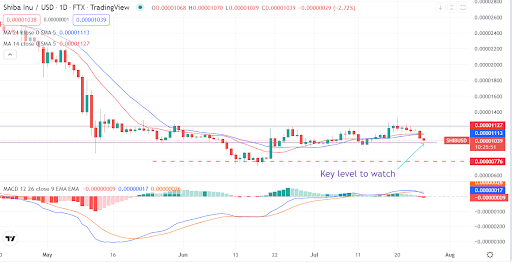
Shiba Inu nears support as the price weakens
Source – TradingView

We believe $0.0000104 is the level to watch for SHIB investors. The level is a make-or-break zone as it is the support that marks the bottom of the consolidation zone. The MACD line is crossing below the moving average, indicating a further bear pressure. The moving averages have also joined the resistance. If SHIB breaks below the support, it could fall to $0.0000077. 

Concluding thoughts

Shiba Inu is witnessing a decline in Google search interest, but whale holdings are still strong. The token is trading lower and nearing the $0.0000104 support. SHIB needs to overcome a drop below the support to remain in the consolidation zone.

The post Shiba Inu is vulnerable close to support as interest in token wanes appeared first on CoinJournal.

Bearish MACD crossover makes Sandbox token vulnerable to $1.0

  • SAND loses 8% in 24 hours as weak sentiment prevails

  • Fed’s policy statement on Wednesday will determine price movement

  • SAND risks further bear pressure as price crashes below moving averages

Sandbox token SAND/USD is back in the consolidation market. The token lost nearly 8% in the last 24 hours. The losses come amid concerns of further economic tightening by the Fed in a meeting on Wednesday.

SAND’s recent price movement has been pegged to the prevailing crypto sentiment. The token recovered from June’s level below $1 on a relief rally that lasted up to last week. The token remains among those expected to rise as Metaverse continues to actualize. However, at the moment, SAND is bearish, and investors should be cautious ahead of the Fed statement.

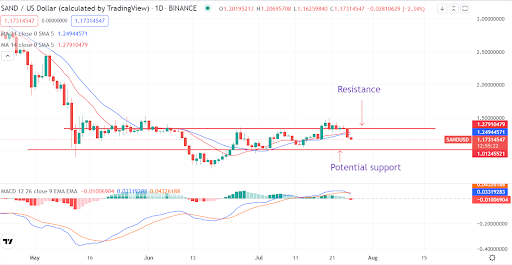
SAND token bearish as it eyes $1.0 support

Source – TradingView

On the daily chart, SAND is bearish after failing to break above a resistance zone at $1.28. The weakness reflects buyers taking profit ahead of the Fed policy meeting. Following the recent weakness, SAND is trading below the 14-day and 21-day moving averages. That suggests a short-term bearish pressure that could push the price down.

Another bear signal for the token is the MACD crossover. Since June 21, the MACD line has remained above the moving average as the price surged. However, the MACD line is now cutting below the moving average. That welcomes a bearish market.

If SAND fails to reignite a comeback, we expect the price to settle at $1.01 support. That will attract buyers if sentiment improves in crypto markets. 

Concluding thoughts

Sandbox token SAND will remain bearish until the token finds support at $1. The recovery of the token will depend on whether crypto sentiment will improve after the FOMC statement. Currently, technical indicators support a lower price, with the next support at $1.

The post Bearish MACD crossover makes Sandbox token vulnerable to $1.0 appeared first on CoinJournal.

When to buy Fantom token as price stays clear of the breakout zone

  • Fantom token holds above $0.288 breakout support

  • The cryptocurrency is strong but is stalling as most tokens endure market corrections.

  • Investors should wait to buy FTM after a retracement, potentially towards $0.288

Fantom FTM/USD is one of the cryptocurrencies that has staged recoveries recently. The cryptocurrency breached key resistance at $0.288 following strong gains. The breakout opened a potential for lasting recoveries, which remains intact.

Don’t get it wrong; FTM is not yet a buy as most cryptocurrencies start corrections. Fantom token has held to the robust gains, with up to a 5% surge as of the time of writing. We still believe FTM will correct it, and buyers should be looking for another bullish ride. The key question now is; when?

Fantom token hits a resistance pointing to a potential correction

Source – TradingView

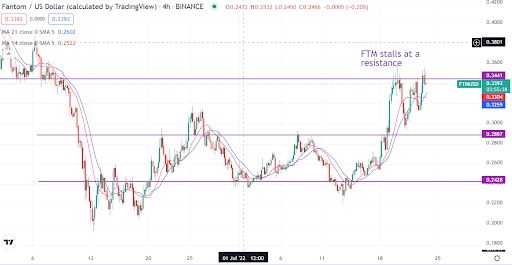
On a lower time frame, FTM has hit resistance at $0.34. The cryptocurrency is holding onto the resistance, but the bullish strength remains weak. The shorter-term 14-day and 21-day moving averages continue to support the price. We believe short-term investors should be defensive at the current level as FTM remains vulnerable.

 The correction could see the price crash back below the moving averages. The token could find support at $0.31 or $0.30, although the established level is at $0.288. If FTM regains strength, the price could reverse at the intersection with the moving averages. The token has already been making higher highs and higher lows. As a result, we can’t rule out a potential break past $0.34. What we insist on now is that FTM keeps the $0.288 intact, which is the reference bottom price.

Concluding thoughts

Although a correction is imminent on the Fantom token, it is still a hold. However, new buyers should consider buying lower. The potential levels to watch are $0.31, $0.30, and $0.288.

The post When to buy Fantom token as price stays clear of the breakout zone appeared first on CoinJournal.

PancakeSwap is making slow but sure gains, and you won’t want to miss

  • PancakeSwap token has gained 21% in a week

  • The platform is a decentralized exchange on BNB Chain 

  • CAKE, the native token, is claiming higher levels, and investors should take positions

PancakeSwap CAKE/USD may not rank among the top cryptocurrencies. However, it makes the right headlines, good enough to be noticed by crypto enthusiasts. The cryptocurrency’s surge of 21% in a week makes it worthy of attention.

Ranked 78th by market cap, PancakeSwap may be an underdog in the DeFi sector. However, it is backed by the world’s leading exchange Binance. PancakeSwap is itself a decentralized exchange to the BNB Chain. It allows users to swap coins without intermediaries.

In early June, Binance Labs announced it had invested in PancakeSwap. That boosted the price of the native token CAKE. However, the price turned lower again on the back of a strong bear sentiment in crypto. With its smart contract functionality and Binance connection, PancakeSwap remains a viable protocol. Investors should develop an interest in CAKE as the price shows bullish signs.

CAKE trades slightly above a key resistance

Source – TradingView

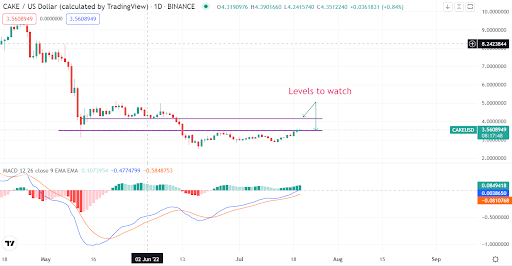
On the daily chart, CAKE trades slightly above a resistance zone at $3.5. The breakout is underway, and investors should watch for price action. The MACD indicators are already in the bull territory. If the cryptocurrency successfully clears $3.5, CAKE will have another litmus test at $4.0.

Our verdict is that CAKE is developing a bullish momentum. It is just a matter of when the token will clear the resistance at $3.5 and $4.0. Investors can buy now to lock value and hold in the long-term. 

Summary

PancakeSwap is gaining and looks likely to break past $3.5. After that, the next resistance is at $4.0. The cryptocurrency is good for buying and holding in the long term.

The post PancakeSwap is making slow but sure gains, and you won’t want to miss appeared first on CoinJournal.

Near Protocol price prediction as price booms 32% in a week

  • Near Protocol token has added 32% in a week

  • The cryptocurrency is yet to break out from a resistance zone

  • Wait to but on a breakout, although a retracement is possible

Near protocol token NEAR/USD is attracting suitors. The token has added a cool 32% in a week, adding enthusiasm for the smart contract protocol. NEAR could blast to higher levels if it successfully manages to clear key levels.

Near Protocol claims to eliminate some of the barriers that limit Web3 adoption. The smart contract platform boosts low fees and high speeds. Owing to the smart contract functionality, Near Protocol offers a great alternative to Ethereum. It allows communication and asset exchange between Ethereum and other protocols such as Polkadot. NEAR could be getting boosts from the surge in Ethereum price. 

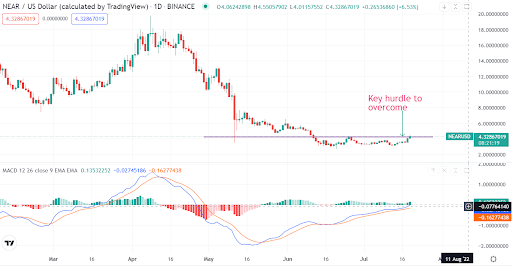
Despite the strong gains recently, NEAR remains near a bottom price of $3.1. The cryptocurrency now trades at $4.3. That should tell you that NEAR remains well supported by the bottom price. However, investors looking to add NEAR should be mindful of immediate resistance.

NEAR faces resistance at $4.3 amid a bullish push

Source – TradingView

The recovery case for NEAR is not in doubt owing to the recent gains. The MACD indicator has also moved to positive territory, owing to the bullish momentum. However, NEAR faces resistance at $4.3. The price has already hit the resistance and is showing some slight retracement. If NEAR retraces, the bottom price of $3.1 would be of interest. That, of course, depends on the prevailing crypto sentiment.

Price could as well turn bullish at the resistance, resulting in a breakout. That would set $6 the next level in sight and could add bulls to ride to higher prices. For now, we watch price action at $4.3.

Summary

NEAR token is bullish but has met resistance at $4.3. Investors should watch how price action unfolds at the resistance. Buy on a breakout.

The post Near Protocol price prediction as price booms 32% in a week appeared first on CoinJournal.