- FTM/USD is down 7.83% in the past 24 hours and 33% in the last seven days
- The crypto token sits at the support of $2.0 in a bearish market
- $1.50 is the next support level if FTM/USD breaks below the consolidation zone
Fantom’s token FTM/USD has been on a strong rally since December 21, when all other cryptocurrencies were experiencing major weaknesses. It rose from a low of around $1.35 on December 21 to a high of $3.37 on January 17.
However, the token faced bearish pressure and has been dropping since then. At the current trading of around $2.0, FTM/USD has dropped by more than 7% in the past 24 hours, extending losses in the week to at least 33%.
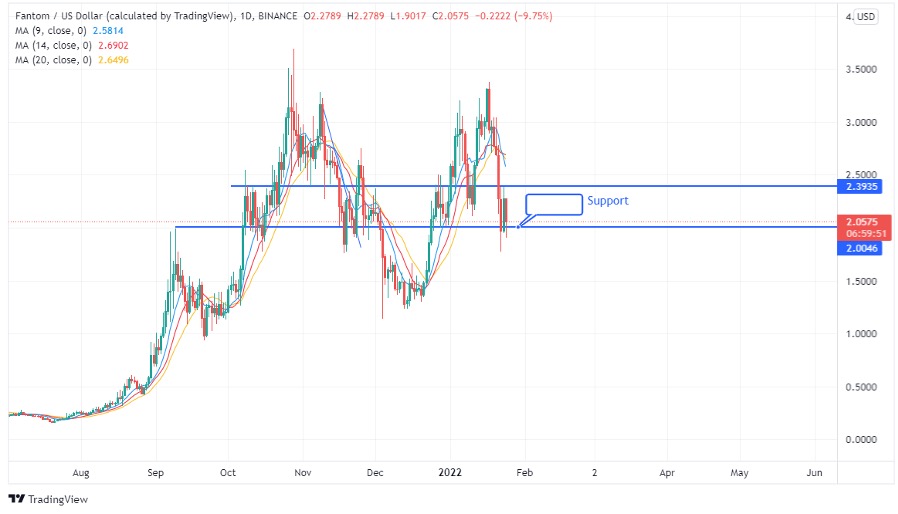
FTM/USD technical analysis – $2.0 is the established support
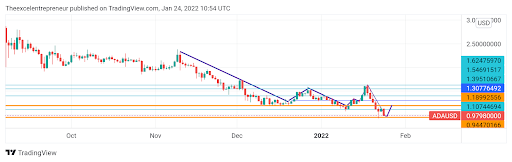
 Source – TradingView
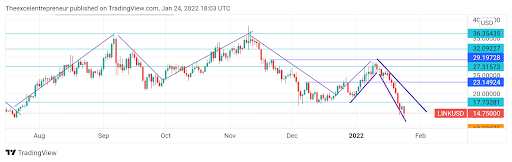
Looking at the daily chart above, FTM/USD has retreated to the support of $2.0. It attempted to rebound before retesting the support again in price weakness that has engulfed the entire cryptocurrency industry. The overall weakness has been connected to the upcoming policy tightening by Fed aiming to tame the rising inflation.
Although FTM/USD is rebounding from the support, it still faces bearish pressure, with the 9-day, 14-day, and 20-day providing resistance. A short-term resistance also exists at the $2.39 level and could constrain prices. We need to watch the close of the candlestick on the daily chart to confirm a trend reversal or continuation.
Summary
Based on the technical pointers, FTM/USD presents a buying opportunity if the $2.0 level holds. A price action signal such as the formation of a bullish pin bar at the support could signal a trend reversal and take FTM/USD higher.
Nonetheless, FTM/USD could break below the support if crypto weakness continues. A break below the current level would see the token claim the $1.5 zone, which is the next support.
The post Is $1.5 the next low for Fantom (FTM/USD)? appeared first on Coin Journal.