Here is why Algorand is up by nearly 20% today

Algorand is the best performing coin amongst the top 30 cryptocurrencies by market cap today.

The cryptocurrency market has continued its mixed performance this week. The market has lost less than 1% of its value in the last 24 hours, and the total market cap currently stands above $1.7 trillion.

Bitcoin is trading at $38,488 at press time as it continues to struggle below the $40k resistance level. Ether has also been unable to surge past the $3,000 psychological level in recent days despite adding 0.8% to its value in the last 24 hours.

ALGO, the native coin of the Algorand ecosystem, is up by nearly 20% in the last 24 hours, making it the best performer amongst the top 30 cryptocurrencies by market cap.

ALGO’s rally comes after football governing body FIFA announced a partnership with Algorand. The agreement makes Algorand the official blockchain platform of FIFA and will provide the official blockchain-supported wallet solution. 

As per the sponsorship agreement, Algorand will also serve as a FIFA World Cup Qatar 2022 Regional Supporter in North America and Europe. Algorand will also be a FIFA Women’s World Cup Australia and New Zealand 2023 Official Sponsor.

Key levels to watch

The ALGO/USD 4-hour chart is currently bullish, thanks to Algorand’s ongoing rally. The MACD line crossed into the positive zone following the rally that began a few hours ago.

The 14-day relative strength index of 65 shows that ALGO could soon enter the overbought region if the rally continues.
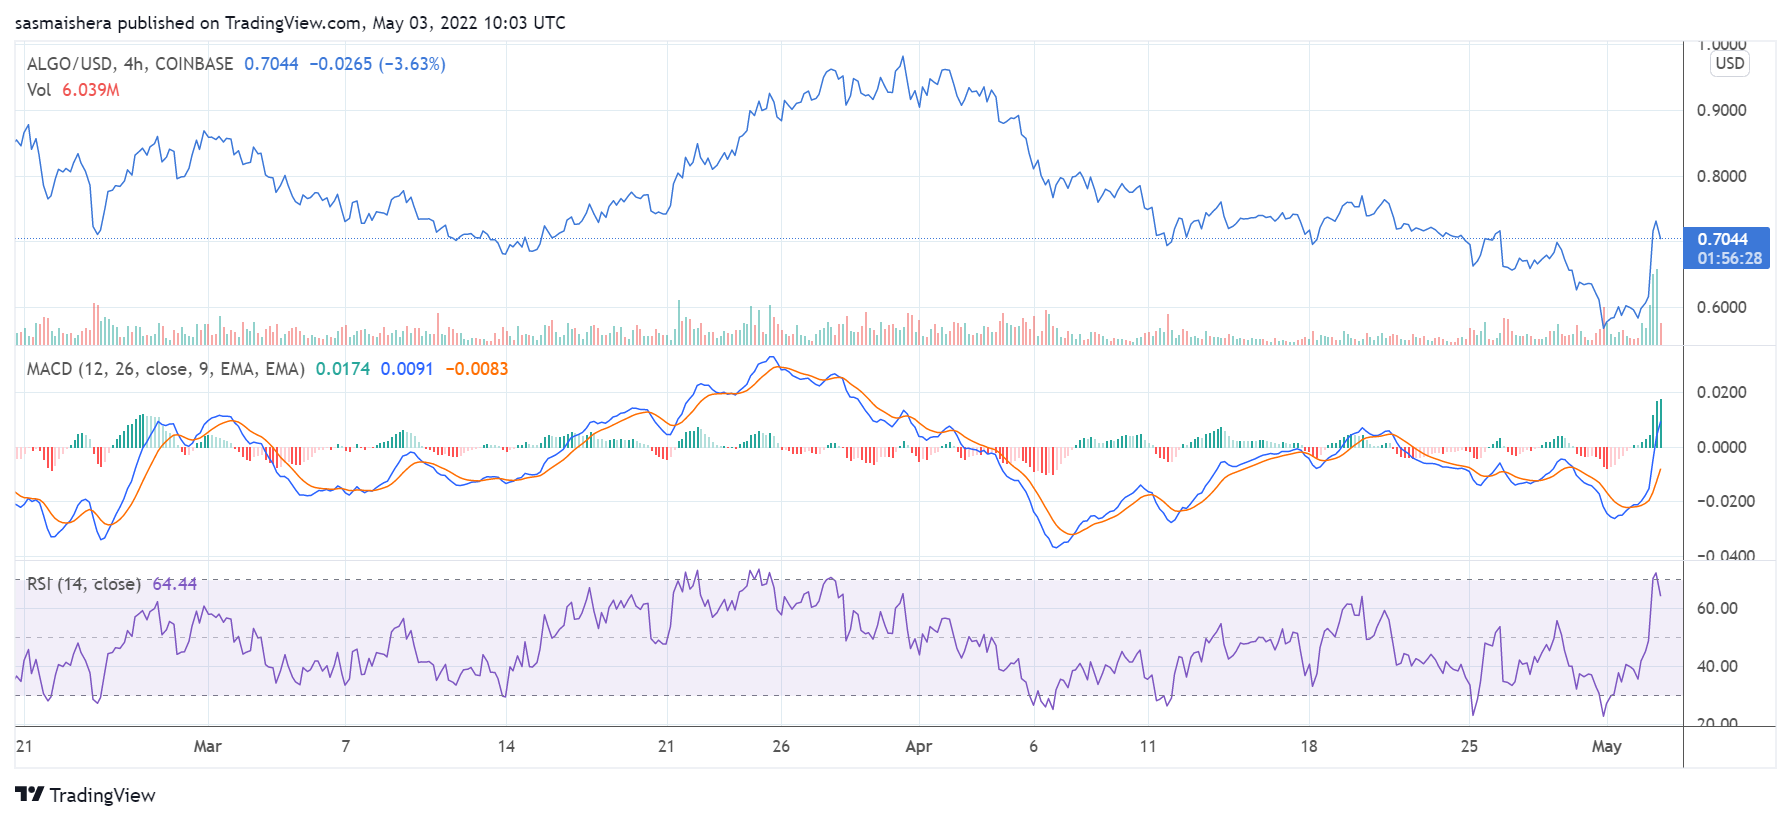
At press time, ALGO is trading at $0.7092 per coin. If the positive momentum is maintained, ALGO could surge past the first major resistance level at $0.7935 before the end of the day.

However, it would need the support of the broader cryptocurrency market before it can move past the $0.8513 resistance level in the short term. 

The post Here is why Algorand is up by nearly 20% today appeared first on Coin Journal.
Bitcoin price prediction as US bond yields surge

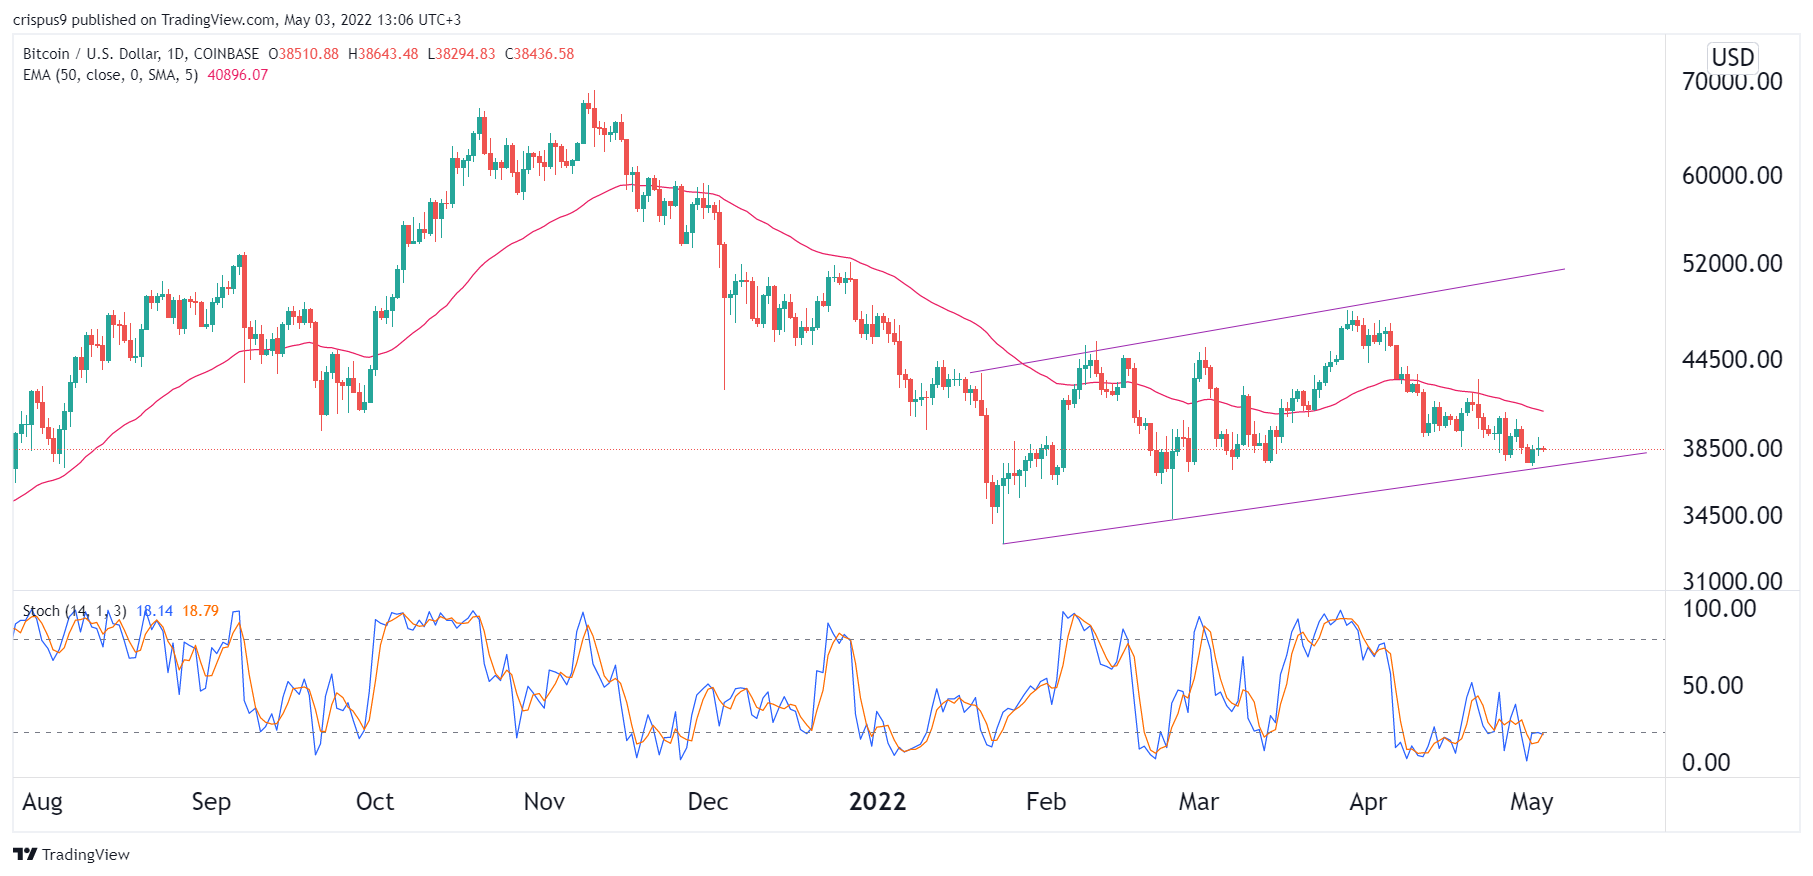
The Bitcoin (BTC/USD) price remained in a tight range as investors reacted to the relatively resilient US Treasury yields. Bitcoin is stuck at $38,500, where it has been in the past few days. This price is substantially lower than its all-time high of near $70,000 while its total market capitalization has declined to about $732 billion.

Rising bond yields

American bond yields continued rising on Tuesday as investors waited for the upcoming interest rate decision by the Federal Reserve. On Monday, the 10-year bond yield crossed the important resistance level at 4% for the first time in years. The 30-year yield also rose to above 3% while the 2-year is about 2.7%.

The bond sell-off happened as investors waited for the upcoming interest rate decision by the Federal Reserve that is scheduled for Wednesday. Economists polled by Reuters and Bloomberg expect that the Fed will sound a bit hawkish in its decision this week. This view reflects the fact that the country’s inflation has surged to the highest level in years.

Read more on how to buy Bitcoin with PayPal.

The Bitcoin price action mirrors that of other assets like stocks and commodities. Futures tied to the Dow Jones have fallen by more than 14% from their highest level in March. The same is true with other indices like the Dow Jones and the S&P 500 index. Bitcoin has had a strong correlation with stocks in the past few days.

Further, the BTC price is reacting to signs that demand for the coin is waning. On-chain data shows that inflows from both small and large investors have been a bit muted in the past few weeks. 

Bitcoin price prediction

The daily chart shows that the BTC price has been in a strong bearish trend in the past few days. It has moved below the 25-day and 50-day moving averages. At the same time, the price has moved slightly above the lower side of the ascending channel shown in purple. Also, it remains slightly below the lower side of the oversold level.

Therefore, the outlook of Bitcoin at this price is neutral. A move below the lower side of the trendline will send a signal that bears have prevailed and push it much lower. On the other hand, a move above the resistance at 40,000 will mean that bulls have prevailed.

The post Bitcoin price prediction as US bond yields surge appeared first on Coin Journal.
Zilliqa price prediction for May 2022: Will it rebound?

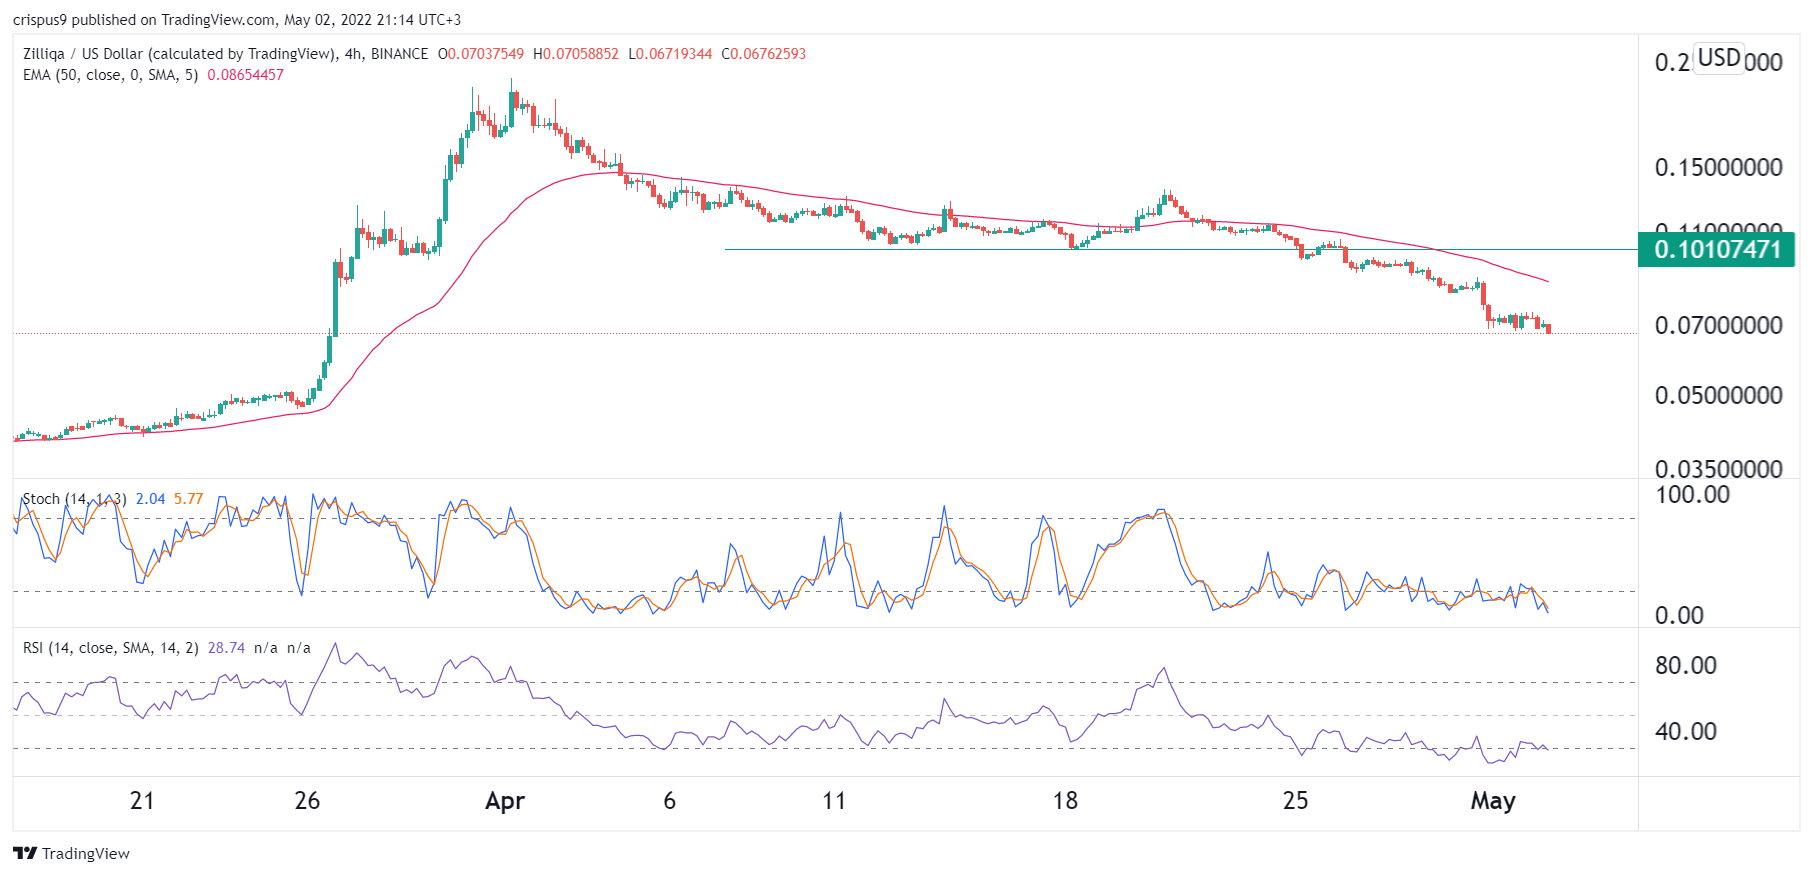
The Zilliqa price crashed to the lowest level since March 26th this year as demand for the coin retreated. The coin is trading at $0.676, which is about 70% below the highest level this year. As a result, the coin’s market cap has dropped to about $972 million, making it the 91st biggest cryptocurrency in the world.

Zilliqa demand has waned

Zilliqa is a blockchain project that helps developers build decentralized applications. It is well-known for introducing the sharding technology, which supercharges its speed by breaking blocks into smaller pieces known as shards. 

Zilliqa has been used widely by developers seeking to build fast, safe, and highly reliable decentralized applications. Some of the most notable apps using its network are Atomic Wallet, Autofarm, and Carbon, among others. 

However, unlike other popular platforms like Solana and Ethereum, most of its applications are relatively small. In fact, according to DeFi Llama, the ecosystem has seen its total value locked (TVL) crash to just $20 million. In contrast, other popular platforms like Ethereum have a TVL of over $100 billion. However, statistics by Zilliqa places the TVL at $363 million, which is a substantial figure.

Zilliqa used to be a fallen angel as competition in its industry escalated. It saw its ranking among the biggest cryptocurrencies in the world. Its popularity waned and it moved out of the top 100.

Zilliqa made headlines in March when it announced its entry to the metaverse by partnering with Metopolis. At the time, the coin’s price surged to a high of $0.2300, pushing it into the top 50.

Recently, however, the coin’s hype has faded while the number of activity has declined sharply. For example, the number of smart contracts has been in a major decline after peaking in March. The number of new addresses in the network has also declined.

Zilliqa price prediction

The four-hour chart shows that the ZIL price has been in a strong bearish trend in the past few weeks. The decline accelerated after the pair crossed the key support level at $0.1010, which was the lowest level on April 17th. It has also moved below the 25-day and 50-day moving averages while the Stochastic Oscillator has moved below the oversold level. 

The Relative Strength Index has also moved to the oversold level. Therefore, the Zilliqa price will likely continue dropping as bears target the key support level at $0.05 in May. Learn how to trade cryptocurrency here.

The post Zilliqa price prediction for May 2022: Will it rebound? appeared first on Coin Journal.

Why is LUNA up by more than 4% today?

The cryptocurrency market is experiencing a mixed start to the week, but LUNA is performing above the other leading coins.

The broader crypto market is experiencing a mixed start to the week. The total market cap is up by less than 1% in the last 24 hours and currently stands above $1.7 trillion.

Bitcoin is up by nearly 2% so far today and could be set to target the $40k resistance level soon. However, the other major cryptocurrencies are currently underperforming.

LUNA, the native token of the Terra ecosystem, is the best performer amongst the top 10 cryptocurrencies by market cap.

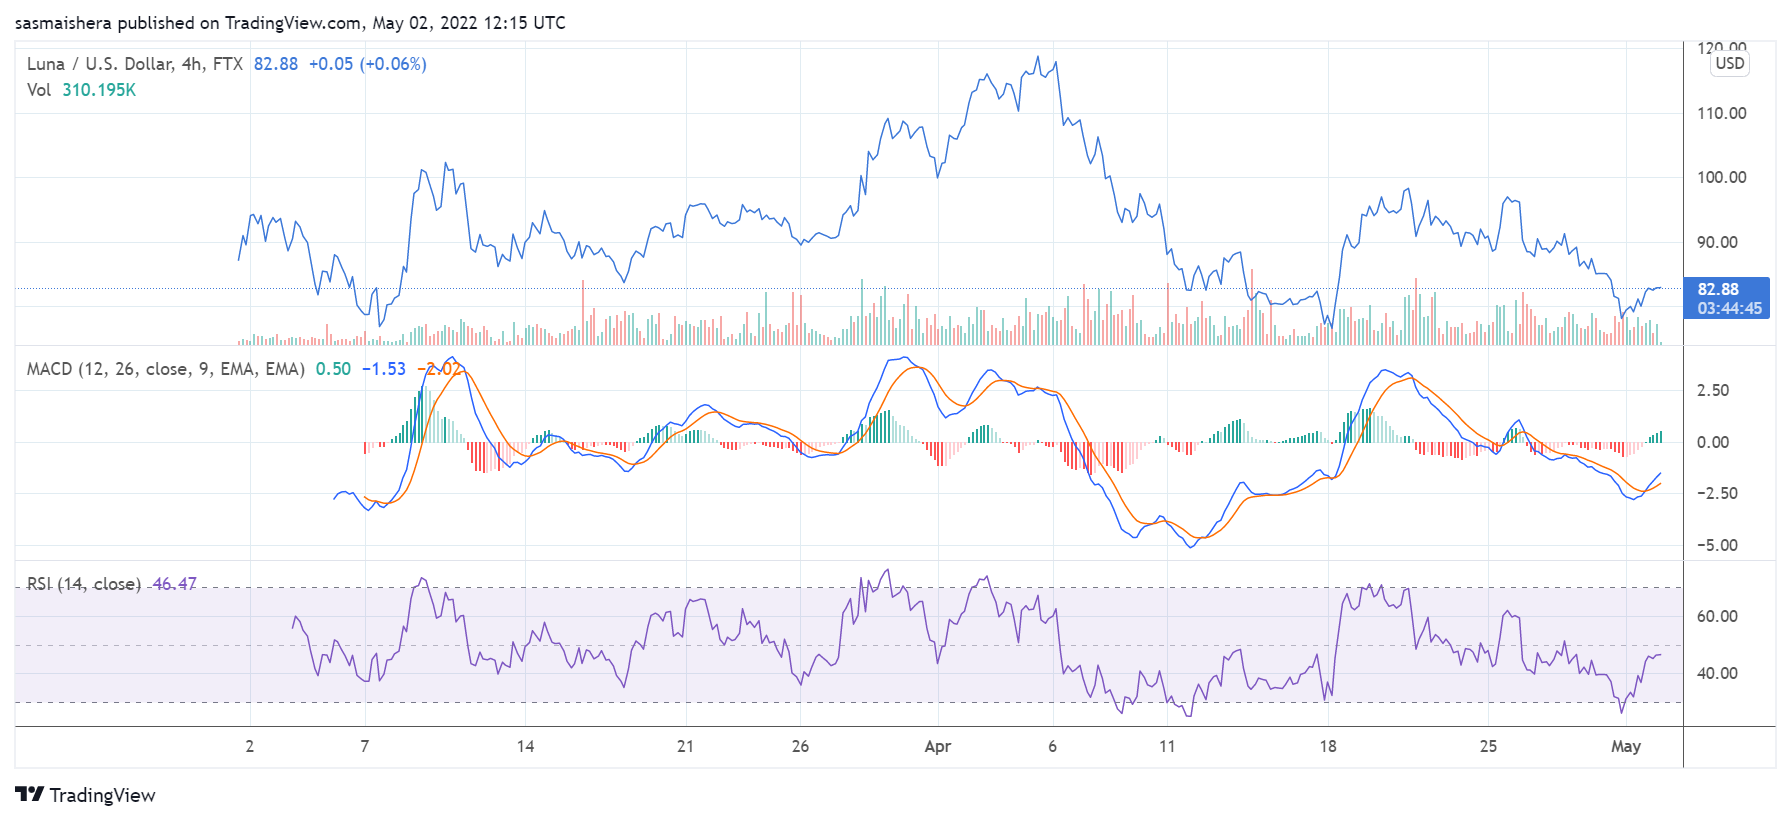
LUNA has added more than 4% to its value in the last 24 hours and currently trades above $83 per coin. The rally comes as UST, the stablecoin of the Terra ecosystem, overtook BUSD (Binance’s stablecoin) to occupy the tenth place in the cryptocurrency market. 

The rally can also be attributed to Celsius Network’s recent adoption of Terra’s UST stablecoin. Celsius Network is one of the leading centralised finance entities currently operating in the crypto space.

Key levels to watch

The LUNA/USD 4-hour chart is bearish as LUNA has been underperforming in recent days. However, the technical indicators show LUNA’s price action is improving.

The MACD line is still below the neutral zone, indicating that the recent bearish trend is still affecting LUNA’s performance. The 14-day RSI of 49 shows that LUNA is no longer in the oversold region.

If the positive performance continues, LUNA could surge past the first major resistance level at $90.52 before the end of the day. However, it would need the support of the broader market to cross the $95.31 resistance point. 

If the bears regain control of the market, LUNA could slip below the $80 over the next few hours. Unless there is an extended bearish run, LUNA should comfortably stay above the $75 support level in the short term. 

The post Why is LUNA up by more than 4% today? appeared first on Coin Journal.

Solana price prediction for May 2022: Worrying pattern forms

Solana price held steady on Monday morning even as the network’s outage challenges continued. The SOL token is trading at $90.50, which is about 11% above the lowest level in April. Its market capitalization remains at over $30 billion, making it one of the biggest cryptocurrencies in the world.

Solana suffers another outage

Solana price did well during the weekend as investors reacted to the latest outage in the network. During the weekend, the network suffered a seven-hour outage as the number of bots in the network rose. According to reports, these bots were attempting to mint NFTs in the network. 

The specific NFT that was being attacked was Candy Machine. The rising number of these bots caused the mainnet to fall out of consensus and crash as nodes collapsed under the weight. 

During the bot attack, traffic to the network soared to over 4 million transactions per second. In normal times, Solana is able to handle less than 3,000 transactions per second.

Solana has seen other outages in the past. For example, in January, it suffered an 18-hour outage. And in 2021, it suffered several multi-day outages, leading to significant disruptions in the network. 

The rising outages in the network have had a negative impact on Solana’s network in the past few months. For one, the total value locked (TVL) in the network has dropped by 24% in the past month. 

However, there have been some positives. For example, Solana was in the spotlight in April as the value of Stepn’s GMT continued jumping. It is now worth over $2 billion, making it the biggest move-to-earn cryptocurrency in the world. As such, Solana is positioning itself to be a major player in the Web 3.0 industry. 

Solana price prediction

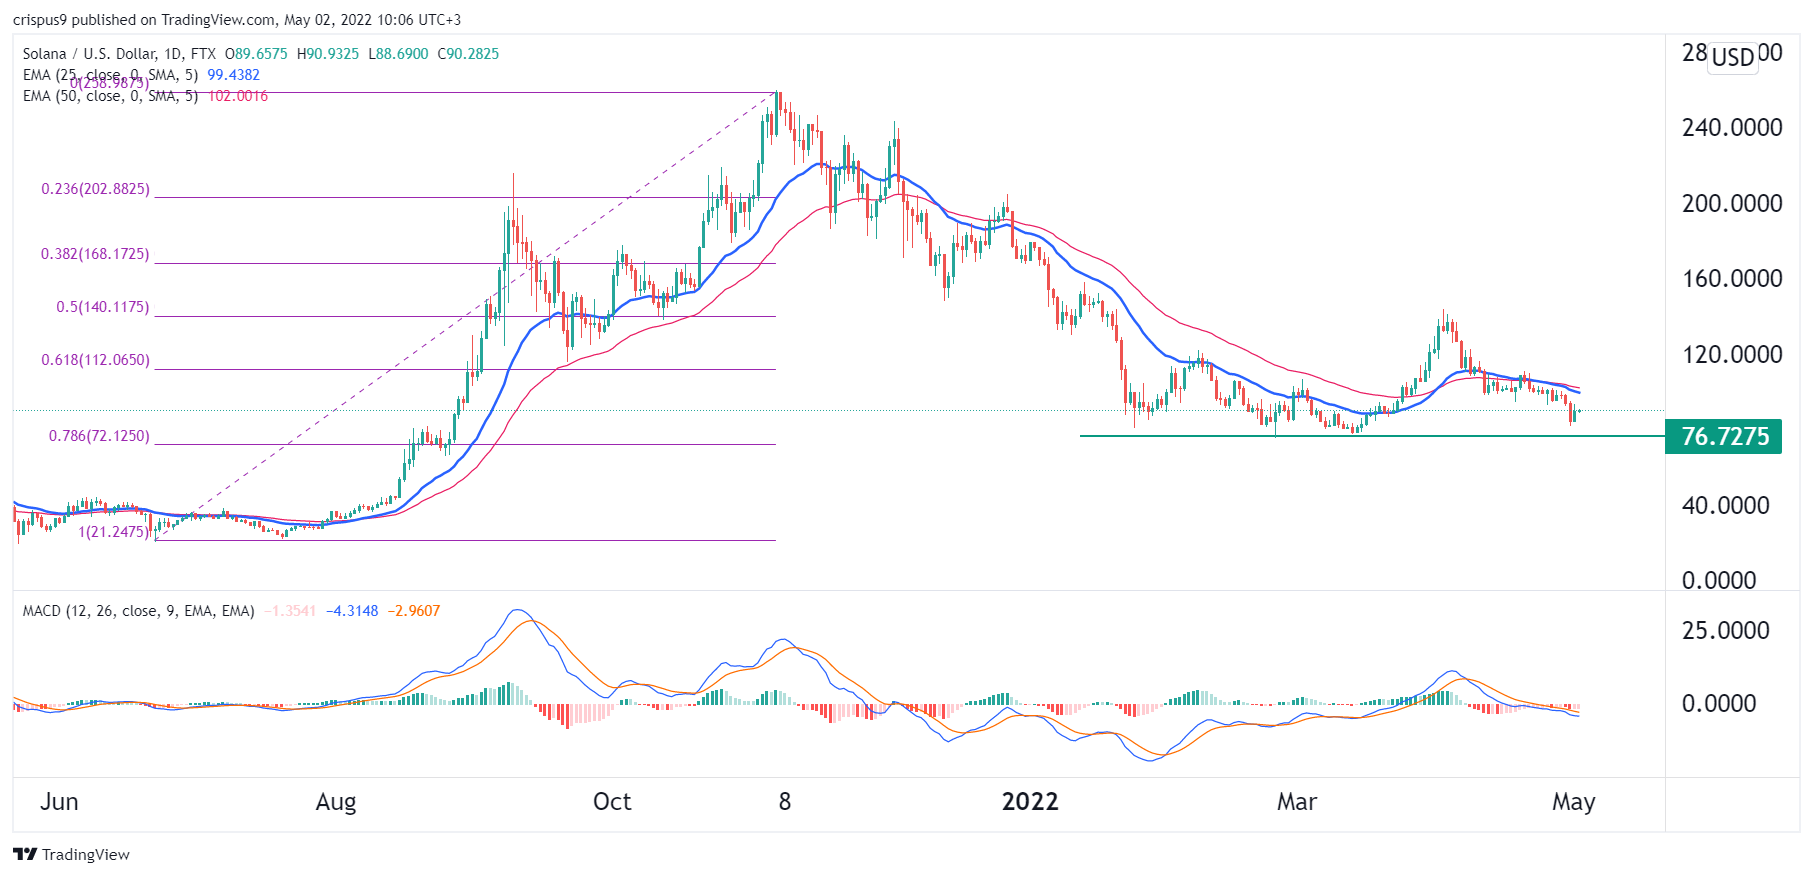
The SOL price has been in a bearish trend in the past few weeks. The current price has moved below the April high of $144. The price is approaching the important support level at $76.72, where it has struggled to move below this year. The coin has also dropped below the 25-day and 50-day moving averages while the MACD has moved below the neutral level.

A closer look also shows that the Solana price has formed a head and shoulders pattern. Therefore, there is a likelihood that the coin will have a major bearish breakout in May. This view will be invalidated if the coin moves below $76.72.

The post Solana price prediction for May 2022: Worrying pattern forms appeared first on Coin Journal.