Here is why DOGE is up by more than 24% in the last 24 hours

The broader cryptocurrency market has been performing well so far this week, but Dogecoin is currently leading the gains.

The cryptocurrency market is erasing the losses recorded over the weekend. The total market cap has increased by more than 3.5% over the past 24 hours and currently stands above $1.8 billion.

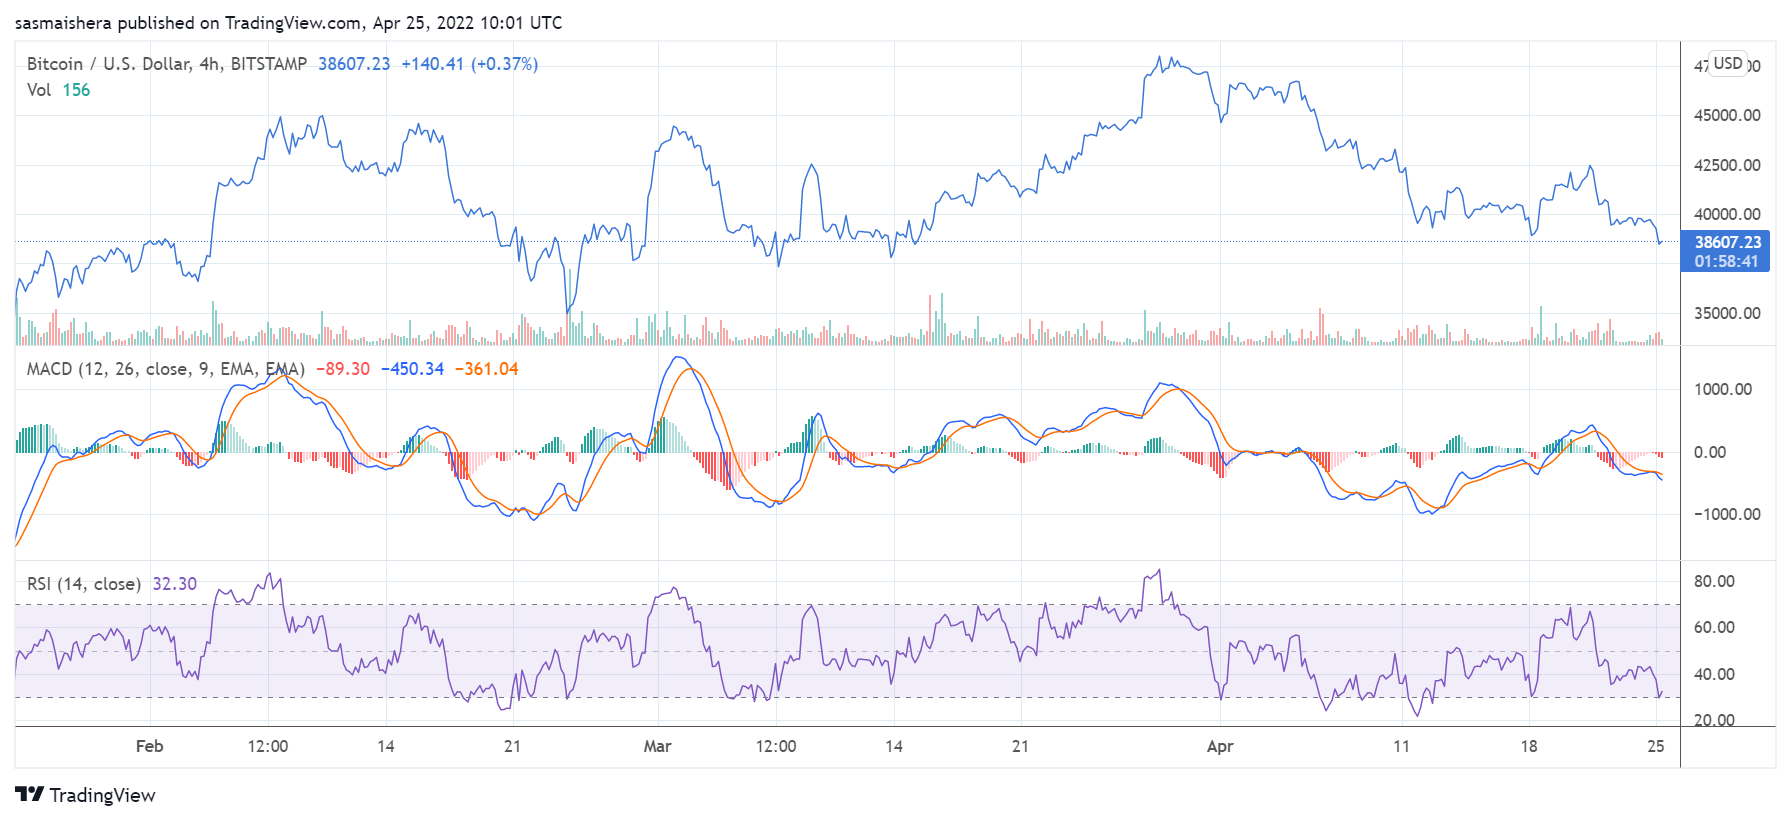
Bitcoin is trading around the $40k psychological level again, while Ether also rallied by 5% in the last 24 hours to reach the $3,00 mark.

However, DOGE, the native token of the Dogecoin ecosystem, is the best performer amongst the top 20 cryptocurrencies by market cap over the past few hours. DOGE is up by more than 20% over the past 24 hours.

The rally has DOGE overtake Avalanche and now occupies the tenth place in the market in terms of market cap.

DOGE’s ongoing rally is fueled by the news that Twitter’s board has accepted Elon Musk’s offer to acquire the company.

Musk is a huge fan of Dogecoin and investors are optimistic he will rollout DOGE payment options on the social media platform.

Key levels to watch

The DOGE/USD 4-hour chart is currently bullish as Dogecoin has outperformed the other major cryptocurrencies in the last 24 hours. The technical indicators show that DOGE has overcome its latest bearish trend.

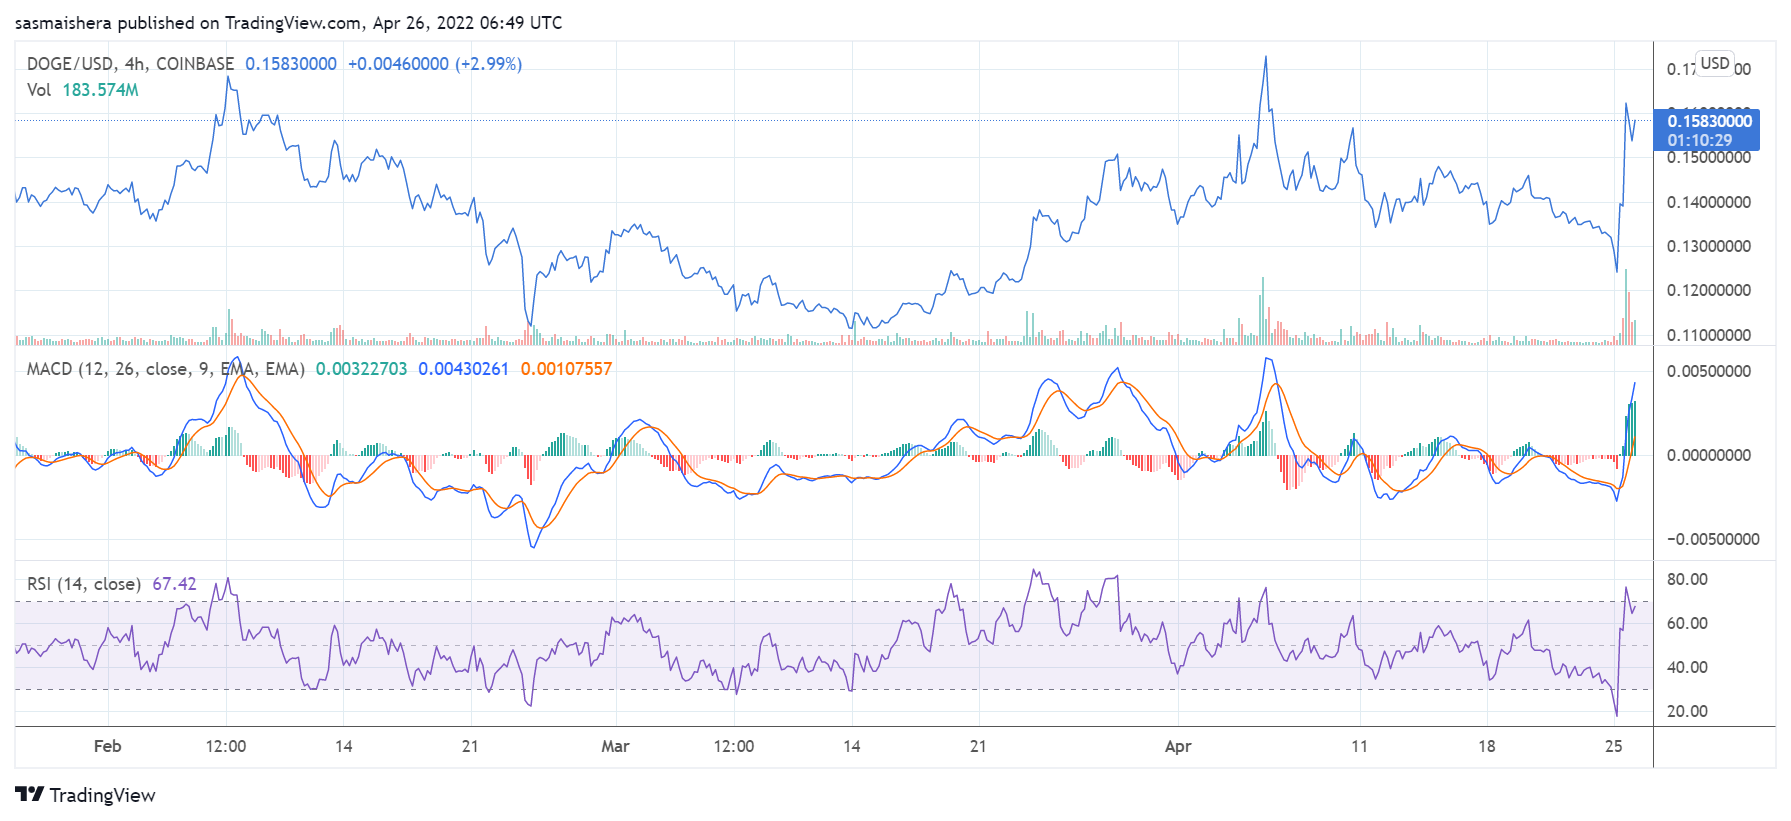
The MACD line is above the neutral zone, indicating a bullish momentum for Dogecoin. The 14-day relative strength index of 67 indicates that Dogecoin could soon enter the overbought region if the momentum is sustained.

At press time, DOGE is trading at $0.158 per coin. If the bulls remain in charge, DOGE could surpass the first major resistance level at $0.165 before the end of the day.

However, with the support of the broader cryptocurrency market, DOGE could trade above the $0.175 level for the first time in months. 

The post Here is why DOGE is up by more than 24% in the last 24 hours appeared first on Coin Journal.

Top crypto price predictions: Zilliqa and Near Protocol

Cryptocurrency prices crashed on Monday as fear in the market escalated. Bitcoin dropped below $40,000 while the total market capitalization dropped to over $1.87 trillion. Some of the worst-performing coins were Near Protocol, Mina Protocol, Zilliqa, Moonbeam, and Axie Infinity, which have dropped by more than 10% in the past 24 hours. 

Investors are  getting fearful

Cryptocurrencies dropped as the mood in the market rose sharply. Indeed, a closer look across various asset classes are deeply in the red. For example, in the commodities market, the price of crude oil crashed by more than 4% while gold and silver dropped by over 2%. This makes it one of the worst days in the commodities index this year. The Bloomberg Commodity Index (BCOM) dropped by over 1.9%. 

The stock market also crashed. For example, in Europe, the CAC 40, DAX index, and FTSE 100 indices crashed by over 2%. In the United States, the Dow Jones dropped by more than 1,000 points. It has lost over 200 points in the futures market.

Therefore, cryptocurrencies are falling as investors react to the ongoing fear that the Federal Reserve and other central banks. In a statement last week, Jerome Powell warned that the bank will embrace a more hawkish policy in the coming months. As a result, the fear and greed index has moved to the extreme fear zone of 23.

Zilliqa price prediction

The daily chart shows that the ZIL price has been in a strong bearish trend in the past few days. The coin has moved below the important level at $0.1285, which was the highest point on October 21st. It has crashed by over 57% from its highest level this month. 

It has fallen to about $1.3 billion while the MACD indicator has moved below the neutral level. Therefore, there is a likelihood that the coin will continue falling as bears target the next key support level at $0.08.

Near Protocol price prediction

On the 1D chart, the Near Protocol price has dropped in the past 6 straight days. A closer look shows that the downward trend has been actually gaining momentum. It has also managed to move below the 25-day moving average while the MACD is close to falling below the neutral level. 

The coin has also formed what looks like a handle of its cup and handle pattern. Therefore, there is a likelihood that the shares will resume the bullish trend.

The post Top crypto price predictions: Zilliqa and Near Protocol appeared first on Coin Journal.

Bitcoin risks dropping towards $35k as the bearish trend thickens

The cryptocurrency market underperformed over the weekend, and Bitcoin could record further losses soon.

The broader cryptocurrency market has been in a bearish trend over the weekend. In the last 24 hours, the total cryptocurrency market cap has dipped by more than 4% and currently stands above $1.7 trillion.

Over the past seven days, the broader crypto market has lost more than $200 billion. Bitcoin remains the number one cryptocurrency by market cap but has recorded losses over the past few days.

At press time, Bitcoin is trading above $38k per coin, down by more than 2% over the last 24 hours. If the market momentum is maintained, Bitcoin could face further selling pressure and could slip towards the $35k psychological level before the end of the week.

Key levels to watch

The BTC/USD 4-hour chart is bearish at the moment as the bearish sentiment in the market thickens. The technical indicators show that BTC could suffer further losses over the coming hours and days. 

The MACD line is below the neutral zone, indicating strong bearish momentum for Bitcoin. The 14-day relative strength index of 48 shows that Bitcoin could soon enter the oversold region if the current market condition persists.

If the bears remain in control, Bitcoin could slip below the first major support level at $37,102 before the end of the day. This would be the first time Bitcoin will trade below $38 since the start of the month.

In the event of an extended bearish run, Bitcoin could be forced to defend the second major resistance level at $35,289. Bitcoin hasn’t tested the $35k psychological level since February.

However, if the bulls regain control, Bitcoin could test the $40k resistance level over the next few hours. The second major resistance level at $42,154 should cap any further upward movement in the short term.

The post Bitcoin risks dropping towards $35k as the bearish trend thickens appeared first on Coin Journal.

Polkadot’s (DOT) failed rally exposes the coin to serious downside risks

Polkadot (DOT) has entered a make-or-break period after several failed attempts to rally. The coin has remained sluggish, and what happens next could either send the price sharply lower or push it higher in a more decisive way. Here are some notable facts:

  • DOT has been trading between a range of $16 and $23 for most of the year

  • At the moment, it is on the lower side of that range at around $17.3 in price

  • A drop below $16 could prove catastrophic for DOT bulls

Data Source: Tradingview 

Is Polkadot heading for a sell-off?

As noted above, Polkadot has reached a make-or-break moment. The coin has ranged between $16 and $23 for most parts of 2022. In fact, this range is shaping out to be a long-term trend and as such, it is important to watch it. 

For DOT bulls, the key is to make sure the price stays within this range. If bears push the coin below $16, then everything may start to unravel. DOT will face a stiff sell-off and may end up bottoming at $8 in the near term. 

But there is a flip side to all this. It depends on if DOT will maintain its $16 – $23 range. If the coin can manage to stay above $16 for a few days, then a run towards $23 will be well on and truly in sight.

Polkadot’s long term upside

The longer-term upside for DOT is still positive. The coin could still deliver 3x in value from its current price by the end of 2022. But in the short term, it’s hard to see the token going past $23. 

The trend line that we have discussed above appears strong. As such, DOT will likely bounce off between $16 and $23 in the near term. But this theory will become invalid if the price falls below $16 in the days ahead.

The post Polkadot’s (DOT) failed rally exposes the coin to serious downside risks appeared first on Coin Journal.

Stellar (XLM) price analysis: Why bulls must hold $0.18 support

Stellar (XLM) has seen a period of recovery after going off the cliff at the start of April. However, after hitting a high of around $0.24, XLM has gone through a serious correction. As a result, the coin is facing a lot of downward pressure. Here are some takeaways:

  • Despite the recent sell-off, XLM is still holding the crucial $0.18 support.

  • Any fall below $0.18 could precipitate a decisive downtrend in the near term.

  • The coin is however looking strong and could push further upwards.

Data Source: Tradingview 

Stellar (XLM) – The downside risks

The current downtrend that we have seen with XLM is slowing. Even though the coin has lost around 5% over the last 24 hours, there is enough to suggest that any further decline is not on the horizon. But the key for XLM bulls would be to make sure that the price action stays well above $0.18. 

In the past few weeks, this price has proved to be a strong support zone. If bulls are however not able to hold it, we could see XLM spiral into a much-prolonged downtrend. In the end, the coin may hit its March lows of $0.16 before it tries to find any upward momentum. 

But even with these downside risks, it is important to note that the upward potential for XLM still remains very uncertain. As of now, $0.24 remains the upward cap. Even if the coin rallies in the days ahead, it is unlikely to cross $0.24 anytime soon.

Is Stellar a decent buy today?

From a short-term point of view, it would be best to monitor XLM till Monday and see if it manages to maintain $0.18. If this happens, then you can enter and exit right before $0.24. But if the coin falls below $0.18, you must give it a week or so for the price to bottom before you buy.

The post Stellar (XLM) price analysis: Why bulls must hold $0.18 support appeared first on Coin Journal.