Bitcoin cash (BCH) price has plummeted by 97% from ATH. Buy the dip?

The bitcoin cash price collapsed to the lowest level since February 2019 as demand for the coin crashed. BCH is trading at $108.47, which is about 97% below the highest level in 2021. As a result, the coin’s market cap has crashed to about $2 billion, making it the 32nd biggest cryptocurrency in the world.

BCH and BTC correlation

Bitcoin cash is a leading cryptocurrency that was born from a hard fork of the main Bitcoin. As such, the two coins have a similar role in that they are widely used to make online transactions. 

For a long time, BCH and BTC had a close correlation because of their wide spread. At the time, Bitcoin Cash used to rise whenever BTC jumped and vice versa. In most cases, investors used to buy the cheaper BCH when Bitcoin rose. 

In the past few months, however, this correlation has eased a bit. For example, in November when Bitcoin soared to an all-time high of almost $70,000, Bitcoin was about 62% below its all-time high. Today, while BCH is approaching its all-time low, Bitcoin is still substantially higher than its record low.

The disconnect between BCH and BTC is mostly because the number of people using bitcoin cash on a regular basis has collapsed. A quick look at on-chain data shows that the amount of BCH transacted every day started falling in 2021. 

Learn more about how to buy bitcoin with PayPal.

The bitcoin cash price has also collapsed because of macro factors. For example, there is the lingering fear of a recession in the United States as the Fed hikes interest rates. Recent data shows that key sectors of the economy are falling. For example, retail sales, services, and manufacturing have all declined.

At the same time, the Federal Reserve has started hiking interest rates. It has hiked by 150 basis points and hinted that it will deliver more increases in the coming months.

Bitcoin Cash price prediction

The daily chart shows that the BCH price has been in a strong bearish trend in the past few months. It has crashed 13 days straight and is approaching its lowest level on record. The coin has fallen below the 25-day and 50-day moving averages while the Relative Strength Index (RSI) has moved to the oversold level of 26.

Therefore, at this stage, there are no signs that bitcoin cash price is close to its bottom. As such, the coin could continue falling as bears target the all-time low of $53.

The post Bitcoin cash (BCH) price has plummeted by 97% from ATH. Buy the dip? appeared first on CoinJournal.

SOL price outlook following bearish sentiment in cryptos

  • Solana’s SOL token plunges 79% YTD

  • Token affected by network outages and overall bearish market

  • SOL faces resistance at $36

Solana is an open-source blockchain project aimed at supporting decentralized applications. The network uses a hybrid consensus model comprising the proof-of-history and proof-of-stake algorithm.

Founded in 2017 by Anatoly Yakovenko and Greg Fitzgerald, Solana has been keen on making its transactions scalable and low-cost. Its developers cited the slow transactions in PoW networks and how its timestamp technology could solve the drawbacks.

Solana’s popularity surged in 2021 when it was poised to be the ‘Ethereum killer.’ However, the blockchain now seems to be a shadow of itself. Aside from the crypto crash in the first half of 2022, Solana has suffered numerous network outages. The challenges have shaken the confidence of its community driving value downwards.

SOL drops 79% year-to-date 

According to the year-to-date price outlook, Solana has plunged 79% since trading at $173. The sell-off has also seen the token tank 86% since peaking at $258 in 2021, according to data from CoinMarketCap. SOL’s market capitalization has then decreased from $77 billion to $12 billion.

Solana’s total value locked is currently at $2.61 billion at #5 behind Ethereum, BSC, Tron, and Avalanche as per Defi Llama. Ethereum and BSC have $47.43 billion and $6.23 billion in TVL, while Tron and Avalanche have $5.3 billion and $2.7 billion, respectively.

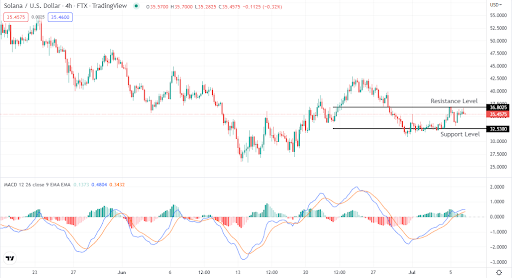
SOL meets resistance at $36 (4-hour chart) 

Source: TradingView

From the 4-hour chart above, SOL has found resistance at $36. The token is, however, showing some bullish momentum having moved from $32. The MACD indicator is also bullish. The latest data from CoinMarketCap shows that SOL is currently trading at $35.79, after a surge of 5.81% in the past day and a jump of $2.93% in the past week.

Summary

Although Solana seems to be losing popularity, traders can still benefit from the short-term gains. The recent network outages and the overall bearish sentiment are some factors affecting SOL price. A surge above the $35 resistance can usher in some bullish momentum, and the $42 will be the next resistance to watch.

The post SOL price outlook following bearish sentiment in cryptos appeared first on CoinJournal.

ThorChain price prediction: RUNE could have a breakout to $3

ThorChain price has rebounded in the past few days as investors continue cheering the recent transition to mainnet. RUNE is trading at $2.20, which is about 53% above the lowest level this year. Its market cap stands at over $668 million, making it the 69th biggest cryptocurrency in the world.

Why is ThorChain rising?

ThorChain is a leading blockchain platform built using Cosmos SDK. It is a product that provides decentralized and autonomous cross-chain liquidity. According to its website, the platform has helped to facilitate on-chain swaps worth over $4.2 billion. It has a total value locked (TVL) worth over $299 million.

The RUNE price has done relatively well in the past few days as investors cheer the launch of the platform’s mainnet after four years of development. In 2021, the developers launched the Multichain Chaosnet (MCCN) that allowed the community to test and use its products and propose improvements.

ThorChain currently supports swaps across seven ecosystems, including bitcoin, ether, Binance coin, dogecoin, litecoin, bitcoin cash, and rune. In a statement, the developers said that they will soon support ATOM and AVAX.

In addition to this mainnet, the developers are working on allowing synthetic assets to the network. Synthetic assets are products that give investors access to derivatives like stocks, forex, commodities, and exchange-traded funds (ETF). One of the leading players in this industry is Synthetix.

The RUNE price is now rising as investors compete for rewards with $50,000 that the developers are offering. All users who deposit at least 250 RUNE via the mainnet will be eligible for rewards. This reward will be based on the amount that users deposit.

RUNE price prediction

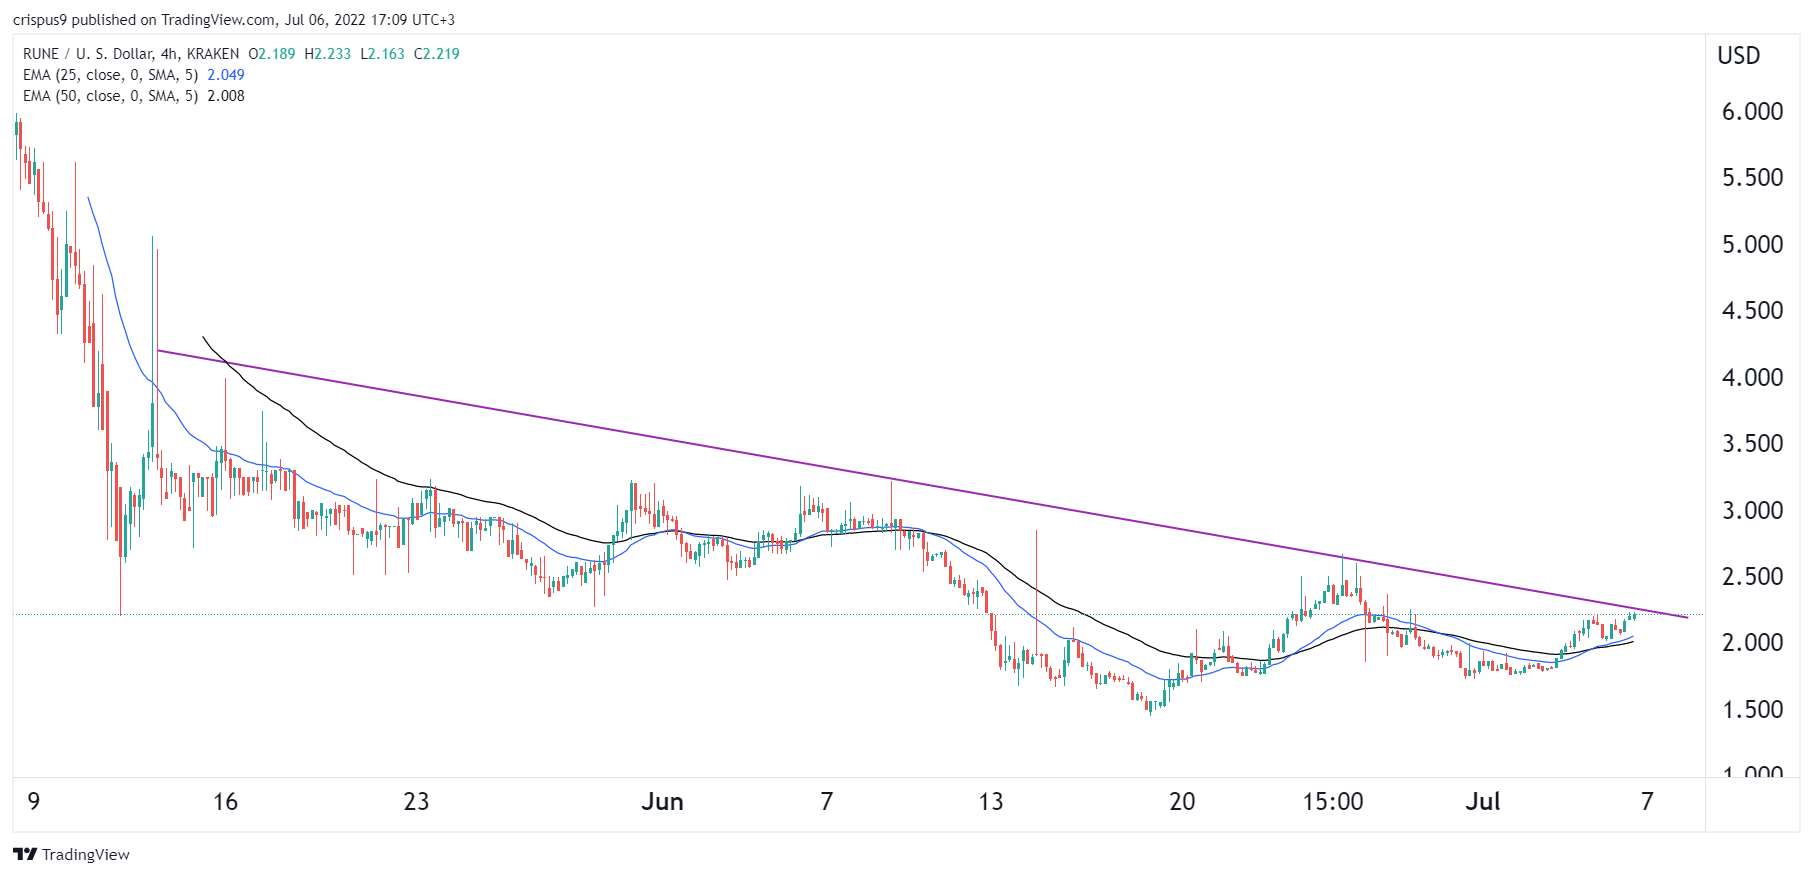
The four-hour chart shows that the ThorChain price has been in an upward trend in the past few days. The stock is now trading at an important resistance that is shown in purple. This line connects the highest points since May this year. 

The coin has also risen above the 25-day and 50-day moving averages. It also seems like it has formed an inverted head and shoulders pattern.

Therefore, the coin will likely have a bullish breakout to $3 in the coming days. This view will be confirmed if RUNE manages to move above the purple trendline.

The post ThorChain price prediction: RUNE could have a breakout to $3 appeared first on CoinJournal.

Here is why SAND is up by more than 13% in the last 24 hours

The cryptocurrency market has performed positively for the third consecutive day this week.

The cryptocurrency market is performing positively after adding 1% to its value in the last 24 hours. The total market cap remains above $900 billion as Bitcoin and the others perform well.

Bitcoin has maintained its price above $20k after adding more than 1% to its value. In the last seven days, BTC is up by less than 1%. 

Ether continues to eye the $1,200 resistance level after going up by less than 1% in the last 24 hours.

However, SAND, the native token of The Sandbox metaverse, is the best performer amongst the top 40 cryptocurrencies by market cap. SAND has added more than 13% to its value in the last 24 hours and currently trades above $1.2 per coin.

SAND’s ongoing rally can be attributed to the launch of The Sandbox Bug Bounty program a few hours ago. 

According to the team, the bounty program is designed to get the community involved and reward users for reporting bugs on The Sandbox’s smart contracts already in production.

Key levels to watch

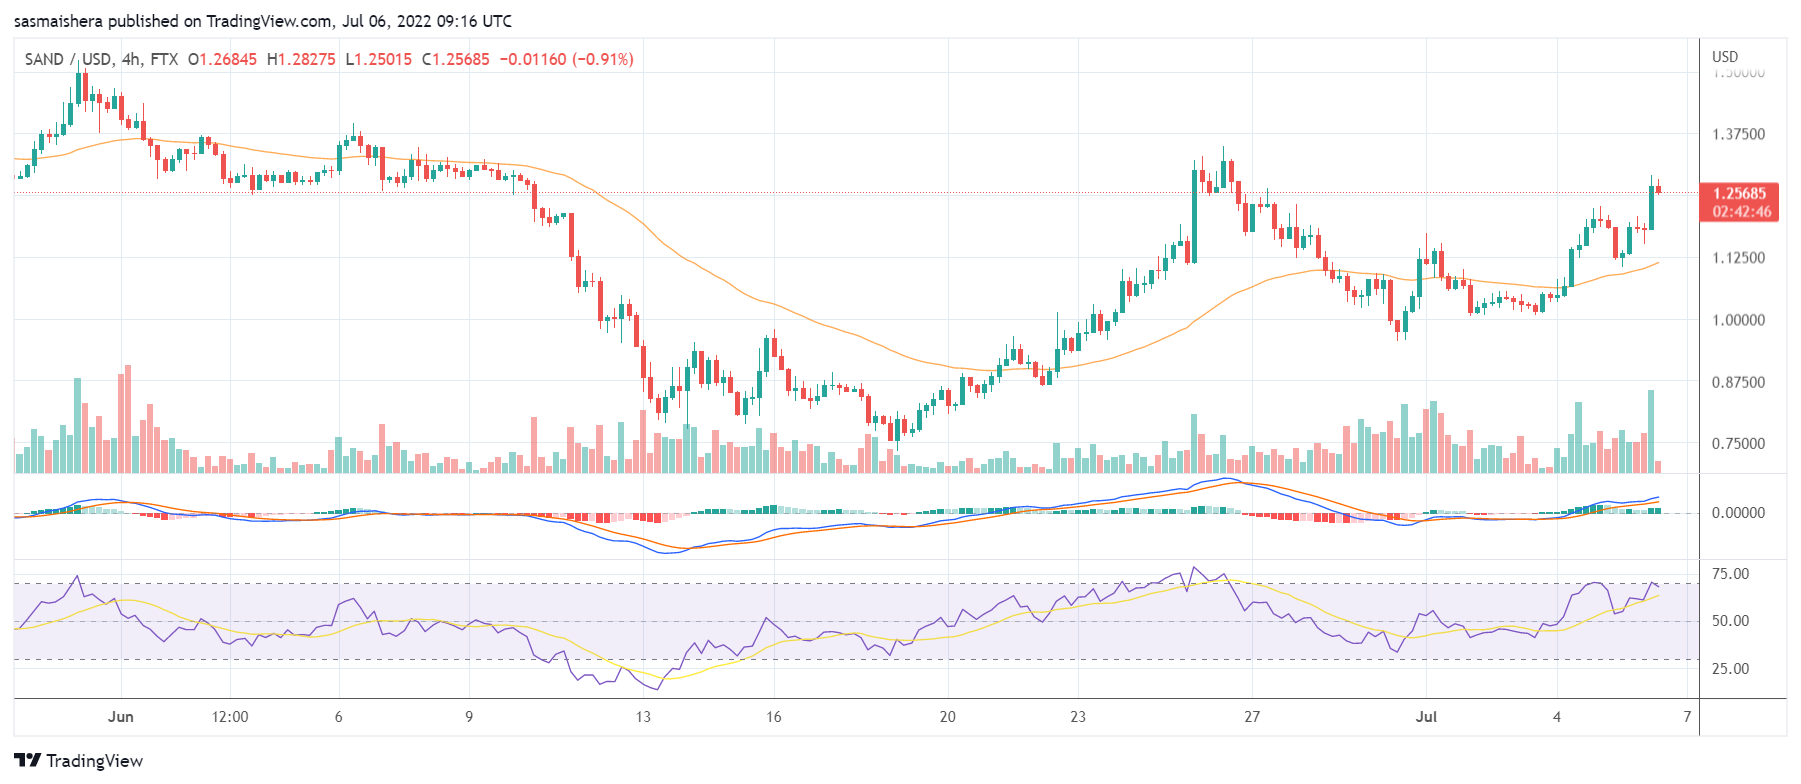
The SAND/USD 4-hour chart is positive as The Sandbox has been performing well in recent days. The technical indicators show that SAND is outperforming the broader cryptocurrency market at the moment.

The MACD line crossed into the positive zone earlier this week and has remained there as SAND has been rallying. 

Meanwhile, the 14-day relative strength index of 71 shows that SAND could soon enter the overbought region if the momentum continues. 

If the rally continues, SAND could surge past the $1.38 resistance level before the end of the day. An extended bullish performance could see SAND attempt to reach the $1.5 resistance point for the first time this month. However, it would need the support of the broader market to make such a move. 

The post Here is why SAND is up by more than 13% in the last 24 hours appeared first on CoinJournal.

XRP turns bullish and has up to 18% potential upsurge

  • Ripple’s XRP has gained by 4% in 24 hours.

  • Most cryptocurrencies are having relief rallies.

  • Technical indicators suggest that the XRP relief rally could continue in the short term.

After staging a bear market for a week, Ripple’s RP/USD is making a comeback. As of the time of writing, the cryptocurrency had returned more than 4% in the past 24 hours. There is no immediate trigger for the gains in XRP. However, a quick look into the crypto sector showed most cryptocurrencies are gaining. Bitcoin was up 6.28%, while Ethereum had returned at least 10%. So, was Tuesday’s gains a relief or a lasting rally?

Cryptocurrencies are known for their high volatility. Of late, they have become pegged to macro-events, including policy actions by central banks. We do not view the current macro-events as positive yet. It then follows that the gains posted in the last 24 hours are merely speculative. They do not indicate a long-term comeback in cryptocurrencies. Investors could still be looking for short-term opportunities in a beaten-down market. We believe that XRP is one of the cryptocurrencies that can offer short-term returns.

XRP stages a relief rally at a key support zone

Source – TradingView

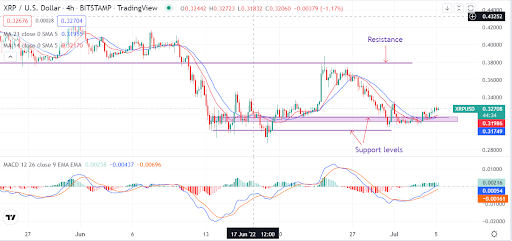
From the technical outlook, XRP is bullish after retesting the support of $0.31. The 14-day and 21-day moving averages have joined the support, suggesting a short-term bull run. The MACD line crossed above the moving average line, confirming a bullish push. We believe XRP is set for further gains in the next few days. Investors should still monitor the trade as the market remains largely bearish. The potential targets are $0.34, a short-term resistance, and an established level of $0.38. 

Summary

XRP is gaining as sentiment improves in the crypto sector. The longer trend is still bearish. The cryptocurrency could continue rising but will find resistance at $0.34 and $0.38.

The post XRP turns bullish and has up to 18% potential upsurge appeared first on CoinJournal.