Tezos prediction as token sets $2.26 as the next frontier

  • Tezos is likely to face competition after the Ethereum PoS merge.

  • Native XTZ token has flipped $1.68 resistance.

  • The token is bullish with $2.26 set as the next price level.

Tezos XTZ/USD is a proof-of-stake smart contract blockchain. It is among the networks referred to as the ‘Ethereum Killers’. The protocol is known for cheaper and faster transactions with the ability to evolve. Tezos’ native XTZ token is used in governance and utility.

Fundamentally, Tezos could face steeper competition with the upcoming Ethereum PoS shift. The Merge aims to enhance efficiency with less energy consumption in the second-largest blockchain. Lower DeFi, dApps, and NFT activity could affect the price of XTZ and the project’s total value locked.

Currently, Tezos’ total value locked stands at $32.12 million. The TVL is much lower compared to the largest DeFi protocol, MakerDAO. The latter has upwards of $8 billion TVL. Moreover, Tezos has suffered a decline in its supported NFT projects following a slowdown in the sector.  

Despite the gloomy prediction around XTZ, the token has posted impressive gains year-to-date. It has jumped 56% from the lowest level to a market capitalization of $1.7 billion. XTZ is currently exchanging for $1.96. It is up 6.92% in the past day and 8.86% in weekly gains. The technical chart below affirms the bullish trend in Tezos.

XTZ flips $1.68 resistance 
Source: TradingView

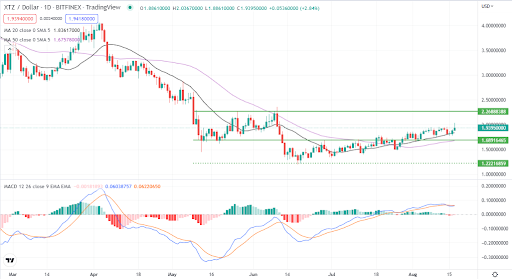
From the daily chart above, XTZ moved from a low of $1.26 in June. The trend of higher highs and higher lows pushed the token past the $1.68 resistance. The bullish momentum can be seen with the 20-day and 50-day moving averages. Both averages are currently holding as support.

Although the MACD shows a weakening surge, the momentum indicator remains bullish. If XTZ gets enough buyers, the next frontier could be on its way to $2.26.

Concluding thoughts

The fundamentals around Tezos are weak with the anticipated Ethereum merge and a cool-off in the NFTs. The token is eying $2.26, which is currently acting as the next resistance level. With most indicators aligning, investors should hold XTZ as long as it remains below the resistance level.

The post Tezos prediction as token sets $2.26 as the next frontier appeared first on CoinJournal.

What next for the FTX token as it fails another breakout?

  • FTX exchange has witnessed increasing trading volumes.

  • The exchange has remained stable while most crypto exchanges scaled down in the bear market.

  • FTT is correcting after failing a breakout for a second time.

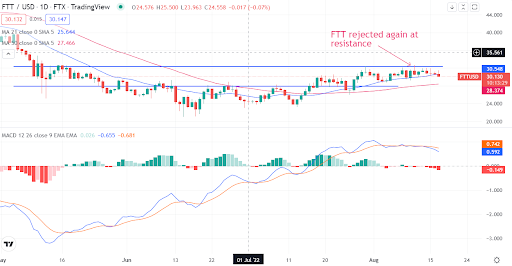
FTX token FTT/USD is once again sliding after hitting the $32 level. This is the second time in less than a month that the token has hit the level. It suggests that buyers are still pushing to break above the resistance zone. Exhaustion is settling in again after a failed second breakout.

Exchange-linked tokens are driven by a surge in trading volumes. FTX has been a beneficiary of slowdowns in trading volumes in rivals Coinbase and OKX. For example, in May, trading volumes on FTX rose by 80.8% to hit $69.4 billion. Coinbase saw a rise of only 10%, while OKX trading volumes fell by 29.4%. The rise in trading volumes underlined trust in FTX’s stability as most peers scaled down.

FTX’s growing role in the crypto space has been highlighted in the price recovery of its token FTT. The token has been trading on a bullish trendline since bottoming at around $21 in June.

FTT rejected at resistance, forcing a bear weakness

Source – TradingView

The MACD line has crossed below the moving average after FTT failed to break the $32 barrier. The token is also breaking below the short-term 21-day MA. The slowdown indicates bull exhaustion as the price hit $32.

FTT will continue to slide in the next few days. However, the most likely reversal zone is around $28. The level is a support, and bulls could look to arrest the bear weakness before sliding below the 50-MA.

Summary

FTX token faces further declines. However, the token could reverse at $28 or the 50-day MA. The token needs to clear $32 before moving higher.

The post What next for the FTX token as it fails another breakout? appeared first on CoinJournal.

Bitcoin Cash price prediction ahead of FOMC minutes

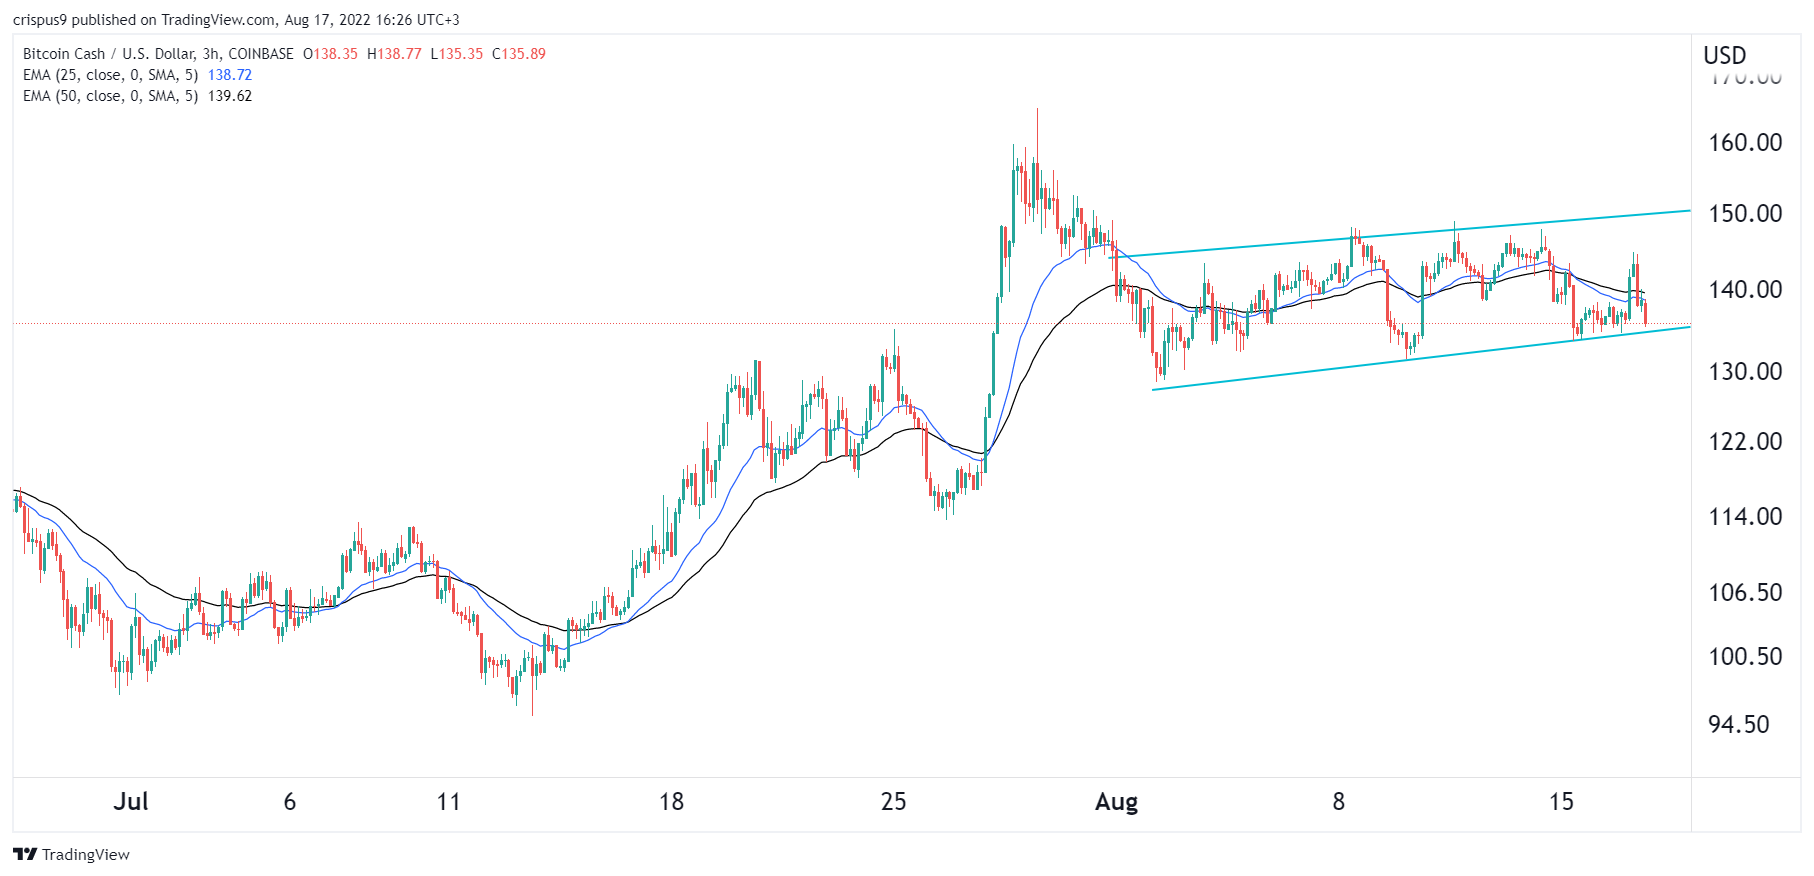
Bitcoin Cash price crashed sharply as investors waited for the upcoming FOMC minutes. The BCH token dropped to a low of $135, which was much lower than this month’s high of $147.90. Its market cap has dropped to over $2.6 billion.

FOMC minutes ahead

Bitcoin Cash and other cryptocurrencies declined sharply as the Fed prepares to publish minutes of July’s meeting. In that meeting, the bank decided to hike interest rates by 0.75% for the second straight month. As a result, the Fed has increased rates by 225 basis points this year. 

These minutes will provide more color about what the FOMC officials deliberated on in that meeting. In most cases, they usually offer more information on what the bank will do in the next meeting. Economists expect that the minutes will provide a hint that the bank will hike by either 0.50% or 0.75% in the coming meeting.

A lot has changed since the Fed met in July. For one, the Bureau of Labor Statistics published encouraging inflation and jobs data. Numbers delivered earlier this month showed that the economy created over 528k jobs in July while the unemployment rate dropped to 3.5%.

Additional data showed that the country’s inflation dropped from 9.1% in June to 8.7% in July of this year. Still, the figure is above the Fed’s target of 2.0%. In addition to cryptocurrencies, stocks also declined in the futures market. Dow Jones dropped by 240 points while Nasdaq 100 fell by 150 points.

Bitcoin Cash price prediction


The four-hour chart shows that the BCH price declined sharply ahead of the upcoming FOMC minutes. As it dropped, the coin managed to test the lower side of the ascending channel shown in green. It also moved below the 25-day and 50-day moving averages while the Relative Strength Index (RSI) tilted lower.

Therefore, Bitcoin Cash price will likely resume the bullish trend as buyers target the upper side of the ascending channel. This price is at $150. A drop below the channel will signal that bears have prevailed and push the coin to a low of $130.

The post Bitcoin Cash price prediction ahead of FOMC minutes appeared first on CoinJournal.

Why is EOS up by more than 30% in the last 24 hours?

The cryptocurrency market is turning things around today, and EOS is one of the best-performing cryptocurrencies among the top 50 coins.

EOS, the native coin of the EOSIO ecosystem, is the best performer amongst the top 50 cryptocurrencies by market cap. EOS has added more than 30% to its value in the last 24 hours.

The rally comes as EOSIO is set for a rebrand. The EOSIO is the blockchain, and it is set for a major rebrand. The rebrand would also lead to the fork of the EOS coin. According to the team, the EOS Network Foundation would soon be in charge of the EOS blockchain. 

The rally comes as the broader cryptocurrency market is recovering from the slump it suffered earlier this week. For the first time this week, the cryptocurrency market is trading in the green zone.

The market has added more than 1% to its value over the past 24 hours, with the total market cap now around $1.15 trillion.

Bitcoin is still trading above $24k per coin, while Ether has surged past the $1,900 mark again after adding more than 2% to its value in the last 24 hours.

Key levels to watch

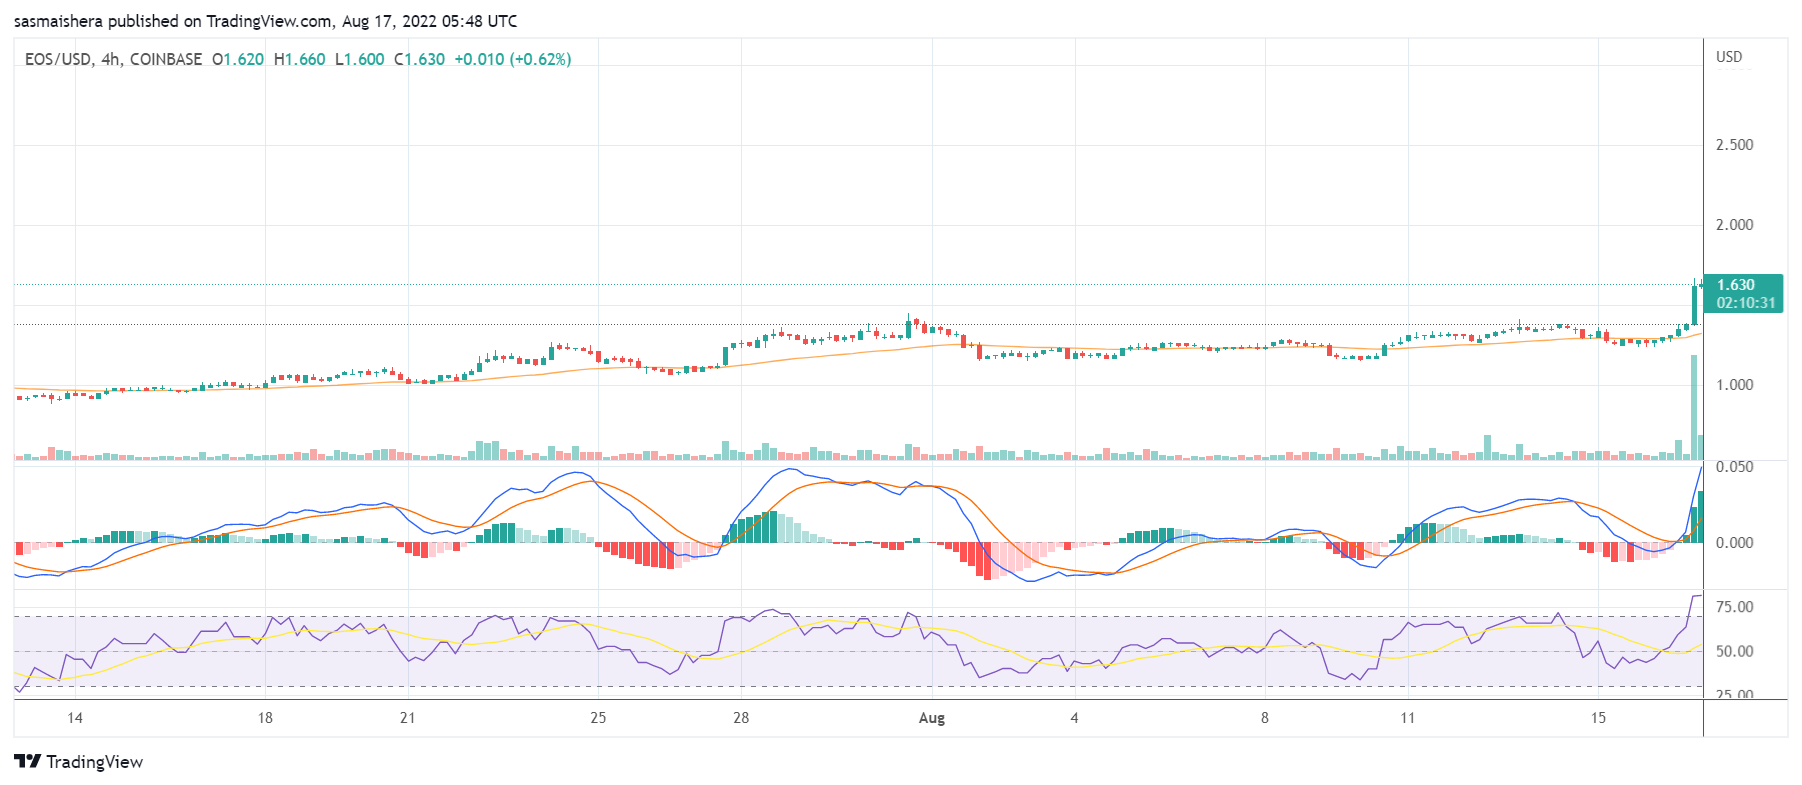
The EOS/USD 4-hour chart is one of the most bullish charts amongst the top 100 cryptocurrencies by market cap.

The MACD line is deep within the positive zone, indicating that EOS is experiencing a bullish momentum at the moment.

The 14-day RSI of 81 shows that EOS is currently in the overbought region after rallying by more than 40% over the past seven days.

At press time, EOS is trading at $1.620 per coin. If the rally continues, EOS could trade above the $2.059 resistance point for the first time since May.

However, EOS could need the support of the broader crypto market to make a move past the $2.488 resistance level over the next few days.

The post Why is EOS up by more than 30% in the last 24 hours? appeared first on CoinJournal.

Has Solana started a bear reversal, or is it just a correction?

  • Solana has been dropping for the last 3 months.

  • The token is yet to break below key support, the recent breakout zone.

  • Solana could head to $60 next if it overcomes the latest weakness.

Solana SOL/USD has lost 1.90% in the last 24 hours. The token remains in the green for the past one week. Our earlier projection set the target at $60, following a key breakout at $43. Solana seems to have lost its previous aggressive bull surge after 3 consecutive days of decline. This thesis interrogates further whether the recent decline is long-lasting or short-lived.

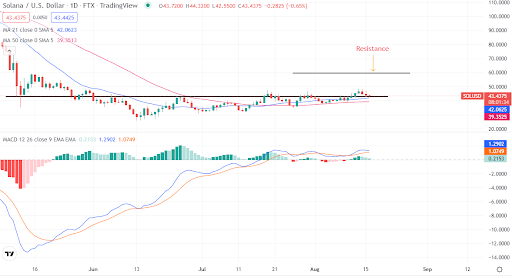
The bearish move of Solana takes the price to $43.44 at press time. We find that Solana’s support is at $43. It suggests that the token is retesting the support, and we are yet to confirm a bearish reversal. 

Further scrutiny of Solana shows that the token is on a clear uptrend. The cryptocurrency has successfully overcome the latest hack-inspired decline. It has maintained a system of higher highs and higher lows. The momentum has still not been the strongest.

Solana remains supported at $43 amid bear weakness

Source – TradingView

Technically, the indicators read bullish for SOL. From the daily chart outlook, the MACD line closed above the moving average, confirming bullish momentum. The 21-day and 50-day moving averages also support the token. 

The current indications are that SOL is undergoing a correction. There is no confirmed bearish reversal. Investors should watch price action at $43 for a potential bullish reversal. In the less likely scenario that $43 fails to hold, SOL could find the next support at $35.

Summary

Solana token has maintained the $43 support despite the latest weakness. The bull case for the token remains in place. The current retracement is a correction likely to open buy opportunities.

The post Has Solana started a bear reversal, or is it just a correction? appeared first on CoinJournal.