Zilliqa looks poised for a 30% upswing in the coming days

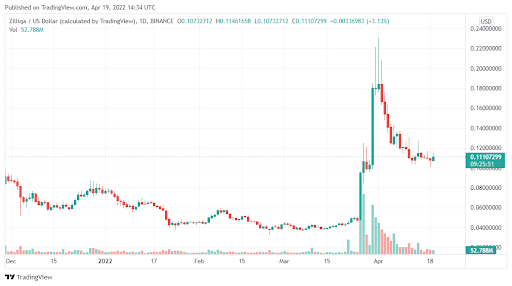
Zilliqa (ZIL) was a huge performer in the last three weeks. The coin saw record-breaking gains even as other coins slowed. But a correction that followed that mesmerizing surge put some breaks on ZIL’s rise. However, the coin still has a lot of potentials:

  • Increased buying pressure could push ZIL up in the days ahead.

  • The coin is now within a crucial demand zone of between $0.097 and $0.121.

  • ZIL has a potential upswing of around 30%
Data Source: Tradingview 

How Zilliqa can regain its momentum

ZIL has been slowing quite rapidly over the last week or so. In fact, after peaking during the last week of March, the token has lost nearly 56% of its value. But after a period of consolidation, the coin has now started to rise again. 

ZIL currently sits in between a very crucial demand zone that ranges from $0.097 to $0.121. In the past, this zone has provided a lot of buying pressure and so far, we are starting to see some uptick in bullish activity. ZIL has surged by at least 7% over the last 24 hours. We expect bulls to continue buying within this zone. 

As a result, ZIL will explode, bringing gains of at least 30% in the process. However, it is unlikely that ZIL will reclaim its all-time high of $0.237. While this is possible this year, in the near term, we expect the coin to face major resistance zones before it even gets close to $0.2.

What are ZIL’s long-term prospects?

After an exponential rally last month that saw gains of around 540%, it is clear that ZIL has run out of steam. In the near and medium-term, we expect the coin to struggle for demand. But in the long term, ZIL still has immense potential, and 2022 could still prove a very successful year for the token.

The post Zilliqa looks poised for a 30% upswing in the coming days appeared first on Coin Journal.

Near Protocol price prediction as Ref Finance TVL surges

The Near Protocol price is in an upward trend as the ecosystem growth continued. The token is trading at $17.12, which was about 130% above the lowest level in February. Its market cap has surged to more than $11.35, making it the 17th biggest cryptocurrency in the world.

Near ecosystem growth

Near Protocol is one of the biggest blockchains that seeks to become a leading player in the industry. The network is currently transitioning to become a fully sharded platform. Sharding is a complex process that breaks blocks into smaller pieces known as shards. As a result, the process helps to increase the overall throughput. 

April has been a successful project for the Near Protocol. For one, the developers raised over $350 million from investors. These funds will be used to grow the ecosystem by providing grants to developers and to hire more developers. The new fundraising happened a few months after the developers raised another $150 million.

The Near Protocol price has also risen because of the ongoing ecosystem growth. According to DeFi Llama, the network’s total value locked (TVL) has risen to over $1.4 billion. The TVL of Near itself has risen to $476 million while that of Aurora has jumped to more than $960 million.

On Tuesday, NEAR rose sharply after the TVL in Ref Finance jumped to over $200 million. It has risen by 14% in the past 24 hours and 52% in the past seven days. This makes it the biggest application built in Near Protocol. Other applications in the network have also seen a strong jump of TVL. For example, Burrow rose to over $143 million while Meta Pool rose to more than $143 million.

Near Protocol price prediction

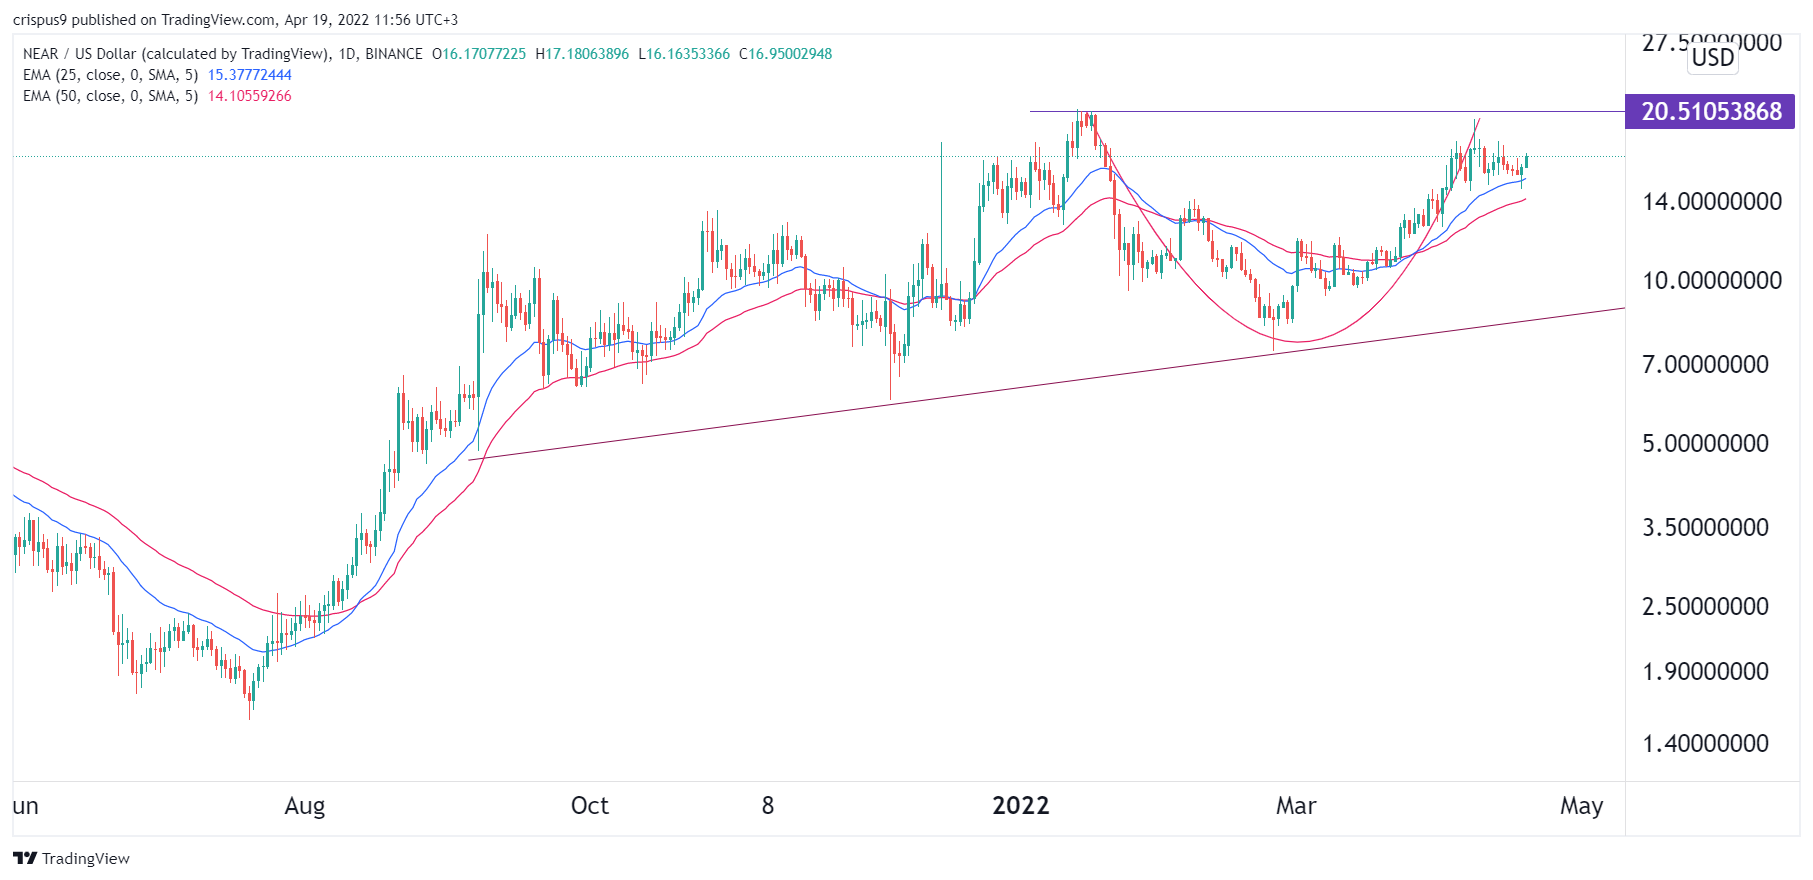
The daily chart shows that the NEAR price has been in a strong bullish trend in the past few months. Along the way, the coin has formed what looks like a cup and handle pattern. This pattern usually sends a signal that the bullish trend will continue. 

It has also moved above the 25-day and 50-day moving averages. The coin has also risen above the ascending trendline shown in brown. Therefore, the Near Protocol price will keep rising as bulls target the all-time high of $20.50.

The post Near Protocol price prediction as Ref Finance TVL surges appeared first on Coin Journal.
LUNA rallies as UST surpasses BUSD in market cap

Terra’s UST stablecoin has surpassed Binance USD (BUSD) to become the third-largest stablecoin by market cap.

The cryptocurrency market has performed well over the past 24 hours. After a poor start to the week, the broader market has seen its value increase by more than 4% in the past few hours.

The excellent performance sees the broader cryptocurrency market cap rally towards the $1.9 trillion mark again. Bitcoin is trading above $40k after declining towards the $37k support level yesterday.

Ether is also trading above $3,000 again after briefly dropping to $2,800 earlier this week. However, LUNA, the native token of the Terra ecosystem, is the best performer amongst the top 10 cryptocurrencies by market cap.

LUNA is up by more than 16% in the last 24 hours, outperforming the other major cryptocurrencies in the process. 

The ongoing rally is fueled by UST’s latest milestone. UST is the stablecoin backed by the Terra ecosystem. According to the latest data, UST has now become the third-largest stablecoin by market cap.

UST’s market cap now stands at $17.5 billion, surpassing BUSD ($17.3 billion) a few hours ago. UST has grown by more than 1,000% over the past year, making it the fastest-growing stablecoin in the crypto market.

Key levels to watch

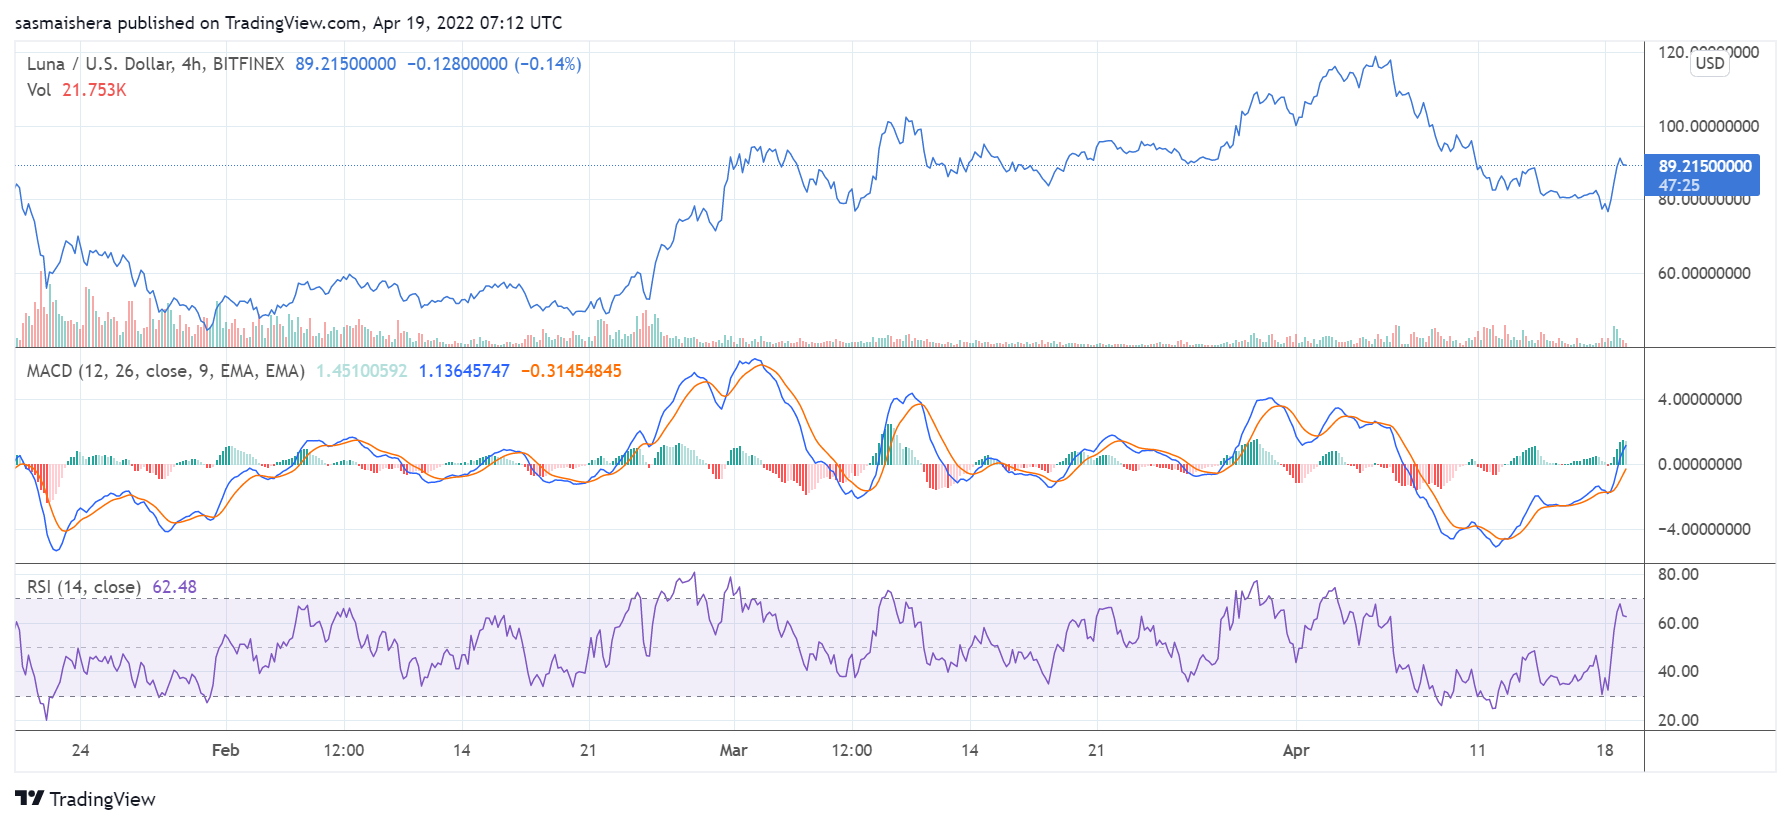
The LUNA/USD 4-hour chart is the most bullish amongst the top 10 cryptocurrencies by market cap. At press time, LUNA is trading at $89 per coin.

The MACD line crossed the neutral zone a few hours ago, indicating strong bullish momentum. The 14-day RSI of 61 shows that LUNA could be heading to the overbought territory if the rally continues.

If the bulls remain in charge, LUNA could surpass the first major resistance level at $95 before the end of the day. However, it would need the support of the broader market to move past the $100 mark for the second time this month. 

The post LUNA rallies as UST surpasses BUSD in market cap appeared first on Coin Journal.

Why is Decred up by more than 15% today?

The broader crypto market is underperforming at the moment, but Decred is rallying.

The broader cryptocurrency market has been struggling over the past few days, and the bearish trend could continue for the rest of the day. The market has lost more than 4% of its value in the last 24 hours.

Currently, the total cryptocurrency market cap has dropped to the $1.8 trillion level. If the bearish trend continues, the total crypto market cap could drop to the $1.7 trillion level before the end of the week.

Bitcoin and Ether, the two leading cryptocurrencies by market cap, have lost more than 3% of their values in the last 24 hours. Bitcoin has dropped below the $40k psychological level while Ether is trading below $3k for the first time in weeks.

However, DCR, the native token of the Decred ecosystem, is up by more than 18% in the last 24 hours. Thus, making it the best performer amongst the top 100 cryptocurrencies by market cap.

There is no clear catalyst behind DCR’s ongoing rally, with the broader market currently underperforming.

Key levels to watch

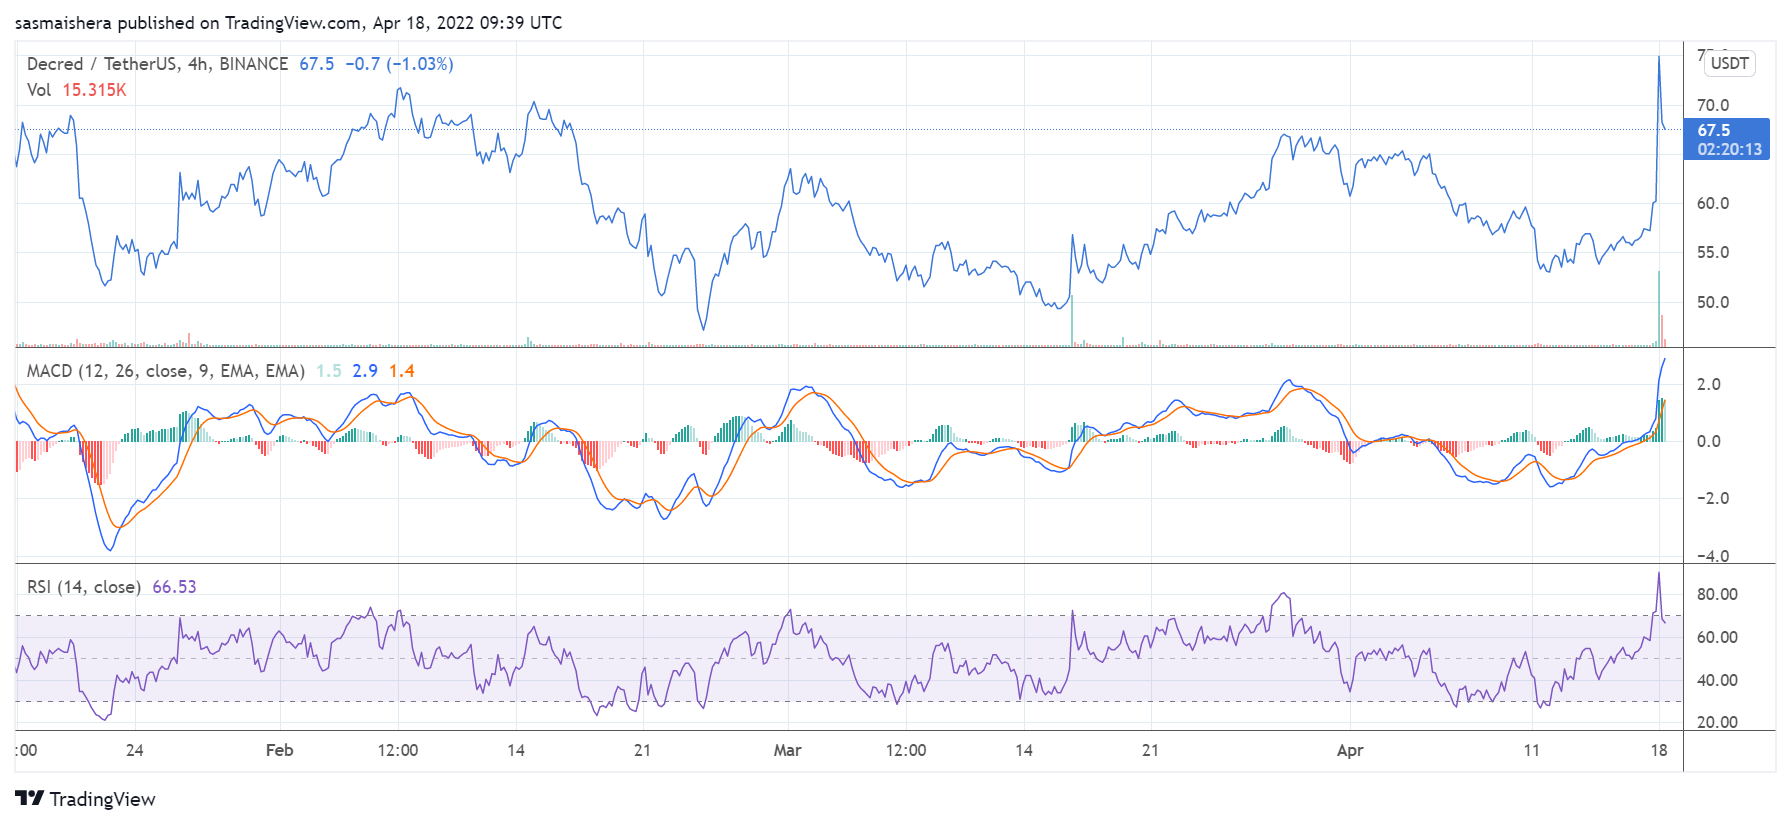
The DCR/USDT 4-hour chart is bullish as the coin has outperformed the market in the last 24 hours. However, the technical indicators show that it could be due for a trend reversal if the broader market continues with its current bearish performance. 

The MACD line is above the neutral zone, indicating bullish momentum. The 14-day RSI of 66 shows that DCR could enter the overbought region if it gains the support of the broader market. 

At press time, DCR is trading at $67.2 per coin. If the current momentum continues, DCR could rally past the $70 mark before the end of the day. However, it would need the support of the broader market to reach $75 over the coming hours and days.

DCR could drop below the first major support level of $63.4 if the broader market continues to be bearish. However, it should defend the second major support level at $59 over the next few hours.

The post Why is Decred up by more than 15% today? appeared first on Coin Journal.
Where does Bitcoin go next after dropping below $40k again?

Bitcoin has dropped below the $40k level again as the broader market continues to struggle.

The cryptocurrency market has been struggling over the past few days, and the bearish trend could continue in the coming days. The broader market has lost more than 4% of its value in the last 24 hours.

At the moment, the total cryptocurrency market cap has dropped to the $1.8 trillion level. If the bearish trend continues, the total crypto market cap could drop to the $1.7 trillion level before the end of the week.

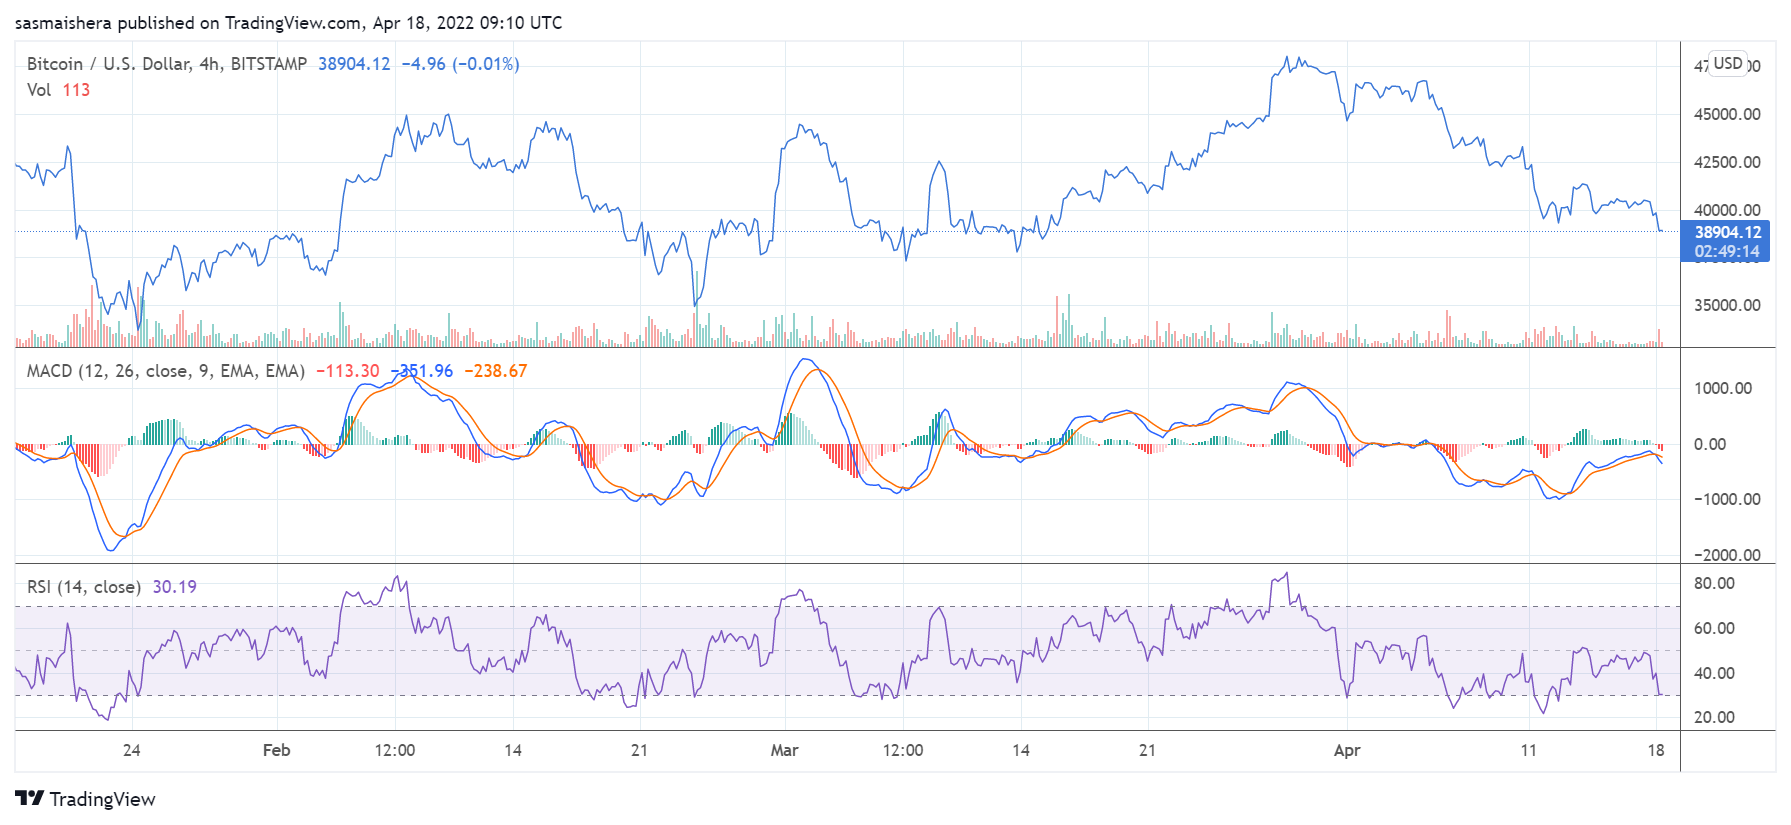
Bitcoin, the world’s leading cryptocurrency by market cap, has lost more than 3% of its value so far today. At press time, BTC is trading around $38,900 per coin. Bitcoin has lost more than 8% of its value in the past seven days.

The latest bearish trend puts Bitcoin even further below its all-time high price of $69,044, which was achieved in November 2021. 

After dropping below the $40k psychological level, the bulls would need to defend the $35k support region to allow Bitcoin to regain its value of around $45k in the short term.

Key levels to watch

The BTC/USD 4-hour chart is bearish at the moment as the bears control the market. The technical indicators show that BTC is underperforming and could soon slip lower.

The MACD line is below the neutral zone, indicating a bearish momentum currently in play. The 14-day RSI of 30 shows that Bitcoin is currently in the oversold region and could face further selling pressure in the short term. 

If the bearish trend continues, Bitcoin could drop below the first major support level at $37,527 over the next few hours. In the event of an extended bearish run, BTC could be forced to defend the major support level at $35,000.

The post Where does Bitcoin go next after dropping below $40k again? appeared first on Coin Journal.