Why is Helium up by more than 7% on Wednesday?

Helium has emerged as the best-performing cryptocurrency amongst the top 100 coins by market cap on Wednesday.

HNT, the native coin of the Helium blockchain, is the best performer amongst the top 100 cryptocurrencies by market cap today. Helium’s performance comes despite the broader crypto market underperforming in the last 24 hours.

The broader cryptocurrency market is trading in the red zone after starting the week positively. The total cryptocurrency market cap is now around $941 billion, down by more than 5% so far today.

Bitcoin has once again dropped below $19k and is currently trading at $18,790, down by more than 5% in the last 24 hours.

Ether, the second-largest cryptocurrency by market cap, is also down by more than 8% in the last 24 hours and is currently trading at $1,520 per coin.

Although HNT is the best performer amongst the top 100 cryptocurrencies by market cap today, there is no apparent catalyst behind this move. Despite HNT’s ongoing positive performance, the coin has lost more than 27% of its value in the last seven days.

Key levels to watch

The HNT/USD 4-hour chart remains bearish despite Helium outperforming the market in the last 24 hours. HNT’s technical indicators show that the coin is recovering from its recent slump.
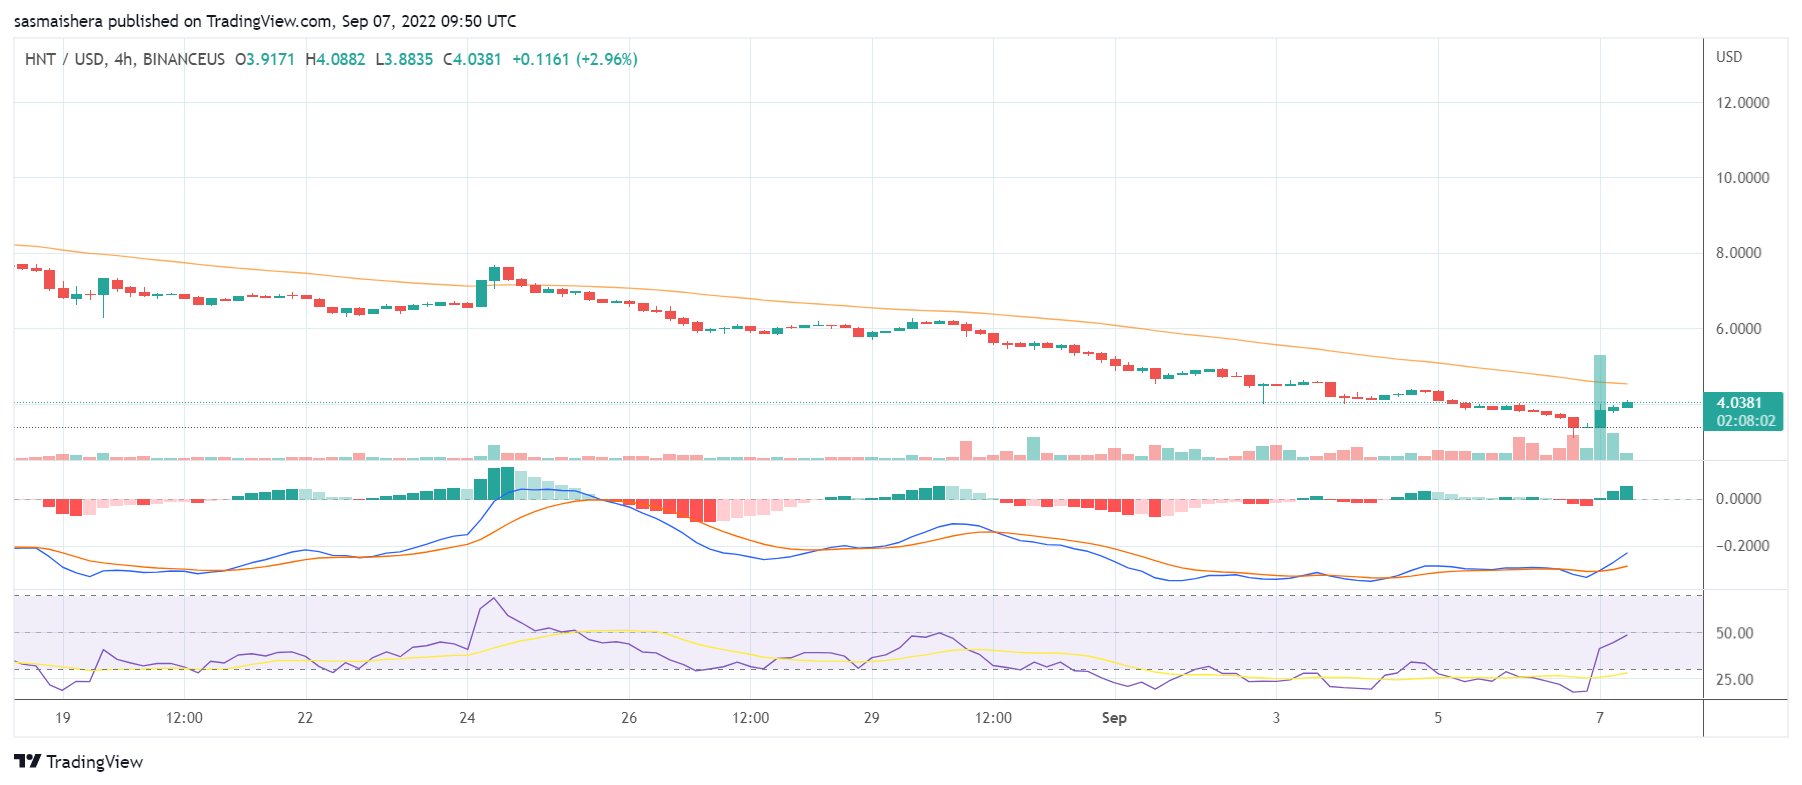
The MACD line dropped into the negative zone on August 25th and continues to remain there. Despite HNT’s positive performance, the MACD line is still within the negative region, indicating that the bears have not relinquished control.

The 14-day relative strength index of 49 shows that HNT is no longer in the oversold region. HNT would need to rally higher to enter the overbought territory over the next few days and weeks.

At press time, HNT is trading at $4.028 per coin. If the recovery continues, HNT could surge past the $4.470 resistance level before the end of the day. 

However, HNT would need the support of the broader market to move past the second major resistance point at $5.017.

The bears are still around and could drag HNT below the $3.7771 support level over the next few hours.  

The post Why is Helium up by more than 7% on Wednesday? appeared first on CoinJournal.
Why is Ethereum Classic up by more than 27% on Tuesday?

Ethereum Classic is the best performer amongst the top 100 cryptocurrencies by market cap in the last 24 hours.  

ETC, the native coin of the Ethereum Classic blockchain, is up by more than 27% in the last 24 hours. Thus, making it the best performer amongst the top 100 cryptocurrencies by market cap.

ETC’s rally comes as the broader crypto market has been performing well over the last 24 hours. The total market cap currently stands around $1 trillion, up by more than 2% today.

Bitcoin, the world’s leading cryptocurrency, continues to struggle to move past the $20k psychological level despite the broader crypto market performing well so far today. BTC is up more than 1% in the last 24 hours.

Ethereum Classic’s rally comes as the Ethereum community gets ready for the Merge event. The Merge event will see the Ethereum blockchain migrate from a proof-of-work (PoW) mechanism to a proof-of-stake (PoS).

As a result of the Merge, the Ethereum blockchain will no longer support miners. Miners on the network would be forced to move to other blockchains, and Ethereum Classic is one of the options available to them.

Key levels to watch 

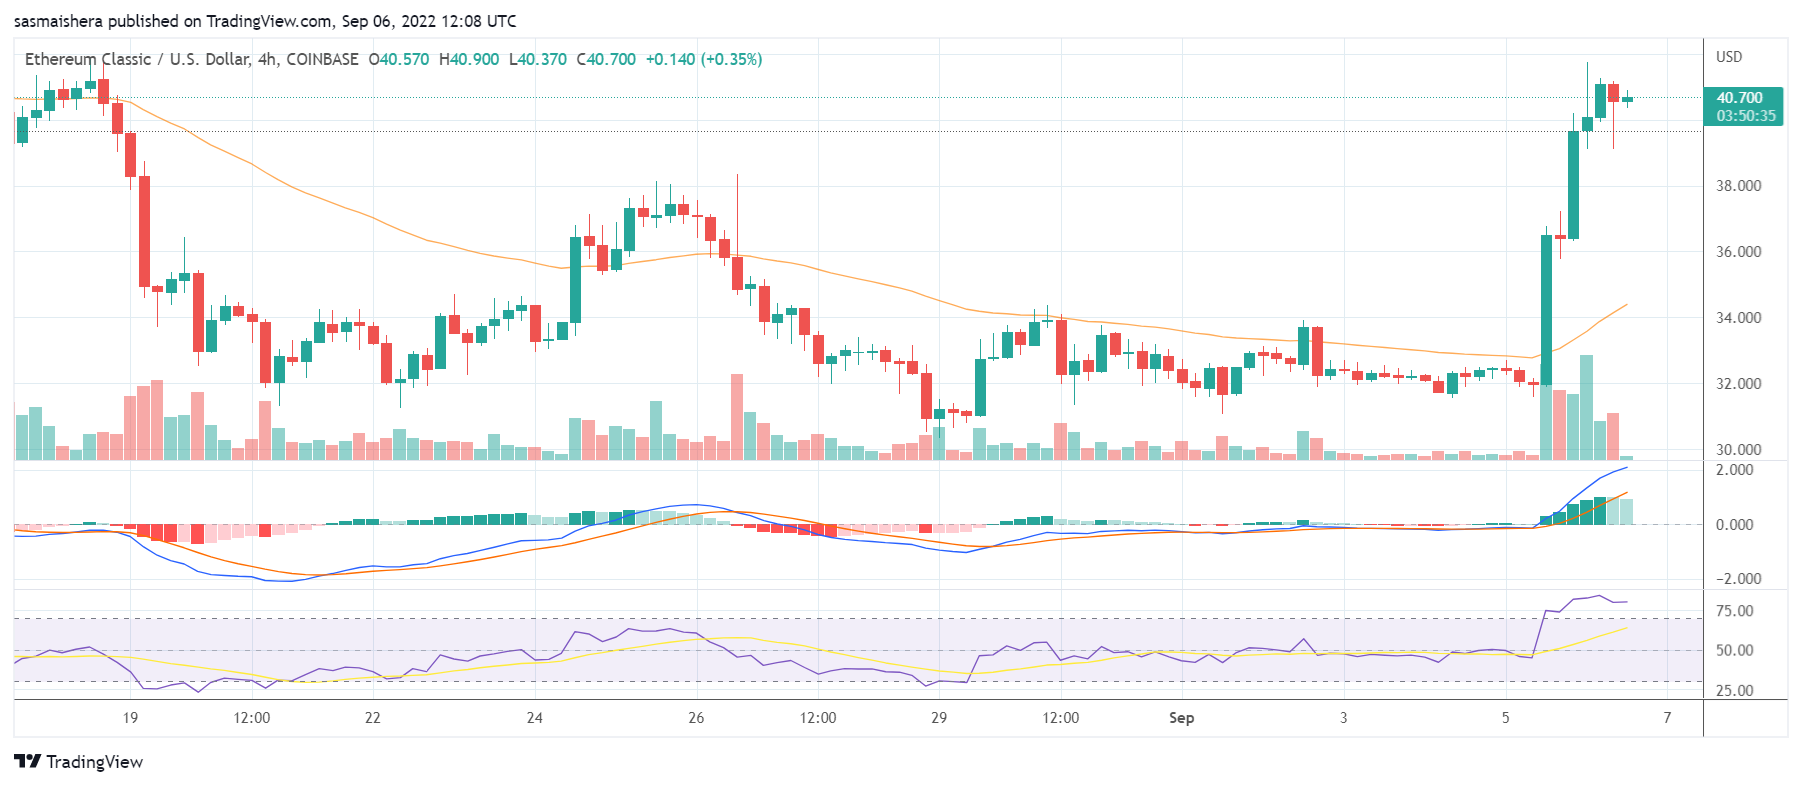
The ETC/USD 4-hour chart is extremely bullish as Ethereum Classic has outperformed the other major cryptocurrencies in the market. 

The MACD line is deep into the positive zone, indicating a strong bullish momentum for ETC at the moment.

The 14-day relative strength index currently stands at 84, indicating that ETC is entering the overbought region very soon.

At press time, ETC is trading at $40.60. If the rally continues, ETC could surge past last month’s high of $45.65 before the end of the day.

In the event of an extended bullish performance, ETC could attempt to reach the $54 resistant mark for the first time since March 2022. 

The post Why is Ethereum Classic up by more than 27% on Tuesday? appeared first on CoinJournal.

Flux price rallies as locked $FLUX supply soars to $108m

Flux price continued its bullish trend this week as demand for the small-cap cryptocurrency continued. The token rose to a high of $1.41 on Tuesday, which was the highest level since May 5th of this year. It has jumped by more than 237% from its lowest level this year, pushing its total market cap to over $340 million.

Why is FLUX soaring?

Flux, formerly known as Zel, is a blockchain infrastructure platform that helps developers build and host their applications. Its ecosystem includes FluxOS, which is a second-layer operating system that allows hardened dockerized apps to run on a decentralized computational network. Some of the applications running on Flux are Haven Protocol, Docushield, Keep Network, and Element among others.

As part of its ecosystem, Flux has FluxNodes, Parallel Mining, and Zelcore among others. Therefore, while most people don’t interact with Flux directly, most developers use it to build their applications.

There are several reasons why Flux price has been in a strong bullish trend lately. First, more investors have been buying the coin. For example, data shown in its dashboard shows that the total locked in its ecosystem has risen to over 108.5 million $FLUX. This is a strong performance since it was less than $100 million a few months ago.

Another possible reason for the rally is the upcoming launch of Flux Geolocation 2.0 feature that will let users specify by region where they want their dApp running. This is a major upgrade that is expected to go live in the coming months.

Finally, technically, the coin has bullish momentum now that its performance has been in an uptrend. Historically, soaring cryptocurrencies and stocks tend to attract more buyers as people embrace the fear of missing out mentality.

Flux price prediction

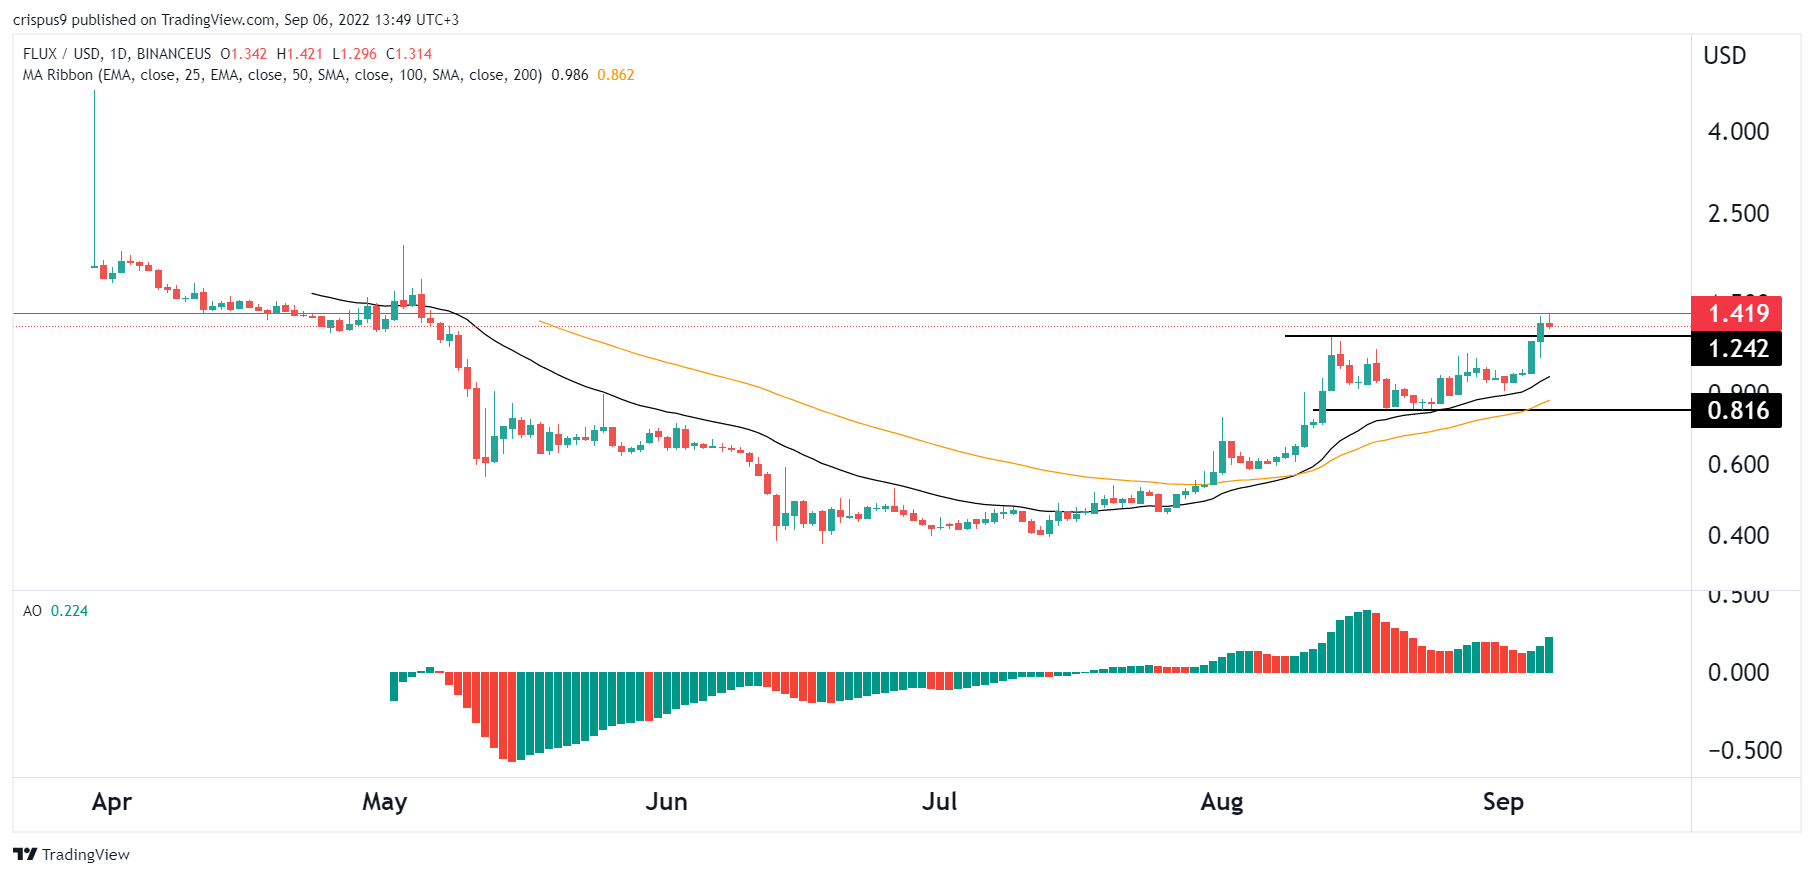
The daily chart shows that Flux price has been in a strong bullish trend in the past few weeks. Along the way, the coin managed to move above the 25-day and 50-day moving averages. It also managed to move above the important resistance level at $1.24, which was the highest point on August 13. 

The awesome oscillator has moved above the neutral point. Therefore, there is a likelihood that the token will keep rising as buyers target the next key resistance level at $1.50. This view is in line with what I wrote in another report on Flux. A drop below the support at $1 will invalidate the bullish view.

The post Flux price rallies as locked $FLUX supply soars to $108m appeared first on CoinJournal.

VGX price prediction: 2 reasons why Voyager token is soaring

VGX price has done in the past few months as Voyager Digital’s bankruptcy proceedings continue. The token rose to a high of $0.9388, which was the highest level since July 13. It has jumped by more than 538% from the lowest level this year, giving it a market cap of over $262 million.

Why is Voyager Digital coin rising?

Voyager Digital was one of the biggest companies in the cryptocurrency industry. The Canadian company offered cryptocurrency trading and investing solutions to millions of people during its peak. At the time, it used to handle transactions worth billions of dollars every week.VGX is the native governance token for the platform. 

Voyager filed for voluntary bankruptcy proceedings in its bid to restructure debts worth billions of dollars. As it does this, the firm has announced that it will stop receiving deposits and process withdrawals from its customers. 

Still, despite this crisis, the VGX price has continued rising and even outperforming many cryptocurrencies like Bitcoin and Ethereum. 

There are two possible reasons for this. First, there is growing hope that Voyager Digital asset’s will soon be acquired. According to media reports, companies like FTX and Binance are currently negotiating to acquire the firm. If this happens, the potential acquirer will likely have the resources to make it vibrant again. 

Second, the VGX price has risen because of a scenario that has become popular recently. We have seen share prices of troubled companies soar. For example, Revlon shares have jumped by more than 57% in the past three months despite the fact that the company has filed for bankruptcy protection. 

Similarly, shares of companies like Hertz soared after initiating bankruptcy proceedings. In cryptocurrencies, Celsius’s CEL token jumped after the platform went out of business. 

VGX price prediction

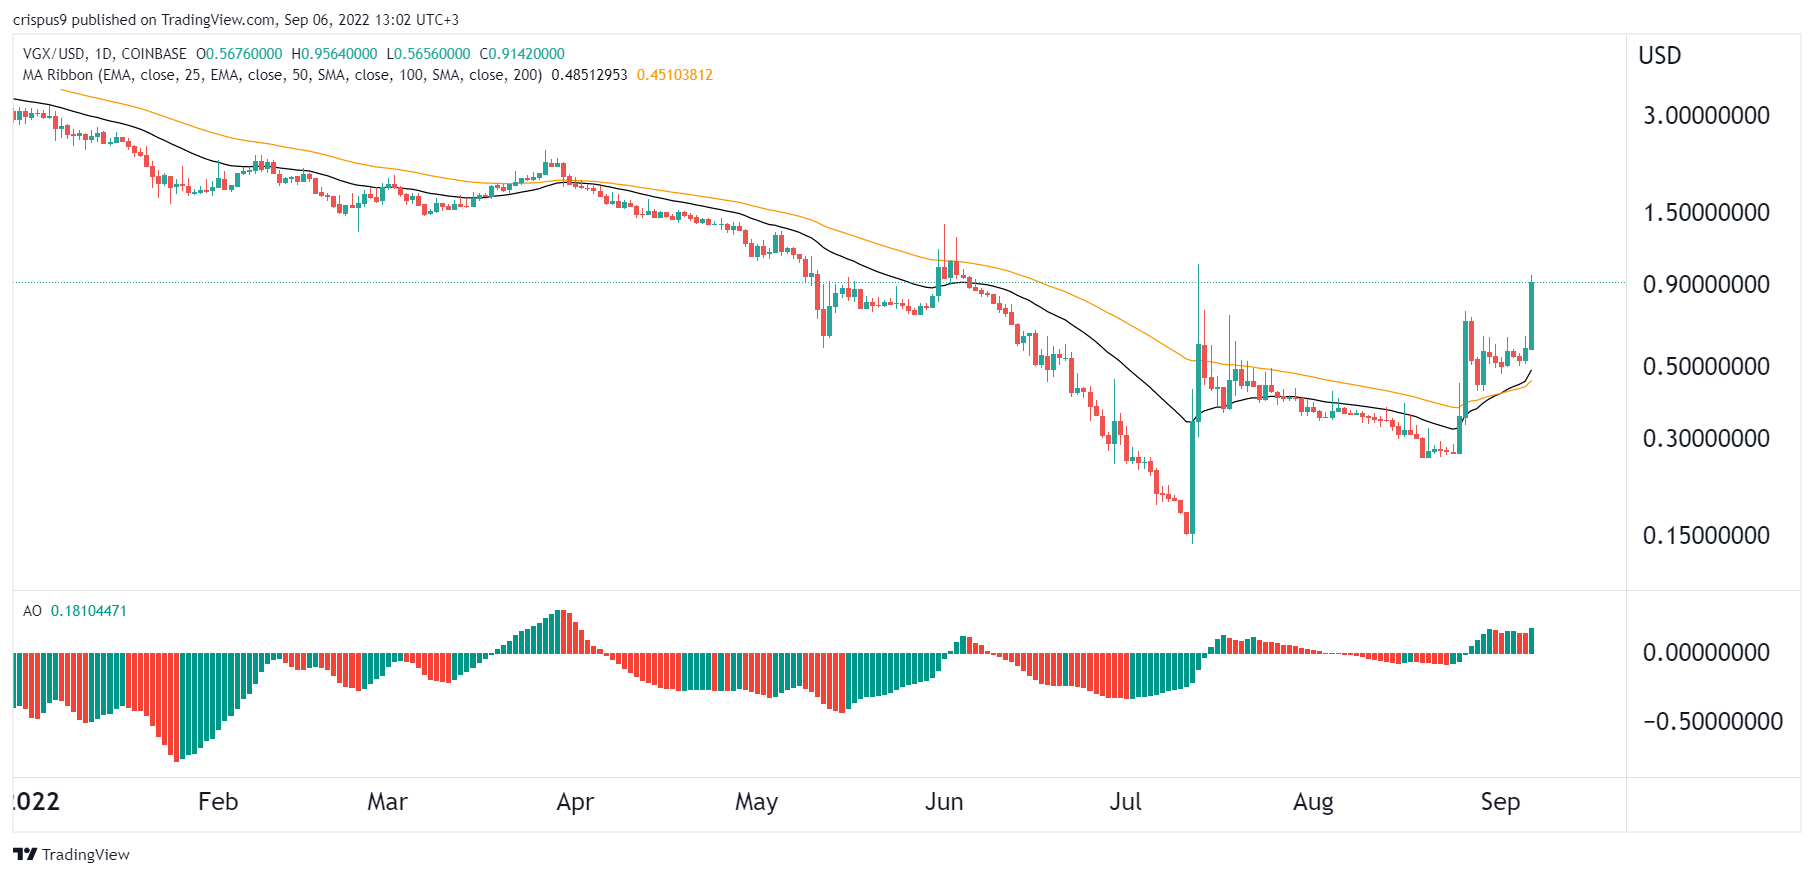
The daily chart shows that the Voyager Digital token has been in a strong bullish trend in the past few weeks. During this time, it has jumped above the 25-day and 50-day moving averages. It has also moved above the important resistance level at $0.7391, which was the highest point on August 26.

The Awesome Oscillator has jumped above the neutral point. Therefore, the coin will likely continue rising as bulls target the next key resistance level at $1.4, which was the highest point on July 13. A drop below the support at $0.70 will invalidate the bullish view.

The post VGX price prediction: 2 reasons why Voyager token is soaring appeared first on CoinJournal.

Can Chainlink clear the $7.4 resistance level?

  • Chainlink is a decentralized oracle network for smart contracts

  • Its native LINK token has surged 13% in the past week

  • The token is showing strong bullishness, but momentum remains low

Chainlink LINK/USD is ranked the 23rd largest crypto asset with a market capitalization of $3.5 billion. It is considered the most secure and flexible infrastructure in the crypto blockchain space.

According to its website, the platform is a decentralized oracle network. It offers tamper-proof inputs, outputs, and computations to enhance advanced smart contracts on any blockchain. Chainlink also provides passive income opportunities through staking rewards.

Despite the prolonged crypto market correction, LINK is reaping significant gains. In the past 24 hours, its native token, LINK, has surged 4.51%, bringing weekly gains to 13.35%. Similarly, the tokens have pumped 76% in daily trading volumes to $369 million.

The reason behind the positive gains is not specific. However, a recovery around the DeFi segment could have partly contributed. The top DeFi projects, MakerDAO and Lido, have gained 1% and 6% in their total value locked in a week. As a blockchain that enhances the capabilities of smart contracts, Chainlink is strategically positioned.  

Its technical outlook shows a bullish trend in the LINK token, but the RSI momentum indicator says otherwise. 

LINK shows bullishness amid a weak momentum 

Source: TradingView

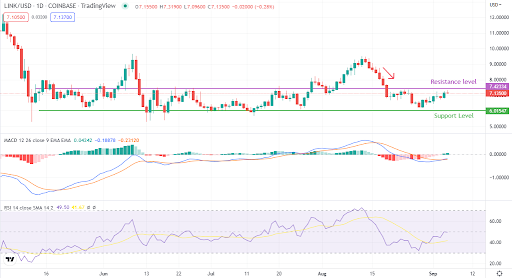
Currently, LINK is exchanging for $7.15. The token is approaching $7.4 resistance, which is the immediate resistance level, as per the daily chart above. The trend is showing a steady recovery since testing $6 support on August 29.

Furthermore, the trend-following indicator MACD is looking green. It has crossed the signal line from below to above. However, the RSI is at the neutral 50. Chainlink will need to attract more buyers to gain enough momentum to clear the $7.4 resistance level.

Concluding thoughts

The current level does not present a perfect buy entry. Investors should wait until LINK clears the next resistance level. They should also watch for the momentum indicators to turn positive for an opportunity to enter.

The post Can Chainlink clear the $7.4 resistance level? appeared first on CoinJournal.