Hive price prediction after going parabolic amid low volume

The Hive price went parabolic on Monday even as other cryptocurrencies recoiled. The coin jumped to a high of $0.5517, which was the highest level since June 22nd. It has risen by more than 85% from the lowest level in June, bringing its total market cap to over $197 million. 

What is Hive and why is it rising? 

Hive is a leading blockchain project that aims to become a leading platform for developers to build decentralized applications in all industries. It emerged from a hard fork of Steem. 

It is a forward-looking platform built on the Delegated Proof of Stake (DPoS) protocol. According to its white paper, Hive leverages the proof-of-brain technology by distributing a portion of inflation to content creators and consumers. 

Hive has two main assets in its ecosystem: Hive and Hive Backed Dollars (HBD). HIVE is the liquid currency of the Hive ecosystem. It has a decreasing inflation rate as its inflation drops by 0.01% with every 250,00 blocks until it reaches 0.95%.

Hive has been used to build some of the leading applications in the industry. Some of the top apps in the industry are Splinterlands, PeakD, Ecency, Leo Finance, and Dtube among others. It is unclear whether the total value locked (TVL) in the Hive ecosystem. 

It is unclear why the HIVE price is rising as other cryptocurrency prices are falling. Therefore, this rebound could be part of a pump and dump scheme. Recently, we have seen many small coins have similar pumps and dumps. 

Hive price prediction 

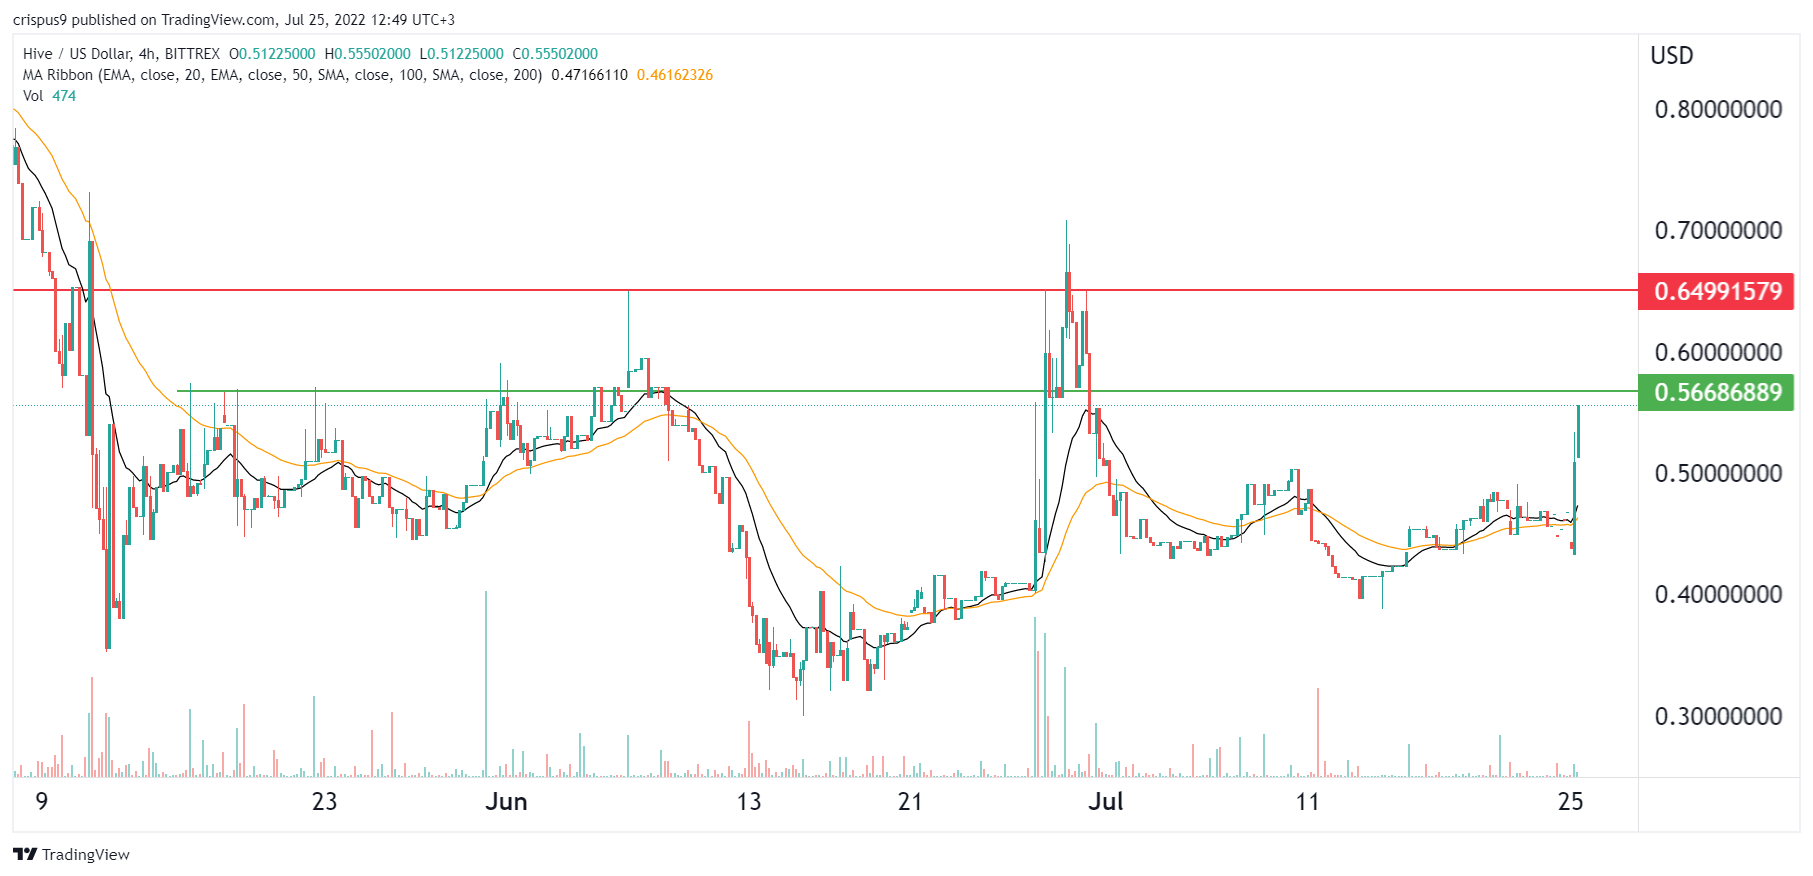
The four-hour chart shows that the Hive price has had a significantly low volume in the past few days. The coin went parabolic on Monday even as other coins declined.

Hive moved above the 25-day and 50-day moving averages and the important resistance level at $0.5025, which was the highest point on July 10th.

It is approaching the important resistance level at $0.566, which was the highest point in May this year. 

Therefore, since there is no major news and the volume remains low, there is a likelihood that the coin will resume the downward trend in the near term. If this happens, the next key support level to watch will be at $0.45.

The post Hive price prediction after going parabolic amid low volume appeared first on CoinJournal.

Shiba Inu flashes a bear signal as correction gets underway – What next?

  • Shiba Inu SHIB is correcting after the latest gains

  • Shiba Inu blockchain partnered with The Third Floor for its metaverse project.

  • The cryptocurrency is entering the consolidation zone

The last one week has been good for crypto buyers as most tokens returned by double digits. However, it is now time for corrections as investors take profits. Shiba Inu SHIB/USD is one of the tokens in a correction wave, and short-term investors should be cautious.

Very few developments have been occurring on Shiba Inu lately. On July 20, the network announced a partnership with The Third Floor. The partnership with the American visualization company will power the blockchain to its metaverse project. Shiba Inu’s metaverse is already a closely monitored event. However, Shiba Inu investors could be waiting for more than just a partnership. The launch of the metaverse will be a game changer, but for now, SHIB investors are merely speculating. 

SHIB/USD has lost by 4.58% in the last 24 hours as of the time of writing. The drop means a lot for SHIB as the cryptocurrency is entering a bearish market.

Shiba Inu forms a bearish pin bar at resistance

Source – TradingView

Technically, SHIB is bearish. MACD indicators are bullish, but that does not align with the technical levels. The token seemed to have overcome resistance at $0.000012 after breaking past it. It is now emerging that it was a false breakout. A bearish reversal has resulted in the formation of a bear pin bar. We expect the price to continue sliding until the cryptocurrency finds support at $0.00001. 

Summary

Shiba Inu token is bearish as correction occurs at key resistance. SHIB may continue to fall and find support at $0.00001. Investors should consider selling now for a chance to buy lower at the support.

The post Shiba Inu flashes a bear signal as correction gets underway – What next? appeared first on CoinJournal.

Bitgert price prediction as the BRISE recovery stalls

The Bitgert price rebound has cooled as other cryptocurrency prices recoil. BRISE is trading at $0.00000045, which is about 12% below the highest point this week. Other popular cryptocurrencies like Bitcoin, Ethereum, and Safemoon have also retreated.

What is Bitgert?

Bitgert is a relatively small blockchain that seeks to become a leading blockchain platform for developers to build decentralised applications (dApps). Like Ethereum, developers can use it to build apps in all industries like decentralised finance (DeFi), metaverse, NFT, and gaming. 

Bitgert aims to do all that while achieving a substantial scale and without substantial fees. According to its website, Bitgert’s transactions cost less than $0.0001. This means that it can handle millions of transactions for less than $10.

Bitgert has also created a crypto wallet that acts as a gateway to decentralised blockchain applications. The app is easy to use, has substantial security features, and has diverse features. Bigert recently introduced USDC and USDT.  BRISE is the native token for Bitgert.

Still, in all these, Bitgert faces numerous challenges. For example, its ecosystem is significantly smaller than that of other larger platforms like Solana, BNB, and Ethereum. At the same time, there are many upcoming projects like Kadena and Optimism that have all features that Bitgert has.

Most importantly, Burgert may not have the millions of dollars to incentivise developers to build apps. For example, Avalanche has over $500 million in funds to incentivise developers. 

All this explains why Bitgert has a significantly small ecosystem than the other projects. DappRadar does not record any application created using the technology. The same is true with DeFi Llama, a platform that tracks all DeFi projects. 

Bitgert price prediction 

The four-hour chart shows that the BRISE price has bounced back in the past few days. It has risen by about 70% from its lowest level this year. The coin is being supported by the ascending trendline that is shown in black. It has also moved slightly above the 25-day and 50-day moving averages. 

Therefore, there is a likelihood that the bullish trend will continue as long as the coin is above this trendline. If this happens, the next key level to watch will be at this month’s high of $0.00000050.

The post Bitgert price prediction as the BRISE recovery stalls appeared first on CoinJournal.

Harmony ONE price prediction after the drop of TVL to $43M

The Harmony ONE price has pulled back in the past few days as demand for the coin remains at a substantially low level. The coin has crashed to $0.023, which was the lowest level since July 19th of this year. It has dropped by more than 16% from its highest level on Thursday, bringing its total market cap to over $284 million.

What happened to Harmony?

Harmony is a blockchain project that was recently one of the biggest challengers to Ethereum’s dominance. The network was created using a technology known as sharding that was first introduced by Zilliqa. 

Sharding creates scale and throughput in blockchains by breaking down the blocks into smaller pieces known as shards. Harmony’s sharding solves the two main challenges that Zilliqa has. It introduces the concept of dividing the storage of blockchain data. Further, it solves the challenge of Proof of Work (PoW) by using a proof-of-stake approach. 

As such, Harmony is fully scalable, has secure sharding, is highly efficient, and has consistent cross-shard transactions. All these qualities made it well received by developers. Some of the top applications that have been created in Harmony are DeFi Kingdoms, Tranquil Finance, Synapse, FoxSwap, and SushiSwap. 

Recently, however, the Harmony ONE price has struggled as the number of people using its applications has dropped dramatically. Indeed, the total value locked (TVL) locked in the ecosystem has crashed from over $1.5 billion to just $43 million. 

While most blockchains, including Ethereum, have seen a sharp decline of TVL, Harmony’s has been more dramatic. Analysts believe that the situation is mostly because of the recent $100 million hack that was attributed to North Koreans. The hack happened after the attackers managed to breach a bridge that connected Harmony to Ethereum. 

Therefore, while many blockchains have recovered part of their TVL recently, Harmony’s has continued to drop in the past few months.

Harmony ONE price prediction 

The four-hour chart shows that the ONE price has been attempting to recover in the past few weeks. It has risen by about 42% from its lowest level this year. The coin remains above the ascending trendline that is shown in black. 

Harmony has moved slightly below the 25-day and 50-day moving averages while the Relative Strength Index (RSI) is pointing downwards. 

Therefore, the coin will likely continue falling considering that the recovery has found a strong resistance at about $0.027.

The post Harmony ONE price prediction after the drop of TVL to $43M appeared first on CoinJournal.

Is it time to buy Hedera Hashgraph after the latest gains?

  • Hedera Hashgraph token has gained 14% in the last week

  • Hedera network’s differentiation is a source of strength

  • HBAR, the native token, has hit a resistance

Hedera Hashgraph HBAR/USD has returned 14% in the past week. To an investor, the gains elicit the obvious question of whether the cryptocurrency will sustain gains. This analysis finds it’s not unless a key breakout and crypto sentiment is sustained. 

Hedera Hashgraph boasts of being a crypto network that lets anyone deploy applications. Hedera differentiates itself by restricting nodes used in determining the transaction history. That way, it reduces the potential alterations to the transactions. Hashgraph believes the feature guarantees businesses when using data to make decisions. Corporates such as IBM have been attracted to Hedera’s model.

While the use case for Hedera is never in doubt, it faces competition from other blockchains. Investors interested in the native token HBAR need to watch key level (s) before entering.

HBAR meets resistance amid a bullish week

Source – TradingView

HBAR is bullish after the week’s gains. The MACD line is above the moving average, confirming bullish momentum. However, a technical trader will be keen to know that HBAR has just met resistance at $0.07. The token is consolidating and likely to drop below as bullish momentum fades. That’s speculative as any potential surge could see HBAR trade above the resistance.

We insist HBAR must break above the resistance level to claim higher prices. If that successfully occurs, HBAR could reclaim $0.1. The next level is $0.15, depending on the prevailing crypto sentiment. For now, HBAR remains susceptible to $0.05.

Summary

Despite the weekly gains, HBAR is trapped by the $0.07 resistance. The token could slide further. A break above the resistance could help HBAR reach $0.1.

The post Is it time to buy Hedera Hashgraph after the latest gains? appeared first on CoinJournal.