Watch $0.05 support as Hedera Hashgraph fails to clear resistance

  • Hedera Hashgraph is a PoS distributed ledger using hashgraph consensus algorithm
  • Native HBAR trades in a tight range below the $0.08 resistance
  • Watch $0.05 support for a potential bullish retracement

Hedera Hashgraph HBAR/USD is a proof-of-stake distributed ledger of transactions. The network uses a distinct algorithm called hashgraph. It was developed to enhance faster transactions. While the crypto market has recovered above $1.05 trillion in market cap, HBAR is struggling.

HBAR has declined by 1.2% in the past day at $0.07. The daily transaction volume has also dipped by as much as 17% in the same period. HBAR loss is even wider in the broader outlook. The tokens have plunged 75% YTD and 86% from the all-time high. Hedera Hashgraph’s market cap is also dwindling.

The token is currently ranked #39 in the crypto list with $1.5 billion in valuation. In the past 24 hours alone, the valuation has dropped by $30 million. The technical price outlook further affirms the bearish sentiment HBAR is facing.  

HBAR locked between $0.05 support and $0.08 resistance

Source: TradingView

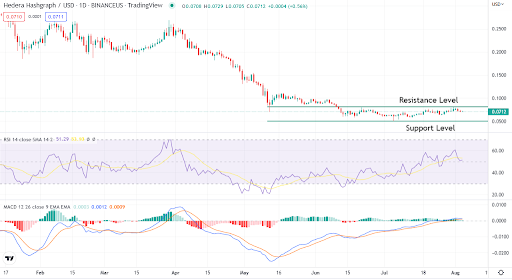
HBAR has been contained between $0.08 resistance and $0.05 support level since June 10. An attempt to break above the resistance was rejected on August 1. HBAR is now on a retracement with weak momentum. The RSI indicator is at 51, while the MACD is close to the baseline with no clear trend.

Concluding thoughts

The technical analysis points to a bearish momentum in Hedera Hashgraph. Its fundamental aspects lie in the promise for faster transactions and broader crypto adoption. For enthusiasts of blockchain technology, the current price level can be a huge discount. 

However, for short-term traders, patience is recommended, with the key level to watch being the $0.05 support. At this point, a buy is only recommended with the confirmation of a bullish price action signal. Momentum indicators should also be monitored.

The post Watch $0.05 support as Hedera Hashgraph fails to clear resistance appeared first on CoinJournal.

Avalanche remains above the breakout zone, but where are the buyers?

  • Avalanche broke past a key resistance but has since stalled
  • AVAX lacks a directional bias amid the 50-day MA joining a support
  • The token could slide to the resistance-turned-support at $20

Avalanche AVAX/USD trades at $23.3 as of press time. The price is well above the key breakout zone of $20, which has now become support. However, for over two weeks, Avalanche has maintained above $20. Is it a clear lack of buyers, or is the cryptocurrency gathering momentum to go higher?

A brief overview of Avalanche shows that previous movements have been driven by momentum. That is particularly as the token became attractive at the $15 bottom since the Luna-inspired crash. Most of the surge in AVAX has also been due to improving crypto sentiment. At the current level, AVAX needs further triggers to go higher.

AVAX at $41? A week ago, crypto analyst Michaël van de Poppe said that Avalanche could rise to $41. The analyst, who has about 619,600 Twitter followers, says AVAX’s close 50-day MA close is a bull trigger. While we can’t agree or disagree with the prediction, we need to look at the daily chart for an assessment.

AVAX holds above $20 despite a sluggish bullish push

Source – TradingView

On the daily chart, AVAX holds strongly above the $20 support. The 50-day moving average joined the support in mid-July for the first time since April. The cryptocurrency has retested the MA while keeping the support intact.

On the contrary, the MACD indicator shows a falling bullish momentum. Nonetheless, we still see a lack of a directional bias for AVAX rather than a bearish move. $20 is the level to watch or at the intersection with the 50-day MA.

Concluding thoughts

AVAX lacks a directional bias. The 50-day MA joined the support recently. As long as AVAX continues to hold the $20 level, it has a chance to hit higher levels. The next targets are $27 and $37.

The post Avalanche remains above the breakout zone, but where are the buyers? appeared first on CoinJournal.

Band Protocol price outlook as DeFi industry rebounds

Band Protocol price has tilted upwards as the decentralized finance (DeFi) industry rebounds. Its token, BAND, rose to a high of $1.7180, which was about 45% above the lowest level in 2022. Its total market cap has risen to over $71 million, making it the 345th biggest coin in the world.

Why is Band Protocol rising?

Band Protocol is a blockchain project that operates in the smart oracle industry. It is mostly used by developers who are building decentralized finance protocols.

Like Chainlink, it is used to provide data in the off-chain market to the on-chain. For example, a builder creating an app to trade stocks can use Band to get this data in an easy way.

Band Protocol is used widely. For example, it is used to provide off-chain cryptocurrency data to platforms like Loopring, Kyber Network, and Cream Finance. Other platforms that use Band Protocol are Homora, Injective, and dForce among others.

Band Protocol is the fifth oracle provider in the industry. Chainlink is the biggest player in the sector followed by Maker, WinkLink, and Pyth. Other notable players in the oracle industry are TWAP, Internal, DIA, and Flux.

Like other providers in the industry, BAND price has struggled in the past few months because of the weak performance of the DeFi industry. Indeed, the total value locked (TVL) in the sector crashed from over $250 billion to less than $70 billion. This crash happened after the meltdown of the Terra ecosystem.

Now, Band Protocol price is rising as investors react to the rebound of the sector. For example, the TVL has risen to over $90 billion. Its total value secured (TVS) has risen to over $539 million.

Many investors believe that the sector recently went through a stress test as volume disappeared. Most of these platforms have survived this test while centralized companies struggled.

Band Protocol price prediction

The four-hour chart shows that the BAND price has been in a strong slow bullish trend in the past few days. As a result, the coin has risen from the YTD low of $1.1870 to the current $1.7170. The coin has moved slightly above the 25-day and 50-day moving averages while the MACD has moved above the neutral point.

Therefore, there is a likelihood that the coin will continue rising as investors target the next key resistance at $2. A drop below the support at $1.5630 will invalidate the bullish view.

The post Band Protocol price outlook as DeFi industry rebounds appeared first on CoinJournal.

Enjin Coin and Immutable X prices at risk as NFT industry implodes

Enjin Coin and Immutable X prices are at major risk as the non-fungible tokens (NFT) industry implodes. The ENJ price has crashed by more than 87% from its all-time high, bringing its total market cap to about $610 million. On the other hand, IMX has seen its price crash by over 85% from its record high.

Are NFTs dying?

Enjin and Immutable are leading blockchain projects that hope to solve some of the most important challenges that NFT creators and buyers have. Unlike Ethereum, Cardano, and Bitgert, their whole ecosystem is about NFTs. 

Enjin runs a platform known as Efinity that enables people to mint and sell NFTs. On the other hand, Immutable X is a layer 2 platform that increases the speed and lowers costs of Ethereum NFT platforms. 

Therefore, the two blockchains are at a major risk as the NFT industry crumbles. Recently, OpenSea, the biggest NFT marketplace, announced that it will lay off a substantial number of its employees as volume drops. In a statement, the firm’s CEO blamed the situation to the ongoing cryptocurrency winter.

Now, new data published by Balthazar shows that the monthly sales volume of NFTs in major marketplaces like OpenSea, Magic Eden, LooksRare, and Solanart has dropped sharply in the past few months. The volume of NFTs sales in July was just $676.73 million, down from January’s high of $6 billion. Still, sales to July were higher than those made in 2021.

According to the report, OpenSea is expected to end the year with sales worth over $26.56 billion, up from 2021’ high of $13 billion. 

Still, analysts believe that the volume of NFTs will continue to languish as interest rates and inflation continue rising. At the same time, liquidity will continue being a challenge as demand wanes. Besides, most people who bought NFTs in 2021 and earlier this year have experienced substantial losses. 

Enjin Coin price prediction 

The daily chart shows that the ENJ price has been moving sideways in the past few days. It is trading at $0.64, where it has been recently. As a result, it is oscillating at the 25-day and 50-day moving averages. 

It has also formed a narrow channel that is shown in green. Therefore, there is a likelihood that the coin will have a major bearish breakout as sellers target the next key support level at $0.35.

The post Enjin Coin and Immutable X prices at risk as NFT industry implodes appeared first on CoinJournal.

Here is why NEAR is up more than 8% in the last 24 hours

The cryptocurrency market has been performing modestly over the past 24 hours, with most coins trading within the green zone.

The cryptocurrency market is recovering from the slumps it experienced earlier this week. The broader market has added less than 1% to its value, with the total market cap still above the $1 trillion mark.

Bitcoin continues to trade around the $23k resistance level despite losing less than 1% of its value in the last 24 hours. Ether is also trading around the $1,600 level and is also down by less than 1% today.

However, NEAR, the native token of the Near blockchain, is the best performer amongst the top 30 cryptocurrencies by market cap. NEAR has added more than 8% to its value in the last 24 hours.

The rally comes as the NEAR CON event continues. The NEAR Conference is currently taking place in Lisbon and showcases some of the best projects in the Near ecosystem.

Key levels to watch

The NEAR/USDT 4-hour chart has turned bullish as NEAR has been performing well over the past few days. The technical indicators show that NEAR could rally higher over the coming hours or days. 

The MACD line crossed into the positive zone a few hours, indicating that NEAR is currently in the bullish zone.

The 14-day relative strength index of 61 shows that NEAR could enter the overbought region if the momentum continues. 

At press time, NEAR is trading at $4.567. If the positive momentum is maintained, NEAR could rally past the first major resistance level at $4.831 before the end of the day.

However, it would need the support of the broader cryptocurrency market to trade above the $5 resistance level for the first time in months. 

The post Here is why NEAR is up more than 8% in the last 24 hours appeared first on CoinJournal.