-
Bitcoin holds onto $19,000 as investors remain cautious of inflation numbers.
-
The price may weaken further if inflation rises faster than expected.
-
Bitcoin remains held by long-term focused investors.
Bitcoin BTC/USD trades at $19,796 as of press time. The level is already a support zone. The world’s largest cryptocurrency has held the level for a month. It signals that investors are circling the cryptocurrency after recent declines. However, inflation data on Wednesday will be a major event closely watched by Wall Street.
An inflation data on Wednesday by the US labor department will show how prices jumped in June. Faster inflation will stoke markets as it will call for a faster Fed move to tighten policy. Bitcoin will be under pressure at $19,000 if the numbers exceed estimates. Similarly, data showing cooling prices could allow Bitcoin to continue holding onto the $19,000 level.
Although Bitcoin is under pressure, long-term focused investors remain convinced of a recovery. Coinbase Analytics data shows that investors hold 77% of the supply of the cryptocurrency. The number is close to the peak of 80% in January and higher than 60% of the bull run in late 2017. David Duong, Coinbase’s head of institutional research, says that short-term traders account for most sells. Whereas the inflation data will have an impact on Bitcoin price, investors should still see an opportunity at $19,000.
Bitcoin keeps $19,000 support intact
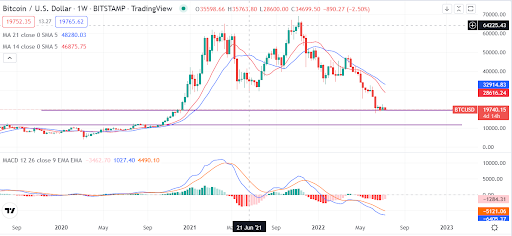
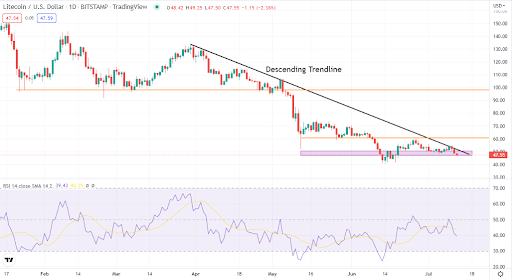
Source – TradingView
Technically, the MACD and moving averages flush bearish signals for Bitcoin. However, the cryptocurrency has kept the support intact. If inflation numbers grow further, Bitcoin could slide. The next support is at around $11,500. Prices could still recover before the next support as Bitcoin is a very volatile cryptocurrency.
Summary
We encourage a long-term hold for Bitcoin as volatilities remain in place. High inflation could lead to a further decline. The price could recover from the support zone if inflation cools.
The post Bitcoin steady as inflation data nears – Major turning point or further crash? appeared first on CoinJournal.

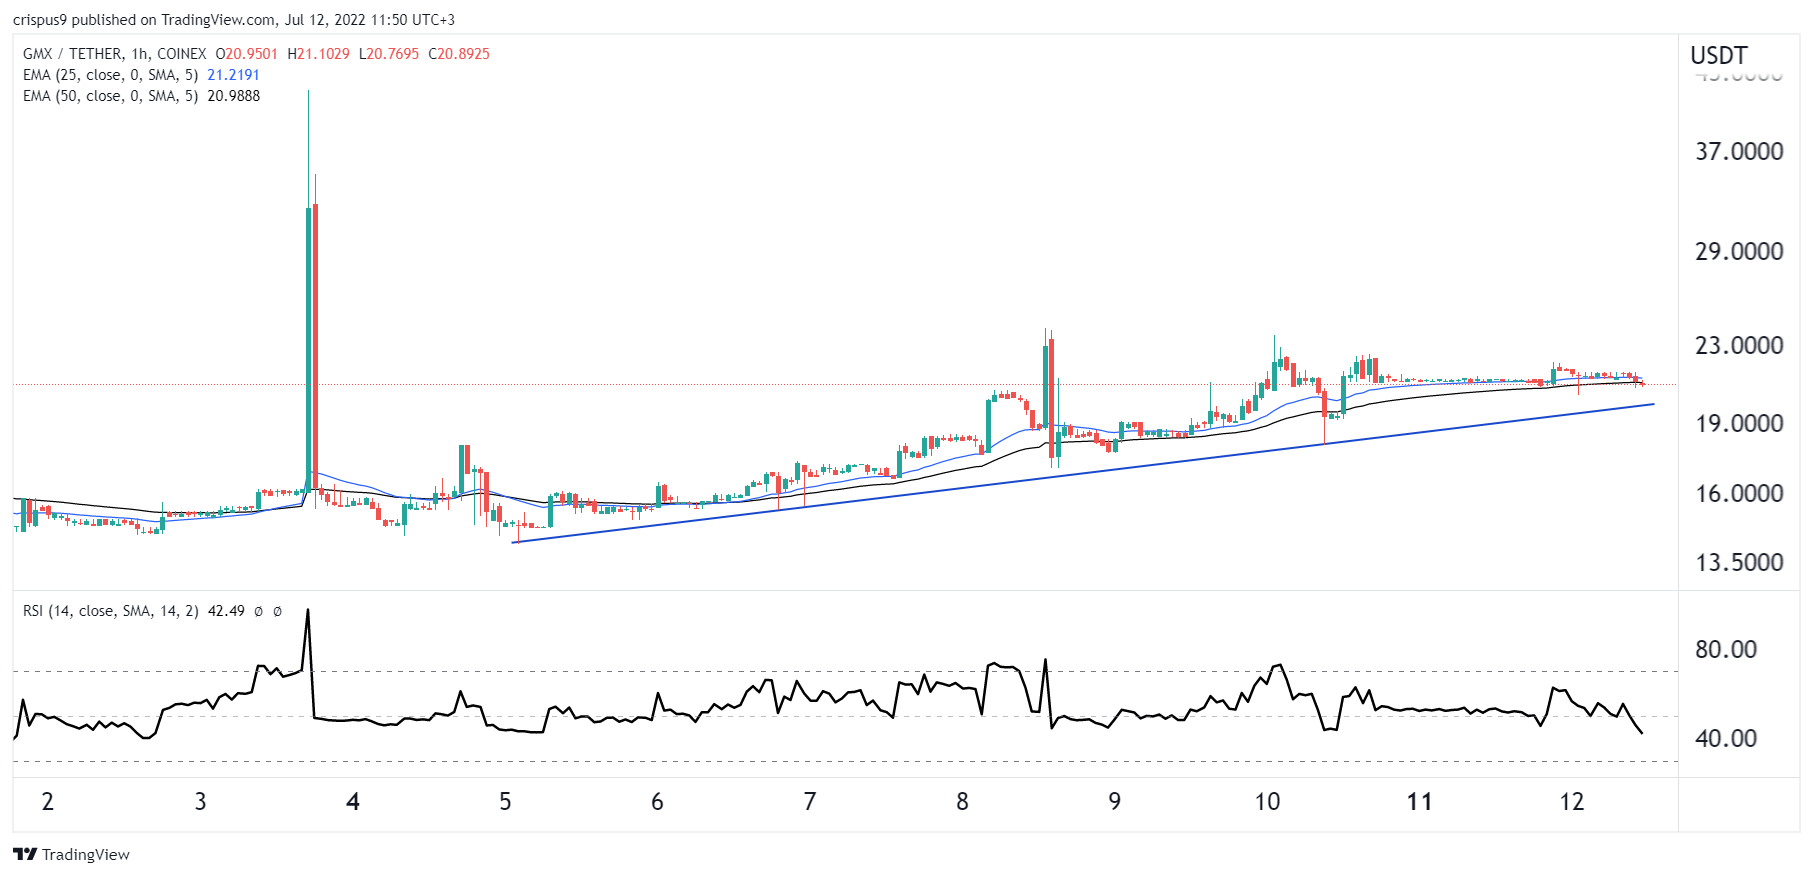
 Source: TradingView
 Source – TradingView
 Source: TradingView