Ethereum vs Ethereum Classic: Which should you trade?

Ethereum and Ethereum Classic are two similar blockchains, yet they carry a stark contrast. Ethereum is ranked the second largest cryptocurrency, with a market cap of $185.4 billion. Ethereum Classic is ranked at position 22 with a market cap of $3.4 billion. So what distinguishes them?

Ethereum Classic is a hard fork of Ethereum

Ethereum classic was founded in 2016 as a hard fork of the Ethereum blockchain. That was after a major hacking incident on Ethereum. Ethereum Classic relies on ETC, its native cryptocurrency, to run transactions. Both Ethereum and Ethereum Classic carry smart contract functionalities. They are decentralized, and privacy protection comes on top for both blockchains. 

Nonetheless, as with most hard forks, the forked blockchains carry some unique attributes. Ethereum Classic is a Proof-of-Work blockchain. Miners have to crack mathematical problems to validate transactions. They subsequently get rewarded with ETC tokens. While Ethereum runs on the PoW consensus mechanism, it is transitioning to Proof-of-Stake. Users will need to stake ETH to become validators, a less energy-intensive process. The shift to PoS or merge is expected from September.

Another major difference is that there is no capped supply for Ethereum. Nonetheless, developers have set a base 4.5% increase every year. A burning mechanism helps to keep the supply in check. Contrary, Ethereum Classic has a fixed supply. The maximum supply in the market is 230 million, and tokens cannot exceed the limit. 

Which should you invest in?

Ethereum ranks ahead of its hard fork with its market valuation. It is already dominant in the NFT and DeFi sectors. For PoS lovers, Ethereum comes top due to the upcoming merge. However, Ethereum Classic comes on top when considering a cheaper ETH alternative. We find both tokens have similar price trends. Investing in either token depends on the interests of the investor.

The post Ethereum vs Ethereum Classic: Which should you trade? appeared first on CoinJournal.

Aave correction to continue at it breaks below $86 support

  • Aave is one of the largest DeFi platforms

  • The token has been gaining as cryptocurrencies rose on hopes of DeFi recoveries.

  • AAVE token has breached a support zone and eyes new lows in a market correction

Aave AAVE/USD is one of the cryptocurrencies to stage recoveries in the recent crypto surge. The cryptocurrency traded at a low of $53 at the beginning of July. It almost doubled in value to a price of $102 on July 19. The token currently trades at $85 as most cryptocurrencies edge lower. 

Aave gained on renewed hopes of the growth of DeFi. The platform is already one of the largest in the decentralized lending and borrowing sector. Aave also lets users earn passive income through staking the token. That has the potential to attract users and facilitate the growth of the DeFi platform. 

The latest above-market returns for AAVE underline trust in the platform and the utility of its token. However, the token now faces a decline, and investors should watch key levels.

AAVE set to correct more as price slides below $86 support

Source – TradingView

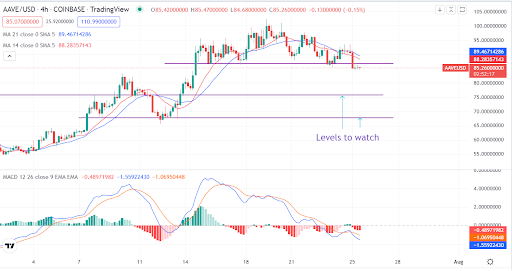
In the shorter 4-hour time frame, AAVE is bearish. The MACD line crossed below the moving average as the token slipped below $86 support. The 14-day and 21-day moving averages remain above the price and offer resistance. 

From the technical outlook, AAVE will continue to slide unless it reclaims the $86 support. There is currently no bull trigger, while crypto sentiment remains weak. We expect the cryptocurrency to fall and find support at $75. If the level fails to hold, the next support zone for AAVE is $68. Short-term focused investors should sell now to buy lower. 

Summary

AAVE remains under bear pressure after the recent gains. The cryptocurrency has broken below $86 support. The token could find support at $75 or potentially at $68. 

The post Aave correction to continue at it breaks below $86 support appeared first on CoinJournal.

Cardano forms a double top – Are we likely to see a price decline?

  • Cardano’s ADA has been surging for the last two weeks

  • The token was rejected twice at the resistance resulting in a double top

  • ADA could slide, but investors should be keen on a potential breakout

Double tops and double bottoms are important price action signals in financial markets. The “tops” are seen as price peaks and are potential signals of an oncoming bear market. The “bottoms” are interpreted similarly and suggest a potential price jump. 

Cardano ADA/USD is one of the cryptocurrencies that has remained bullish since mid-July. The crypto token rose to a high of $0.54 on July 20 from $0.41 on July 14. That happens amid an increase in whale activity on the network and as most cryptocurrencies gained. After trading slightly above or at resistance, bull exhaustion is evident. We believe ADA could fall further, but investors need not to panic.

ADA under pressure as double top forms at resistance

Source – TradingView

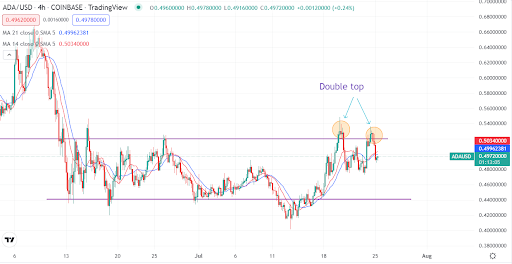
ADA price is under pressure after forming a double top slightly above the $0.52 resistance. The rejection of the price at the same level confirms buyer exhaustion. As a result, ADA will continue to fall in the short term. However, it also communicates that buyer interest remains strong in ADA. That was after buyers tried to clear the $0.52 for the second time. 

ADA has broken below the 14-day and 21-day moving averages. That confirms a slight bearish pressure in the short term. The token has a minor support at $0.48., where the price is likely to settle. A further drop could see ADA settle at $0.44.

Concluding thoughts

Although ADA is under pressure from the double top, buyer interest remains high. We expect only a short-term drop. ADA will see lasting recoveries if it overcomes the consolidation by breaking past the $0.52 resistance.

The post Cardano forms a double top – Are we likely to see a price decline? appeared first on CoinJournal.

Solana token remains on the watchlist despite bear pressure

  • Solana has lost 5% in 24 hours as cryptocurrencies turn red

  • The decline in crypto tokens is due to profit-taking after weeks of gains.

  • Solana token could break out soon, and investors should be keen.

Solana SOL/USD has lost 5% in the last 24 hours as of press time. Maybe you could be wondering; is it time to buy? Or, you are a bit paranoid that the bear market has kicked in, and you are considering staying away. We urge that Solana could be looking for more bullish power before a major breakout occurs. Investors should watch the token for the potential to buy once that happens.

Looking generally at the crypto sector as of July 25, most tokens remain in the red. While the macro concerns remain, the bear market happens after some robust gains. The declines are, therefore, a result of profit taking from mainly short-term traders. SOL is one of the crypto tokens that saw an attempt to break from a key resistance fail. The slide could see buyers come in again, allowing a stronger bullish push.

Solana crashes back to the consolidation zone after a false breakout

Source – TradingView

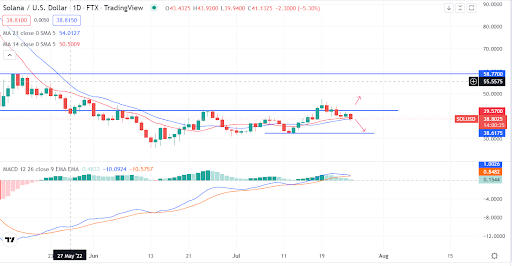
On the daily chart, SOL has entered the consolidation zone established at between $32 and $42. It happens after the token temporarily breaches the resistance level in a false breakout. However, we can’t rule out that the breakout will remain valid if SOL holds above the MA. What we are sure of is that SOL remains bullish as long as it remains supported above $32.

At the moment, the token could continue consolidating until bulls overpower bears. The cryptocurrency is a hold. Investors can also add positions at the current level if the price remains supported by MAs. A drop to $32 would also open buy trades.

Summary

SOL remains robust despite a false breakout above $42. The token could find a bullish momentum to push above the consolidation zone. The next potential level is $58.

The post Solana token remains on the watchlist despite bear pressure appeared first on CoinJournal.

Hive price prediction after going parabolic amid low volume

The Hive price went parabolic on Monday even as other cryptocurrencies recoiled. The coin jumped to a high of $0.5517, which was the highest level since June 22nd. It has risen by more than 85% from the lowest level in June, bringing its total market cap to over $197 million. 

What is Hive and why is it rising? 

Hive is a leading blockchain project that aims to become a leading platform for developers to build decentralized applications in all industries. It emerged from a hard fork of Steem. 

It is a forward-looking platform built on the Delegated Proof of Stake (DPoS) protocol. According to its white paper, Hive leverages the proof-of-brain technology by distributing a portion of inflation to content creators and consumers. 

Hive has two main assets in its ecosystem: Hive and Hive Backed Dollars (HBD). HIVE is the liquid currency of the Hive ecosystem. It has a decreasing inflation rate as its inflation drops by 0.01% with every 250,00 blocks until it reaches 0.95%.

Hive has been used to build some of the leading applications in the industry. Some of the top apps in the industry are Splinterlands, PeakD, Ecency, Leo Finance, and Dtube among others. It is unclear whether the total value locked (TVL) in the Hive ecosystem. 

It is unclear why the HIVE price is rising as other cryptocurrency prices are falling. Therefore, this rebound could be part of a pump and dump scheme. Recently, we have seen many small coins have similar pumps and dumps. 

Hive price prediction 

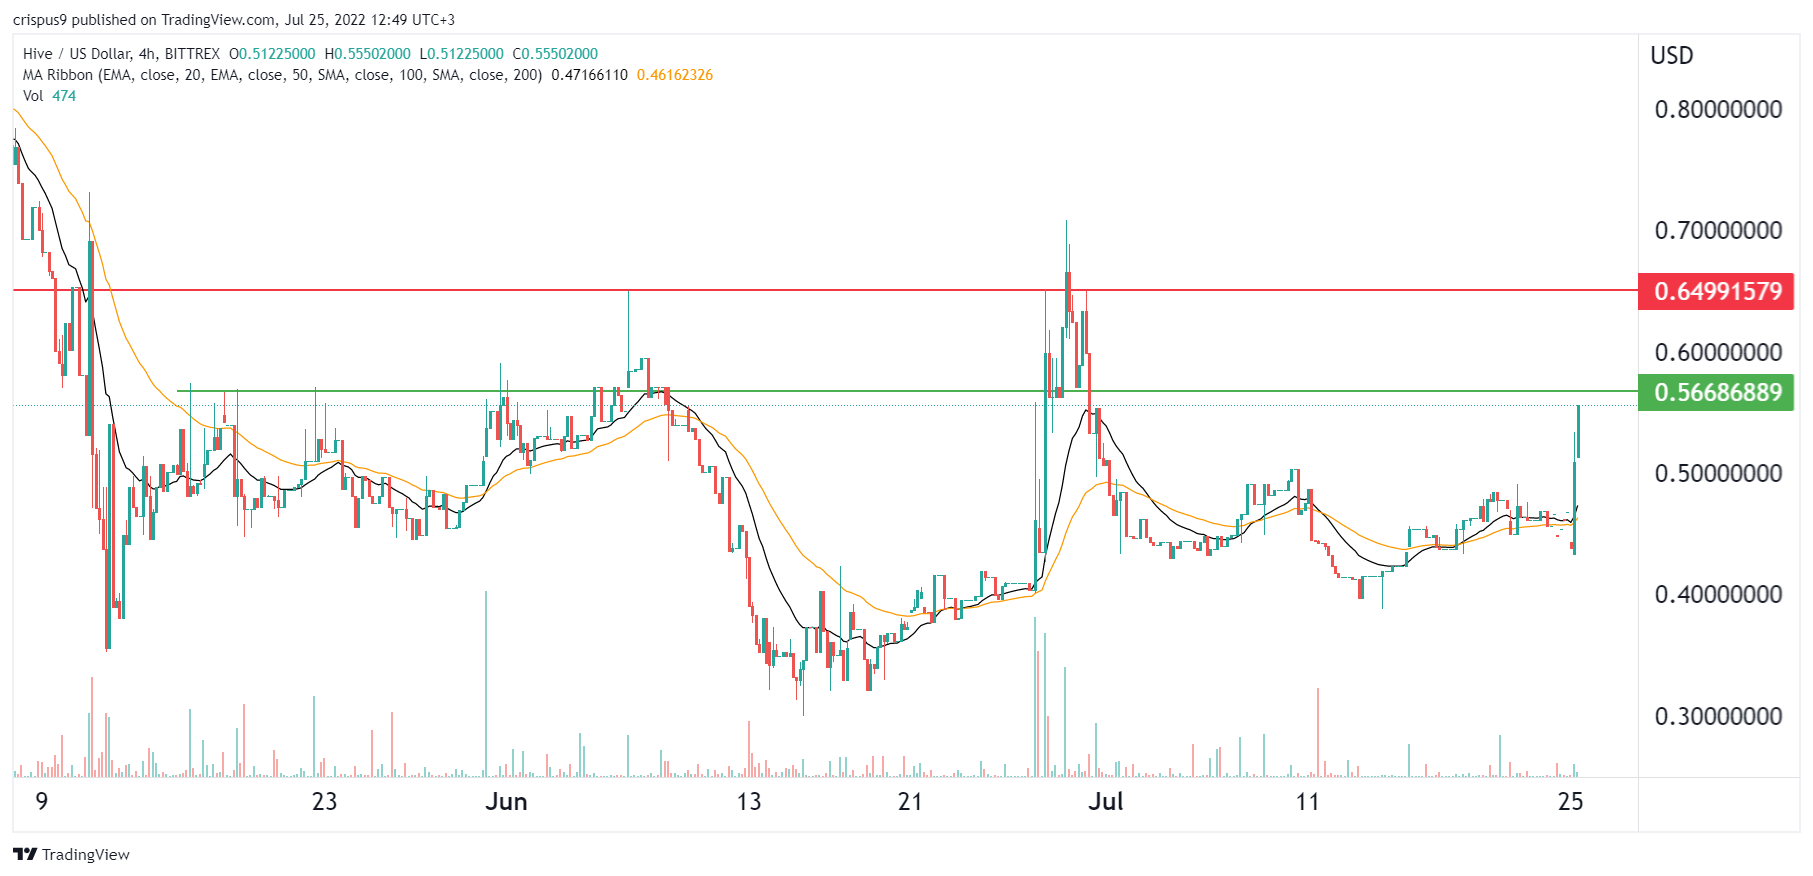
The four-hour chart shows that the Hive price has had a significantly low volume in the past few days. The coin went parabolic on Monday even as other coins declined.

Hive moved above the 25-day and 50-day moving averages and the important resistance level at $0.5025, which was the highest point on July 10th.

It is approaching the important resistance level at $0.566, which was the highest point in May this year. 

Therefore, since there is no major news and the volume remains low, there is a likelihood that the coin will resume the downward trend in the near term. If this happens, the next key support level to watch will be at $0.45.

The post Hive price prediction after going parabolic amid low volume appeared first on CoinJournal.