- Avalanche broke past a key resistance but has since stalled
- AVAX lacks a directional bias amid the 50-day MA joining a support
- The token could slide to the resistance-turned-support at $20
Avalanche AVAX/USD trades at $23.3 as of press time. The price is well above the key breakout zone of $20, which has now become support. However, for over two weeks, Avalanche has maintained above $20. Is it a clear lack of buyers, or is the cryptocurrency gathering momentum to go higher?
A brief overview of Avalanche shows that previous movements have been driven by momentum. That is particularly as the token became attractive at the $15 bottom since the Luna-inspired crash. Most of the surge in AVAX has also been due to improving crypto sentiment. At the current level, AVAX needs further triggers to go higher.
AVAX at $41? A week ago, crypto analyst Michaël van de Poppe said that Avalanche could rise to $41. The analyst, who has about 619,600 Twitter followers, says AVAX’s close 50-day MA close is a bull trigger. While we can’t agree or disagree with the prediction, we need to look at the daily chart for an assessment.
AVAX holds above $20 despite a sluggish bullish push
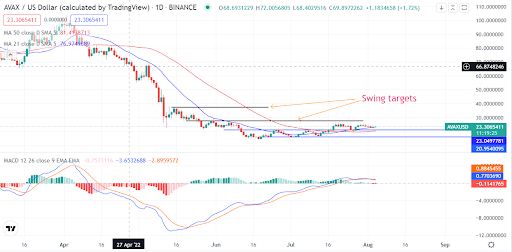
Source – TradingView
On the daily chart, AVAX holds strongly above the $20 support. The 50-day moving average joined the support in mid-July for the first time since April. The cryptocurrency has retested the MA while keeping the support intact.
On the contrary, the MACD indicator shows a falling bullish momentum. Nonetheless, we still see a lack of a directional bias for AVAX rather than a bearish move. $20 is the level to watch or at the intersection with the 50-day MA.
Concluding thoughts
AVAX lacks a directional bias. The 50-day MA joined the support recently. As long as AVAX continues to hold the $20 level, it has a chance to hit higher levels. The next targets are $27 and $37.
The post Avalanche remains above the breakout zone, but where are the buyers? appeared first on CoinJournal.