-
Tezos’s blockchain-enabled voting system Electis is gaining traction
-
The native token XTZ has surged by 8% in the last one week
-
Tezos remains on a clear uptrend making higher prices attenable
Tezos XTZ/USD is not the top gainer in the last week. However, it is among those that have retained gains, with at least an 8% surge in seven days. Expectations of growth of the utility of the blockchain’s native token are triggering the surge.
Tezos has had no significant news lately. However, optimism is growing around the blockchain’s e-voting system Electis. The encrypted and fully anonymous blockchain-enabled e-voting system has been adopted widely. Over 20,000 votes have been using the voting system since it was launched.
Recently, on July 15, Electis announced that three bodies of the United Nations have started using the voting system. The organizations include YOUNGO, DG7 Youth Constituency, and the Women and Gender Constituency. The adoption cements Tezos as a blockchain of the future. While there are numerous use cases to be explored, these positive developments could fuel the gains.
Tezos maintains a clear uptrend above support
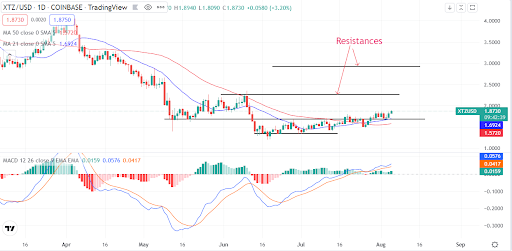
Source – TradingView
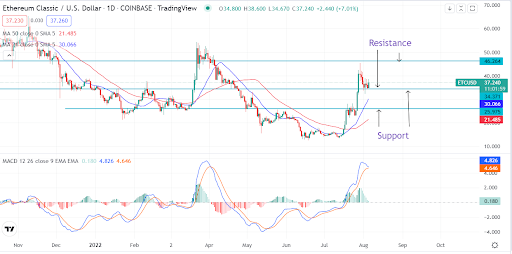
From the technical outlook, Tezos trades above a support zone at $1.6. The token is pushing higher from the 21-day moving average. The token is also supported by the 50-day moving average. The MACD indicator shows a strong bullish momentum building.
We expect the current bullish momentum in Tezos to be sustained. Short corrections to the support are still possible and offer buying opportunities. The token will face resistance at $2.2. If the level is successfully cleared, the next zone to watch is $2.9.
Concluding thoughts
Tezos token remains on an uptrend after reclaiming the $1.6 support. The token will rise to $2.2, where it faces major resistance. Investors should take advantage of any short-term retracements.
The post Tezos prediction as price makes slow but sure gains appeared first on CoinJournal.