Why is Celsius’s CEL token up by 28% in the last 24 hours?

Celsius is the best-performing cryptocurrency amongst the top 100 coins by market cap over the last 24 hours.

The cryptocurrency market has continued its positive start to the week despite some coins and tokens currently underperforming. The market has added less than 1% to its value in the last 24 hours, with the total market cap now above $1.1 trillion.

Bitcoin is up by 0.38% in the last 24 hours but didn’t have enough momentum to surge past the $24k resistance level despite trading in the green zone. 

Ether, the second-largest cryptocurrency by market cap, is up by more than 2% in the last 24 hours and currently trading at $1,772 per coin. 

However, CEL, the native token of the Celsius platform, is up by more than 28% in the last 24 hours, making it the best-performing cryptocurrency amongst the top 100 coins by market cap.

At press time, CEL is trading at $1.9 per coin. This represents a 300% surge in price over the past few weeks as CEL dropped below $1 after Celsius halted withdrawals on its platform a few weeks ago. 

CEL has been rallying as traders on Twitter took the opportunity to push the token price higher, similar to what they did with the GameStop stock last year. 

Key levels to watch

The CEL/USD 4-hour chart is extremely bullish as Celsius has been performing excellently over the past few days.

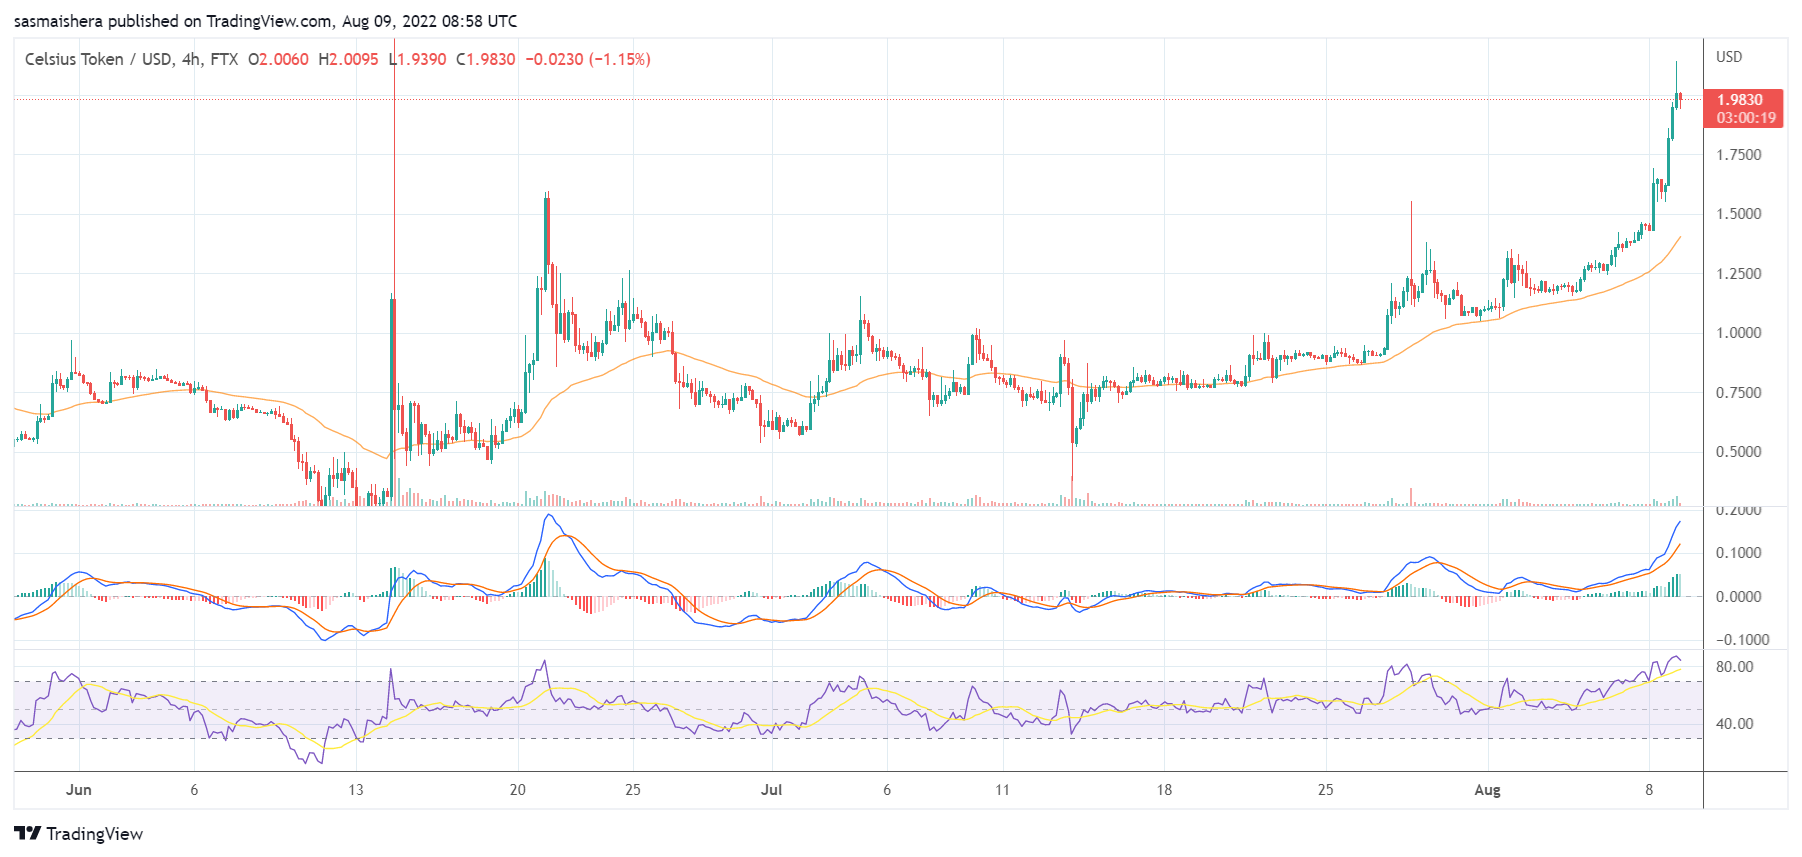
The MACD line is deep into the positive zone, indicating a strong bullish momentum for CEL.

The 14-day relative strength index of 87 shows that CEL is currently in the overbought region.

If the bulls remain in control, CEL could rally past the first major resistance level at $2.125 before the end of the day. In the event of an extended rally, CEL could break past the $2.5 mark for the first time since April 2022.

The post Why is Celsius’s CEL token up by 28% in the last 24 hours? appeared first on CoinJournal.

Avalanche price prediction as AVAX crosses key resistance

Avalanche price rebound continued on Monday as demand for its NFT solutions rose. The AVAX token rose to a high of $30.16, which was the highest level since May 23rd of this year. It has jumped by over 118% from its lowest level this year. Its market cap has jumped to over $8 billion.

NFT growth

Avalanche is an Ethereum rival that solves some of the biggest challenges that smart contract platforms have. It is a proof-of-stake platform that has blazingly fast speeds and low carbon emissions. It is also known for its large Avalanche Rush and Multiverse funding rounds that are providing developers with millions of funds to build their projects.

Avalanche has been used to build some of the most popular blockchain projects in the industry. Some of the apps in its ecosystem are Benqi, Aave, Trader Joe, and GMX among others. Its total value locked (TVL) stands at over $2.45 billion, making it one of the biggest players in the DeFi industry.

However, this TVL is sharply lower than its all-time high of over $12 billion. At the same time, AAVE has a market dominance of about 45%, which is a bit risky.

It is unclear why Avalanche price went parabolic on Monday. A possible reason is that NFT projects in the platform have done relatively well. Data compiled by CryptoSlam shows that total sales in the ecosystem rose by over 37% in the past 24 hours. 

There were 209 transactions worth over 28,730. Still, this volume is significantly lower than the 52,987 transactions that happened in Solana. Another possible reason why AVAX price is rising is that of fear of missing out (FOMO) now that cryptocurrencies seem to be in a bull run.

Avalanche price prediction

The daily chart shows that the AVAX price has made a strong recovery in the past few weeks. Along the way, the coin managed to move above the important resistance levels at $22.14 and $26.43. It also continued rising and moved above the 25-day and 50-day moving averages. The MACD has also risen to the highest point in years.

Therefore, the coin will likely continue rising as bulls target the next key resistance point at $35. A drop below the support at $28 will invalidate the bullish view.

The post Avalanche price prediction as AVAX crosses key resistance appeared first on CoinJournal.

Kadena price prediction: Is this the return of the raging bull?

Kadena price rebound accelerated on Monday as demand for the token continued rising. The KDA token jumped to a high of $2.42, which was the highest point since May 25th this year. It has risen by over 76% above the lowest point this year, bringing its total market cap to over $445 million.

KDA demand continues

Kadena is an upcoming blockchain project that seeks to become the best platform for developers to create decentralized applications. It was launched by a team of developers who helped to launch JP Morgan’s internal cryptocurrency. 

Kadena is different from most other Ethereum rivals. For one, it is a proof-of-work blockchain, means that new coins are produced via mining. Kadena developers have created a situation where mining does not necessarily lead to more carbon emissions.

At the same time, Kadena is one of the fastest layer-1 blockchains in the world. According to its developers, Kadena can handle over 450,000 transactions per second (TPS). This is a notable figure since Visa and Mastercard handle less than 10,000 tps each. Solana handles 2,500 tps while Ethereum can process less than 25 tps.

Still, a major challenge for Kadena is that its ecosystem is still significantly tiny than that of its peers. According to DeFi Llama, the platform has just five DeFi applications that have a combined total value locked (TVL) of over $7.7 million.

The main reason why Kadena price is rising is that Kaddex, a new DEX launched in its platform has grown its TVL to over $4.4 million. This is a strong number considering that it was launched last week. Other Kadena DeFi apps with over $1 million in TVL are Babena and KDSwap.

The ecosystem will likely continue growing following the recent grants by Kadena Eco. Some of the top apps that received funding by Kadena are Electron Labs, Hypercent, and KDLaunch.

Kadena price prediction

The four-hour chart shows that the KDA price has been in a strong bullish trend in the past few weeks. As it climbed, it managed to move above the important resistance at $1.8785, which was the highest point on July 19th. 

The coin has moved above the 25-day and 50-day moving averages while the MACD has moved above the neutral point. Therefore, the coin will likely keep rising as bulls target the next key resistance point at $2.75, which is about 16% above the current level.

The post Kadena price prediction: Is this the return of the raging bull? appeared first on CoinJournal.

Why is ROSE up by more than 20% in the last 24 hours?

The cryptocurrency market is having a positive start to the week, with most coins and tokens now in the green zone.

The cryptocurrency market has picked up from where it left off last week. The market has added nearly 3% to its value in the last 24 hours, with the total market cap now closing in on the $1.2 trillion mark.

Bitcoin cemented its position above the $23k level over the weekend and is now looking to bridge the $24k resistance level once again after adding more than 3% to its value today.

Ether is also eyeing the $1,800 resistance level and is up by 3% in the last 24 hours. However, ROSE, the native token of the Oasis Protocol, is the best performer amongst the top 100 cryptocurrencies by market cap today.

ROSE has added 24% to its value in the last 24 hours and could rally higher over the coming hours and days.

ROSE has been performing excellently since the Oasis Protocol announced its partnership with Facebook’s parent company Meta last week. The cryptocurrency could surge higher as the broader market continues to perform well.

Key levels to watch

The ROSE/USD 4-hour chart is bullish as Oasis Protocol has been performing well over the weekend. The technical indicators show that ROSE is the best performer amongst the top 100 cryptocurrencies by market cap today.

The MACD line is deep within the positive territory, indicating bullish momentum for ROSE. The 14-day RSI of 68 shows that ROSE could enter the overbought region if it can maintain its current momentum.

At press time, ROSE is trading at $0.1032 per coin. If the bulls remain in control, ROSE could surge past the $0.112 resistance level for the first time since May 2022. 

However, the resistance level above $0.135 should cap further upward movement in the short term. 

The post Why is ROSE up by more than 20% in the last 24 hours? appeared first on CoinJournal.

Wait for a retracement as Near Protocol breaks above key resistance

  • Near Protocol has jumped above the $4.6 resistance level

  • The token is among the top gainers among the top 100 cryptocurrencies

  • RSI reading is at the overbought zone

Near Protocol NEAR/USD has jumped by 16% in the past 24 hours. The bullish sentiment is because of significant interest among investors in the protocol lately. Its trading volumes are up 47% in the past day at $681,243,479.

Near Protocol is a decentralized smart contract network that rivals Ethereum. It differentiates itself with the use of sharding technology to increase transaction throughput. Sharding segments a network infrastructure and lets nodes handle a fraction of it.

Transaction speeds have been a major challenge to the larger blockchain networks. Near Protocol is making a name for itself in space. It is attracting lucrative blockchain projects that are boosting its total value locked. 

One such project is Sweatcoin, a protocol that mints tokens with the steps taken by users. The funds flowing into the project have pushed NEAR Protocol’s TVL to $388 million. A look at the short-term technical outlook affirms a strong bullish momentum in Near Protocol. 

NEAR breaks above key resistance but is currently overbought

Source: TradingView

From the 4-hour technical chart above, NEAR has broken above the $4.6 resistance. The cryptocurrency had failed in the last four attempts to pierce above the level. Further, the 20-day and 50-day moving averages have joined the support.

However, NEAR could be preparing for a short-term retracement. The RSI is at the overbought zone. At 72, the momentum indicator is at the highest level since July 29.

Concluding thoughts

NEAR token is under a strong bullish momentum. The fundamentals around sharding technology and its fast and cheaper transaction speeds boost popularity. Nonetheless, the token could be facing a retracement, with RSI reading currently at the overbought zone. Investors should wait for the retracement before entering a long position.

The post Wait for a retracement as Near Protocol breaks above key resistance appeared first on CoinJournal.