Avalanche forms an ascending channel – Which levels should you watch?

  • Avalanche trades in an uptrend channel in strong bullish momentum

  • Growth in NFTs and DeFi is behind the positive sentiment

  • Watch for a potential buy entry on retracement

Avalanche’s AVAX/USD is leading gains among the top 20 largest cryptocurrencies. The token, which powers the layer-1 blockchain, is up 2.47% and 17.44% in daily and weekly data. AVAX is currently changing hands for around $29. The network expansion in NFTs and DeFi is behind the bullish momentum.

According to TVL aggregator DefiLlama, Avalanche’s top lending protocols are looking up. Among them is Benqi, which has gained 15% value in the past week. Avalanche, a proof-of-stake smart contract platform, is also making strides in NFTs.

Its NFT sales volumes in the past day are up 2.32% at $30,598, according to CryptoSlam. Native digital assets like Avapepes NFT and Pizza Game Chef Tools registered significant gains in the past week.

While the enthusiasm around NFTs has shown a cool-off, Avalanche is benefiting more in the space. The technical outlook in the 4-hour chart below complements AVAX’s strong bullish momentum.

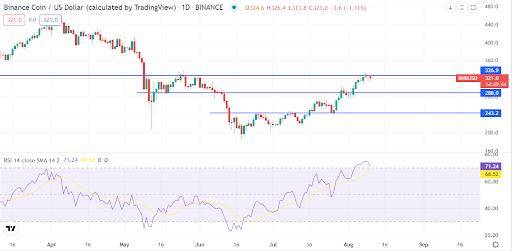
AVAX/USD forms an ascending channel in 4-hour chart 
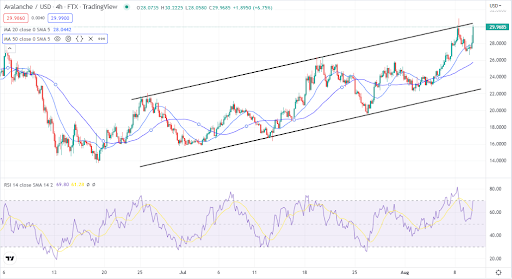
Source: TradingView 

From the 4-hour technical chart above, AVAX is trading on a clear trend of higher highs and higher lows. The token is trading near the top of the uptrend channel amid a strong bullish momentum. The 20-day and 50-day moving averages are both holding as support.

Nonetheless, AVAX could be preparing for a near-term retracement. With an RSI reading of 69, the token is approaching the overbought zone. In the case of retracement, $27 becomes the immediate fallback. The token can also retrace to $25 or $22 before any pullback.

Concluding thoughts

Avalanche has positioned itself as a strong smart contracts platform. It is attracting NFT, and DeFi projects with huge potential as a result. The on-chain activity is giving AVAX token a strong bullish momentum. The token is poised to continue moving on the uptrend. Investors should watch $27, $25, and $22 as possible entry points.

The post Avalanche forms an ascending channel – Which levels should you watch? appeared first on CoinJournal.

Buy Chainlink on a retracement as momentum remains strong after breakout

Chain Link Image on a cell phone

  • Chainlink token is boosted by strong fundamentals 

  • LINK eyes the next resistance at $10.7 but could correct on its way up

  • Investors should take advantage of a potential correction

Chainlink’s LINK/USD is gearing for the next bullish move. After a breakout above $7.4, the cryptocurrency has set $10.7 as the next potential level. LINK trades at $9.04 in a strong bullish momentum.

Chainlink gains come amid strong fundamentals. In June, the blockchain said its live price feed would be expanded to the Solana network. The blockchain plans to expand the live price feed to other coins. Chainlink currently supports live price feeds for USDC, BTC, and ETH. Next month, Bybit is expected to integrate Chainlink’s live price feeds for 35 coins. The move is expected to strengthen the price accuracy for spot trading.

Earlier in the year, Chainlink announced plans for Chainlink 2.0. The move will enhance the smart contract functionality of the blockchain and introduce staking. The developments are some of the triggers of LINK price, which traded at the bottom of $6 in mid-July.

Another bullish trigger for LINK is the inflation data on Wednesday. The data showed cooling consumer prices. That increased speculation of a less aggressive Fed, which boosted cryptocurrencies. LINK now eyes $10.7 and beyond next.

Chainlink token surges as inflation data show cooling prices

Source – TradingView

The technical outlook shows Chainlink pushing higher above $7.4. The MACD indicator shows a strong and increasing bullish momentum. The cryptocurrency faces an immediate minor retracement at $9.0. The established resistance is at $10.7.

LINK’s price could remain bullish in the next few days after the improved crypto sentiment. Investors should take advantage of a potential retracement to buy the token lower.

Summary

Chainlink’s price is very bullish due to strong fundamentals and improved crypto sentiment. The token could face a minor correction at $9. Investors should take advantage of a retracement to buy lower as momentum remains strong.

The post Buy Chainlink on a retracement as momentum remains strong after breakout appeared first on CoinJournal.

Binance token faces another litmus test as the target hit at $326

  • BNB has been boosted by recovering crypto market

  • The token is currently trading at a resistance of $326

  • Watch for a breakout to buy higher; otherwise, sell to snap it lower

Binance coin BNB/USD has been one of the strongest cryptocurrencies recently. At the current trading of $321, BNB has risen by more than 30% in a month. Estimates by CoinMarketCap show that BNB will end August at $360.91. The cryptocurrency is now facing speed bumps, which coincides with resistance at $326. 

BNB powers the world’s largest cryptocurrencies, which explains the recent gains. Investors once again getting back to cryptocurrencies could be boosting the trading volumes. Leading cryptocurrencies, including Bitcoin and Ethereum, escaped their prior bottoms.

BNB hits resistance after the latest pump

Source – TradingView

Technically, BNB is bullish. The cryptocurrency has been moving in a system of higher highs and higher lows since mid-June. The cryptocurrency has also been on an upward momentum. 

BNB has hit resistance at $326, and the bullish momentum has slowed. The cryptocurrency’s bullish momentum still remains in place. An RSI reading of 71 suggests that investors have been piling up on BNB, and it is already overbought.

Concluding thoughts

Although the bullish momentum for BNB has slowed, it remains in place and could break out soon. That is evident from the strong bullish push at the key resistance where the token is currently trading. 

Alternatively, profit-taking at the resistance could force a bear weakness on the BNB. If that becomes a reality, BNB could correct to $288, the next support.

Investors should consider selling now to buy lower or buy after a breakout. The next potential resistance level for BNB is $380. For now, we recommend watching the price action for the next trigger for buy trades.

The post Binance token faces another litmus test as the target hit at $326 appeared first on CoinJournal.

Is the Spell Token a buy as it forms an inverted H&S pattern?

Spell Token price surged to the highest level since May 22nd even as other cryptocurrency prices dropped. The SPELL token rose to a high of $0.00170, which was the highest level since May 21st of this year. It has risen by more than 131% from its lowest point this year.

What is SPELL and why is it rising?

Spell Token is the native token for Abracadabra, decentralized finance (DeFi) platform. Abracadabra is a DeFi platform that helps people to borrow online and leverage up their tokens. It is part of the Frog Nation, a company that owns veNFT and Frog USD.

Borrowers deposit their favorite cryptocurrencies as collaterals and then borrow Magic Internet Money (MIM), a leading stablecoin. MIM is a stablecoin that has a market cap of over $221 million. At its peak, it was one of the biggest stablecoins in the industry. Abracadabra also owns Magic Internet Gold (MIG), a stablecoin that is pegged to the US dollar.

The Spell Token price has been in a strong downward trend in the past few months as demand for the coin waned. It has crashed by more than 90% also as controversies in Frog Nation have kept people away from the platform.

As a result, the total value locked in Abracadabra has crashed from an all-time high $6.7 billion to less than $500 million. This sell-off accelerated after Terra UST lost its peg in May this year. The depeg led to a sharp decline in MIM’s and MIG’s total market cap as investors worried about algorithmic stablecoins.

Therefore, the current strong performance of the Spell Token price is likely because of a short squeeze in the market. This view is supported because there is no major news in the ecosystem and the total inflows into the network have remained low.

Spell Token price prediction

The daily chart shows that the SPELL price has made a strong recovery in the past few days. The coin has formed an inverted head and shoulders pattern and moved slightly above the 25-day and 50-day moving averages.. 

In price action analysis, this pattern is usually a bullish sign. Therefore, the Spell token price will likely continue rising as bulls target the key resistance at $0.0025.

The post Is the Spell Token a buy as it forms an inverted H&S pattern? appeared first on CoinJournal.

Litecoin price forecast as the fear and greed index recovers

Litecoin price has crawled back in the past few days as the crypto industry and stock market rebounded. LTC was trading at $61.74 on Tuesday, which was about 52% above the lowest level this year. Its market cap stands at more than $4.4 billion.

Fear and greed index 

Litecoin and other cryptocurrency prices bounced back recently as signs of greed in the market started to emerge. For example, the US dollar index has slipped from the year-to-date high of $109.3 to about $103. The falling USD is a sign that investors have embraced a risk-on sentiment.

Further, the closely watched volatility index (VIX) has dropped to the lowest level in months. This is a sign that volatility in the market has eased slightly.

Meanwhile, the fear and greed index that is tracked by CNN Money has risen from the extreme fear level to the current point at 52. This is a sign that investors are getting a bit greedy. 

Historically, stocks and cryptocurrency prices tend to do well in a period of greed in the market. This also explains why the Nasdaq 100 index is close to exiting its bear market.

At the same time, LTC has jumped as investors predict that the sell-off that took place earlier this month has faded. For one, the contagion that most people were expecting following the crash of Celsius, Voyager Digital, and Three Arrows Capital has not happened.

Further, on-chain data shows that activity in litecoin’s network has continued rising in the past few days. For example, the number of LTC addresses has jumped in the past few weeks although they remain substantially below their highest point in 2021.

Litecoin price prediction

The daily chart shows that the LTC price has made a strong recovery in the past few weeks. This recovery started when the coin dropped to a low of $40.59 this year. It has now managed to move slightly above the 25-day and 50-day moving averages while the MACD has moved above the neutral point. The two moving averages have even made a bullish crossover.

Therefore, the coin will likely continue rising as bulls target the important resistance point at $92.11, which was the lowest level since April this year. A move below the support at $50 will invalidate the bullish view.

The post Litecoin price forecast as the fear and greed index recovers appeared first on CoinJournal.