Ethereum gathers steam for Merge, ENS domains rise and stakers patiently wait

As we get closer and closer to one of the biggest events in the brief history of cryptocurrency – the Ethereum Merge – there are a number of metrics which are suggesting activity is picking up across the space.

Ethereum Name Service

The first is the Ethereum Name Service (ENS), which saw its third highest month of revenue in August. Generating $4.3 million in revenue, the service saw 34,000 accounts register names for the first time.

These names are a neat feature of Ethereum. Instead of providing somebody a long Ethereum address, instead a simple name ending in .eth can be provided, such as harrypotter.eth, for example. This name can be linked to one’s wallet, meaning it’s all that needs to be given when asking for a payment. Simple and intuitive.

The boost in these names being registered shows that people are positioning themselves for the Merge, slated to go live on September 15th.

13 million ETH staked

The amount of ETH locked up in the staking contract is now up to 13 million ETH, which is about 11% of the total supply. At the current market price of $1,635, that translates to over $21 billion of Ethereum locked up in the staking contract.

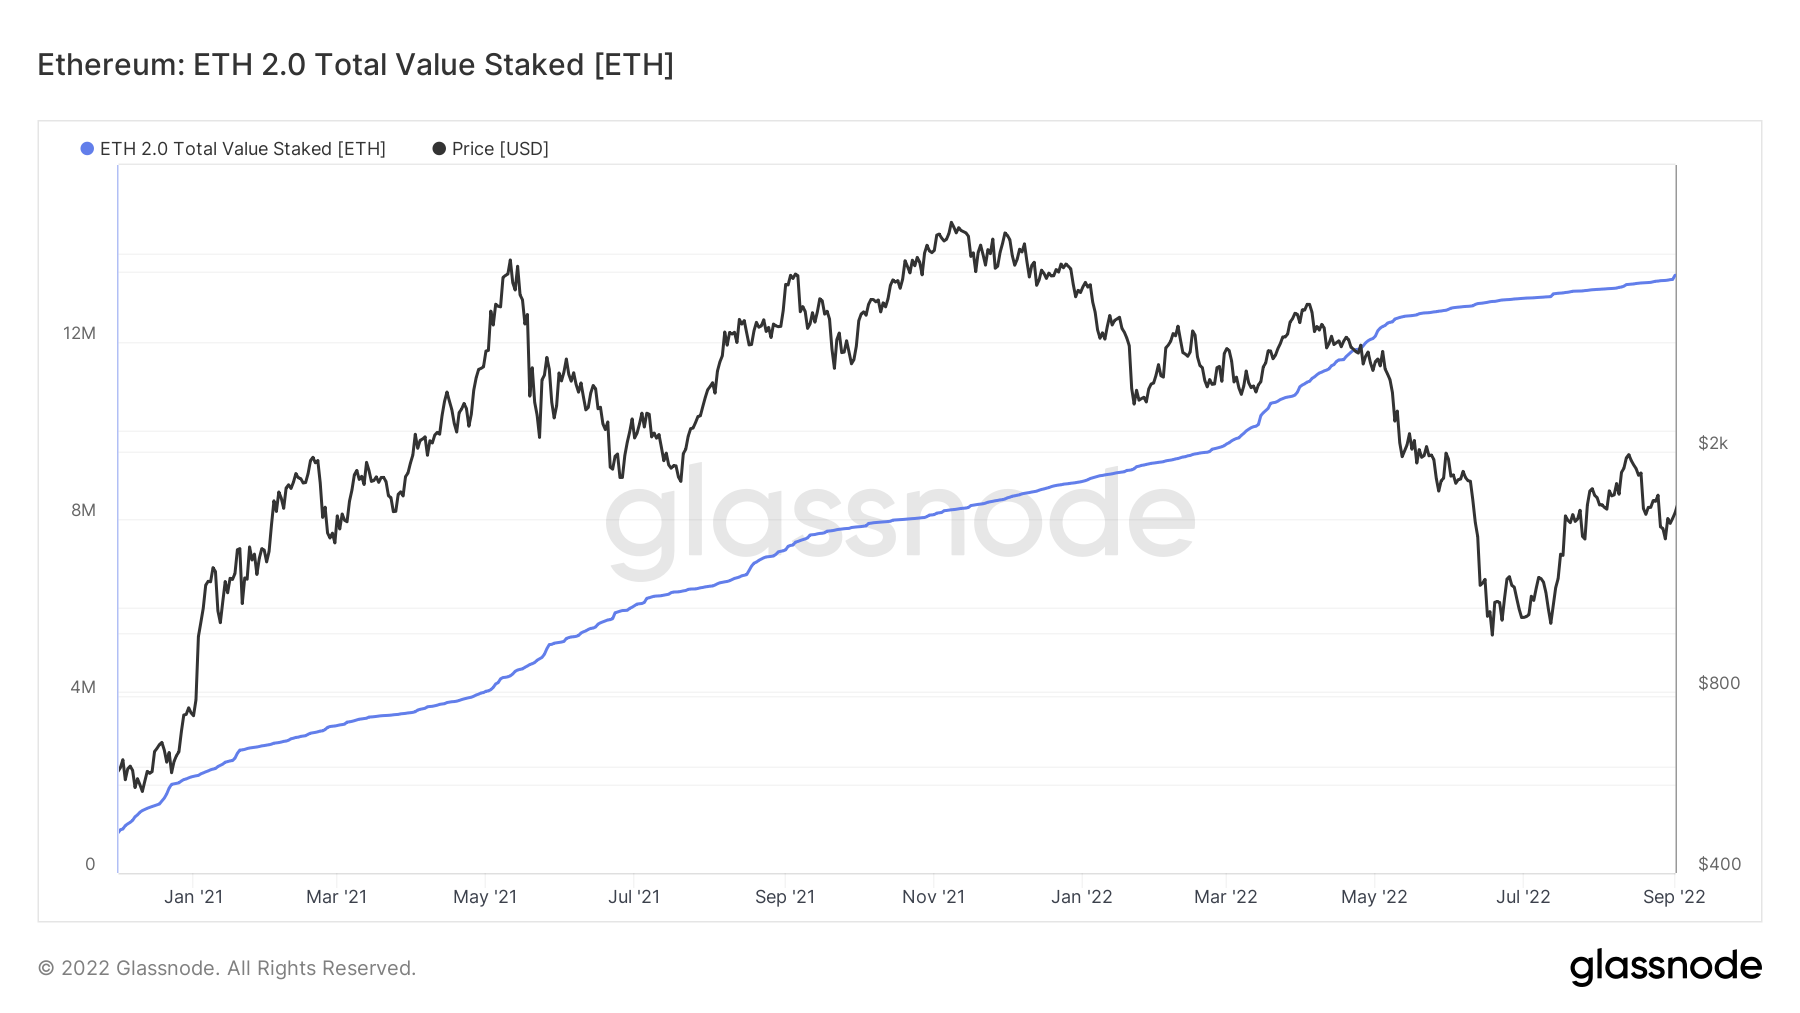
What is important to note here is that the Merge will not enable withdrawals of this ETH. I had previously speculated about whether a flooding of ETH into the market post-Merge could place downward pressure on the price – after all, much of the Ethereum has been locked up for quite a while, as the above graph shows.

However, investors will not be able to withdraw their ETH until another upgrade is implemented, which is not planned for 6 months to a year down the line. This should dull the concern around the supply/demand level as the Merge goes live. There are also liquid staking alternatives which mean the liquidity has not been totally inexistent to date.

Macro

And so we close in on the watershed moment, only two weeks away as I write this. The big question remains, will this be a “buy the rumour, sell the news” type event, or will Ethereum pump off the back of it.

My thoughts for the moment are simple – I think for the short-term price action, the macro climate is currently far more important, with spiralling inflation. A hawkish Fed and tense geopolitical climate still driving markets across the board.  

The post Ethereum gathers steam for Merge, ENS domains rise and stakers patiently wait appeared first on CoinJournal.

Mining revenue suggests Bitcoin is ready to move, but ONLY if macro environment co-operates

  • I jumped on-chain and noticed a key indicator – miner revenue – suggests that Bitcoin may be prepping for an upward move
  • But in isolation, this means nothing. Sample size for Bitcoin is too small, with the current environment the only macro bear market it has seen since launch in 2009
  • Until risk-off sentiment in wider market dissipates, on-chain indicators should be taken with pinch of salt


One of the most fascinating things about Bitcoin for me is the ability to jump on-chain and track a whole range of indicators. As the years go by and we build up more of a sample of how Bitcoin performs, these metrics become all the more powerful.

One of my favourite on-chain indicators is the Puell indicator. This takes the total miner revenue and adjusts it by its yearly moving average. So, the calculation of the indicator takes mining revenue and divides it by the 365-day simple moving average of mining revenue.

Miner actions often provide unique insights into the market. They are often viewed as compulsory sellers because their revenue is in Bitcoin, whereas their fixed costs – electricity, mostly – are in fiat. Obviously, they have to cover these fixed costs and so the issuance of bitcoins from miners will always be intrinsically related to price.

The Puell indicator pretty much tracks when the amount of bitcoins entering the market is too great or too little relative to historical norms. Looking back at it historically, there is quite a strong relationship – the price tends to move upward when the Puell indicator falls into the green zone on the chart below.  

The most recent time the Puell indicator dipped into the “buy” zone was mid-June. Again, we saw upward movement soon after, as Bitcoin had its little rally from about $20,000 up above $24,000. Of course in the last week or so we have dipped back down to below $20,000, as the Fed’s comments on interest rate plans and inflation sparked a wave of risk-off sentiment across all asset classes.

Interestingly, I noticed yesterday that the Puell indicator has dipped back into the “buy” zone. Zooming on the time period since the start of 2020 demonstrates this a bit clearer on the chart.

Then again, I’m always hesitant to use on-chain indicators in isolation. This is never more true than in the current climate, where we have an unprecedented blend of a hawkish Fed, rampant inflation and a geopolitical climate growing more volatile by the day.

This is the only time in Bitcoin’s short history that we have seen this macro blend. Indeed, Bitcoin was only launched in early 2009, meaning it has resided during a period of sustained up-only bull market dynamics. The historical sample size of its price action simply isn’t long enough to draw any firm conclusions, therefore.

The way I would ultimately look at the Puell indicator is that Bitcoin seems primed to move upward IF the macro environment cooperates. But that is a seriously big if. It has been the case all year – and it will continue to be the case – that macro developments are driving markets.

Bitcoin is following the stock market, which is following the news in the inflation, interest rate and geopolitical sectors. So while this is a bullish on-chain indicator for Bitcoin, it means nothing until we get further cooperation in the wider world.

The post Mining revenue suggests Bitcoin is ready to move, but ONLY if macro environment co-operates appeared first on CoinJournal.

Celsius Network price prediction: Here’s why CEL is soaring

Celsius Network price rebounded on Friday after the latest news on the company’s bankruptcy proceedings. The CEL token price jumped to a high of $1.6835, which was the highest level since August 24. It has jumped by more than 100% from its lowest level in August. 

Why is CEL rallying?

CEL is the native token for the Celsius Network, the Nexo competitor that filed for voluntary bankruptcy in June of this year. At its peak, the company had billions of dollars in client deposits and it was one of the biggest success stories in the crypto industry.

In May, the company announced that it would suspend deposits and withdrawals as the prices of most tokens collapsed. The CEL token rose sharply on Friday after the company asked the judge overseeing the case for permission to release $50 million to customers.

These funds are stuck in the company’s custody accounts, which are designed to store digital assets. In a statement, the judge said that the matter will be heard on October 6 of this year. Still, these funds are a small percentage of over $200 million that are stuck at the company’s custody accounts. 

At the same time, the company still owes customers over $4.2 billion of assets in the company’s earn accounts. Therefore, the future of the company is still in question even though some companies are attempting to buy it. 

Celsius Network price rose because of this news.  For a thinly traded assets like CEL, any good news usually attracts attention of day traders. This explains why the price of the token went parabolic. It also explains why the VGX price rose. VGX is the native token for Voyager Digital, a company that also filed for bankruptcy.

Celsius Network price forecast

The four-hour chart shows that the CEL price has been in a strong bullish trend in the past few days. It rose to a high of $1.5810, which was the highest point on June 21. As it rose, it moved slightly above the 25-day and 50-day moving averages while the Relative Strength Index (RSI) is nearing its overbought level.

Therefore, Celsius Network price will likely resume the bearish trend as the hype surrounding the $50 million return eases. If this happens, the coin will likely retest the important support at $1.06.

The post Celsius Network price prediction: Here’s why CEL is soaring appeared first on CoinJournal.

UFT price: What is UniLend Finance and Why Did it Just Soar?

UFT price went parabolic on Friday as demand and volume for the token rose. UniLend Finance’s token climbed to a high of $0.400, which was the lowest level since April of this year. It has jumped by over 475% from its lowest level in 2022, giving it a market cap of more than $22 million.

What is UniLend Finance?

UniLend Finance is a relatively small but fast-growing blockchain project that is in the decentralized finance (DeFi) industry. It was launched a few years ago to compete with larger platforms like Compound, Aave, and Maker.

The idea was to create a platform where users can trade more assets than those offered in those large projects. By so doing, the developers aimed to create a platform that has thousands of assets. To achieve that, they created a system that allows permissionless listing and one that allows lending and borrowing and trading among users.

There are several reasons why the UFT price has jumped in the past few weeks. First, the platform has continued to grow its ecosystem through partnerships. Early this week, UFT was listed on DEXTools, where users can easily track UFT pools in real time. 

It also reached a partnership with UpBots, which describes itself as a gateway for cryptocurrencies. Some of the other most recent partners are Algo Blocks and Life Labs. It now has over 100 partners, including Binance. Unilend Finance price is also jumping as investors wait for the upcoming Omnis mainnet launch. 

UFT price prediction

The four-hour chart shows that the UFT price has been in a bearish trend in the past few days. It then went parabolic on Thursday and Friday as the developers launched several partnerships. As it rose, it managed to move above the important resistance level at $0.3335, which was the highest point on May 26. 

As expected, the coin managed to rally above the 25-day and 50-day moving averages while the Relative Strength Index (RSI) moved to the extreme overbought level. The same is true with other oscillators like the Money Flow Index (MFI) and Stochastic have moved to their overbought levels.

Therefore, there is a likelihood that the coin will pull back sharply in the coming days. If this happens, the next reference level to watch will be at $0.25, which is about 30% below the current level.

The post UFT price: What is UniLend Finance and Why Did it Just Soar? appeared first on CoinJournal.

MATIC is up by 6% today following Robinhood support

MATIC is up by more than 6% today as the cryptocurrency market looks to end the week on a positive note.

MATIC, the native token of the Polygon network, is the best performer amongst the top 20 cryptocurrencies by market cap. The coin has added more than 6% to its value in the last 24 hours, outperforming the broader market. 

The broader crypto market is also recovering from its recent decline and could end the week on a positive note. The total market cap now stands around $990 billion, up by more than 1% today.

Bitcoin maintains its position above $20k and is up by more than 1% over the last 24 hours. Ether is eyeing the $1,600 resistance point after adding 3% to its value today.

MATIC’s positive performance comes after it announced that Robinhood had launched support for deposits and withdrawals of MATIC on the Polygon Proof-of-Stake (PoS) chain.

The Polygon team said the move is expected to bring all of the benefits of Ethereum’s Layer-2 (L2) solutions to Robinhood users for the first time. Some of these benefits include faster transactions and lower fees as compared to Ethereum.

Key levels to watch

The MATIC/USD 4-hour chart is positive, as Polygon has been performing well over the past 24 hours. The technical indicators show that MATIC’s metrics are improving following a slump earlier this week.

The MACD line is above the neutral zone, indicating bullish momentum for MATIC. The 14-day RSI of 65 shows that MATIC could be heading into the overbought region if the positive momentum is maintained.

At press time, MATIC is trading at $0.8853 per coin. If the bulls remain in control, MATIC could surge past the first major resistance level at $0.9489. 

However, unless there is an extended bullish run, MATIC could find it hard to break past August’s high of $1.057 in the near term. 

The post MATIC is up by 6% today following Robinhood support appeared first on CoinJournal.