Hedera (HBAR/USD) technical analysis as it struggles at support

  • Hedera struggles at dynamic support
  • If the US dollar weakens and Hedera fails to follow, it suggests internal problems
  • Bulls may want to see a daily close above $0.07

Bitcoin rallied at the start of 2023 and triggered similar rallies in all corners of the cryptocurrency market. Even less known and popular projects, such as Hedera, benefited from Bitcoin’s bullish breakout. 

HBAR/USD surged from $0.04 to $0.1 in less than three months. It appeared like only the sky was the limit, but reality settled in slowly. 

Fast forward several months, and Hedera gave back all of its gains. Moreover, it is unable to bounce convincingly, as all rallies are sold. 

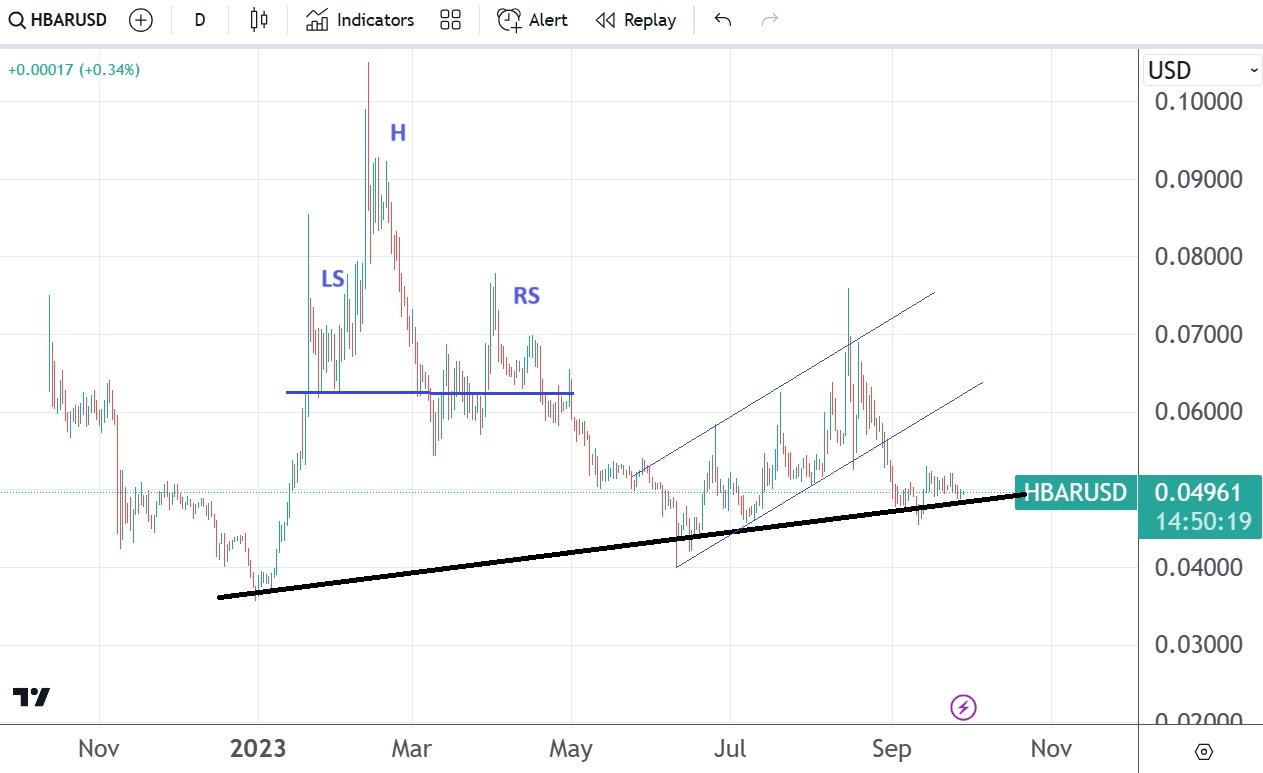
Currently, it sits on dynamic support and struggles to hold above. With the US dollar rallying across the board, will HBAR/USD bounce from dynamic support?

Hedera chart by TradingView

The bullish case for Hedera

Bulls have a case as long as HBAR/USD holds above the dynamic support area seen in black on the chart above. 

The daily chart also reveals strong resistance at the $0.06 – $0.07 area. A daily close above there, especially above $0.07, would reinforce the bullish case. 

For that to happen, the US dollar must turn. It rallied over the summer months, and now that September ends, it may turn. In fact, it is the only option for Hedera to make a bullish reversal, given that the dollar was in the driving seat all year. 

The bearish case for Hedera

On the flip side, a drop below dynamic support might suggest internal problems. That is particularly the case if the dollar weakens while Hedera fails to rally. 

The post Hedera (HBAR/USD) technical analysis as it struggles at support appeared first on CoinJournal.

Stellar (XLM/USD) fails at $0.2; attention turns to previous support

  • $0.2 proves to be strong resistance for Stellar
  • The US dollar’s strength is responsible for Stellar’s weakness
  • Support in the triple bottom area might not hold if the market gets there

The US dollar surged during the summer, putting pressure on equities and fiat currencies. It also pressured the cryptocurrency market, as a higher dollar pressured crypto prices to their lows. 

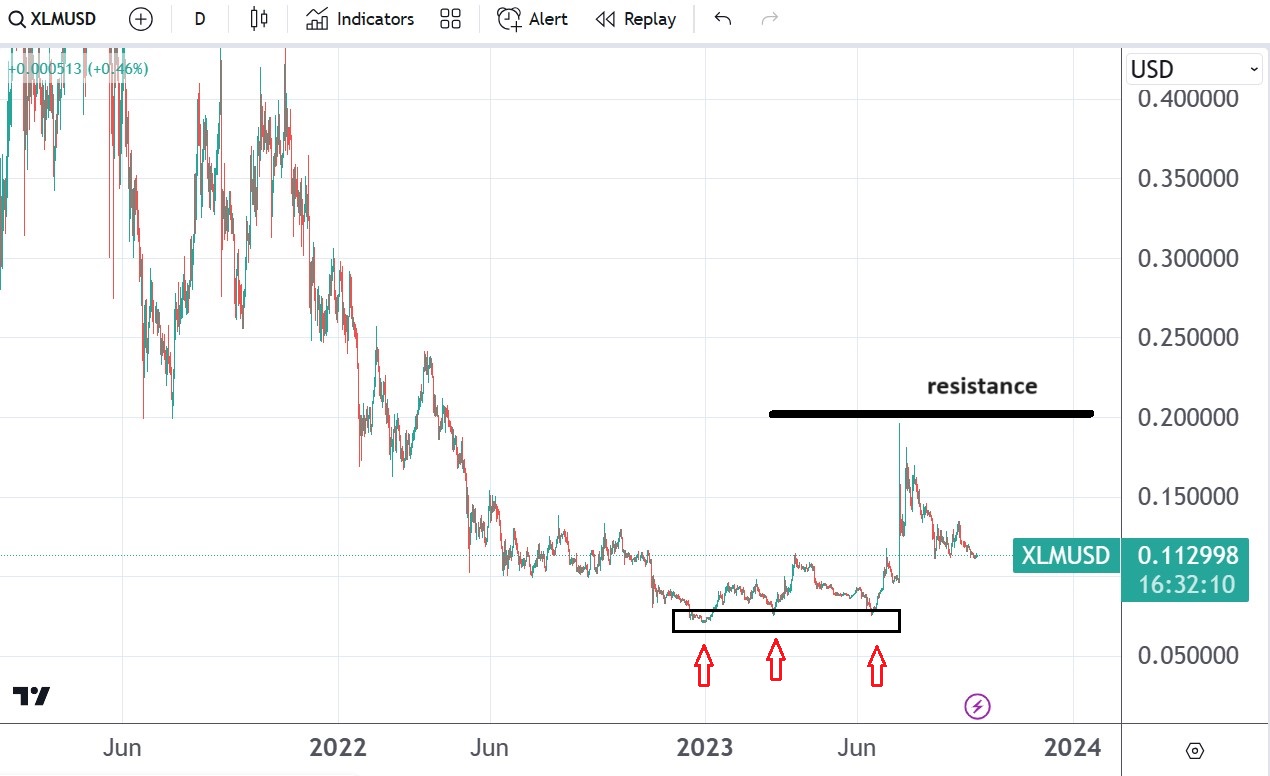
One example is Stellar (XLM/USD). The bounce during summer to $0.2 seemed to be a reaction to a triple bottom formed earlier. However, it was just a spike in an otherwise bearish trend. 

Bearish market rallies are violent and often lead traders to believe that a sharp reversal might be in the cards. But frequently, they are nothing but spikes. 

In other words, for Stellar to keep rallying above $0.2, the dollar should give up its summer gains. 

Stellar chart by TradingView

How can the dollar turn bearish?

In several ways. 

One is that bond yields come down, and bond prices come up. The massive selloff in the bond market seen recently led to a surge in the demand for greenbacks. 

Another is a consolidation or even a reversal in crude oil prices. Oil rallied over 38% during the summer, triggering lower equity prices, which in turn translated into a strong dollar. 

Finally, the Federal Reserve. While no rate cuts are in the pipeline anytime soon, the central bank’s message is important. 

So far, the Fed prefers to be in the wait-and-see camp. Uncertainty is key, and the balance sheet keeps shrinking. 

Coming back to Stellar, the inability to break above $0.2 resistance might send the price back to support in the area where the triple bottom formed. If that is the case, support is unlikely to hold. 

The post Stellar (XLM/USD) fails at $0.2; attention turns to previous support appeared first on CoinJournal.

Shiba Memu resilient as Nasdaq 100, Russell 2000, bonds plunge

  • American stocks continued their sell-off this week as risks rose.

  • Cryptocurrencies have proven resilient despite the challenging environment.

  • Shiba Memu token sale has accelerated recently. 

It has been a sea of red in the financial market this week as the fear and greed index plunged to the lowest level in months and the US dollar index (DXY) surged to $106.7. The closely watched iShares 20 Plus Year Treasury Bond ETF (TLT) has plunged to the lowest point since 2014. It has fallen by over 17% from the highest point this year.

Meanwhile, the small-cap Russell 2000 index, has moved into a correction zone by plunging by over 12% from its peak this year. Other assets like commodities have also retreated as investors remain concerned about the next action by the Federal Reserve. The Fed has committed to hike interest rates to 5.7%, raising concerns about defaults and a recession. 

Cryptocurrency prices have remained quite resilient in the past few weeks. Bitcoin has remained above $26,000 while the total market cap of all digital coins has remained above $1 trillion. Other coins like Chainlink, Tron, and Terra Luna have been relatively resilient in this period.

Shiba Memu token sale continues

Meanwhile, Shiba Memu’s token sale has continued firing on all cylinders. The developers have raised over $3.36 million in the past few weeks, making it one of the most successful token sales this year. 

Shiba Memu’s sale gained steam this week after Amazon made a $4 billion investment in Anthropic, a new company in the generative AI industry. The company has launched Claude, a new platform similar to ChatGPT that aims to become a leading player in generative AI. It can answer long and complex questions with ease.

Amazon’s investment in Anthropic is important for Shiba Memu since the project has AI features. For starters, Shiba Memu aims to become a leading player in the meme coin and AI space. As a meme coin, the project seeks to become a viable alternative to Shiba Inu, one of the biggest meme coins in the world.

As part of its strategy to create utility, Shiba Memu will incorporate artificial intelligence features in its ecosystem. Initially, these features will be about automated marketing. It will use technologies like neural language processing and regression modes in all this. You can buy Shiba Memu token here.

Is Shiba Memu a good investment?

Shiba Memu has proven quite resilient in the past few weeks as concerns in the crypto and stock market have continued. It has continued raising huge sums of money from global investors. Most of these early adapters hope that their little investment will make them Shiba Memu millionaires.

Recently, we saw a few people become Pepe millionaires. We have also seen Shiba Inu and Bonk millionaires in the past few years. Therefore, because of Shiba Memu’s popularity in the presale, there is a likelihood that it will also create many wealthy people.

However, like all assets, especially cryptocurrencies, there are always risks. Recently, we have seen many hot cryptocurrencies like Zilliqa and Hedera Hashgraph plunge. Therefore, you should have proper risk management strategy and invest funds you are comfortable to lose.

The post Shiba Memu resilient as Nasdaq 100, Russell 2000, bonds plunge appeared first on CoinJournal.

Riot Platforms stock price analysis: Here comes the death cross

Riot Platforms (NASDAQ: RIOT) stock price continued its sell-off even as Bitcoin and other cryptocurrencies held steady. The shares plunged to a low of $8.90 on Tuesday, the lowest level since April 6th. It has retreated by more than 56% from its highest point this year, meaning it is in a deep bear zone.

Bitcoin is holding really well

Riot Platforms is a major company in the Bitcoin mining industry. The company runs some of the biggest mining rigs in the world. For example, its Rockdale facility is the biggest mining and hosting facility in North America. It has a deployed hash rate of 10.7 EH/s. 

Riot Platforms and other mining companies like Marathon Digital, Cipher Mining, and Argo Blockchain tend to do well when Bitcoin price is rising. This explains why the shares jumped to a high of over $20.6  when Bitcoin surged to the year-to-date high of $32,000.

Therefore, it is quite surprising that the Riot Platforms share price has plunged even as Bitcoin has done well in the past few weeks. Bitcoin has remained above $26,200 even as the fear and greed index has dropped to the extreme fear zone of 25. The Dow Jones, Nasdaq 100, and S&P 500 have also slipped sharply recently.

I believe that Riot Platforms and Marathon Digital are good speculative buys. For one, I believe that Bitcoin will be much higher than where it is today. Bitcoin halving is coming in 2024, which will likely push its price higher.

Further, I suspect that the Securities and Exchange Commission (SEC) will approve a spot Bitcoin ETF. Besides, the leading applicants are some of the biggest companies in the industry like Blackrock, Fidelity, and WisdomTree.

Most importantly, Bitcoin has held quite well even as the Federal Reserve has hiked interest rates to the highest point in more than two decades.

Riot Platforms stock price forecast

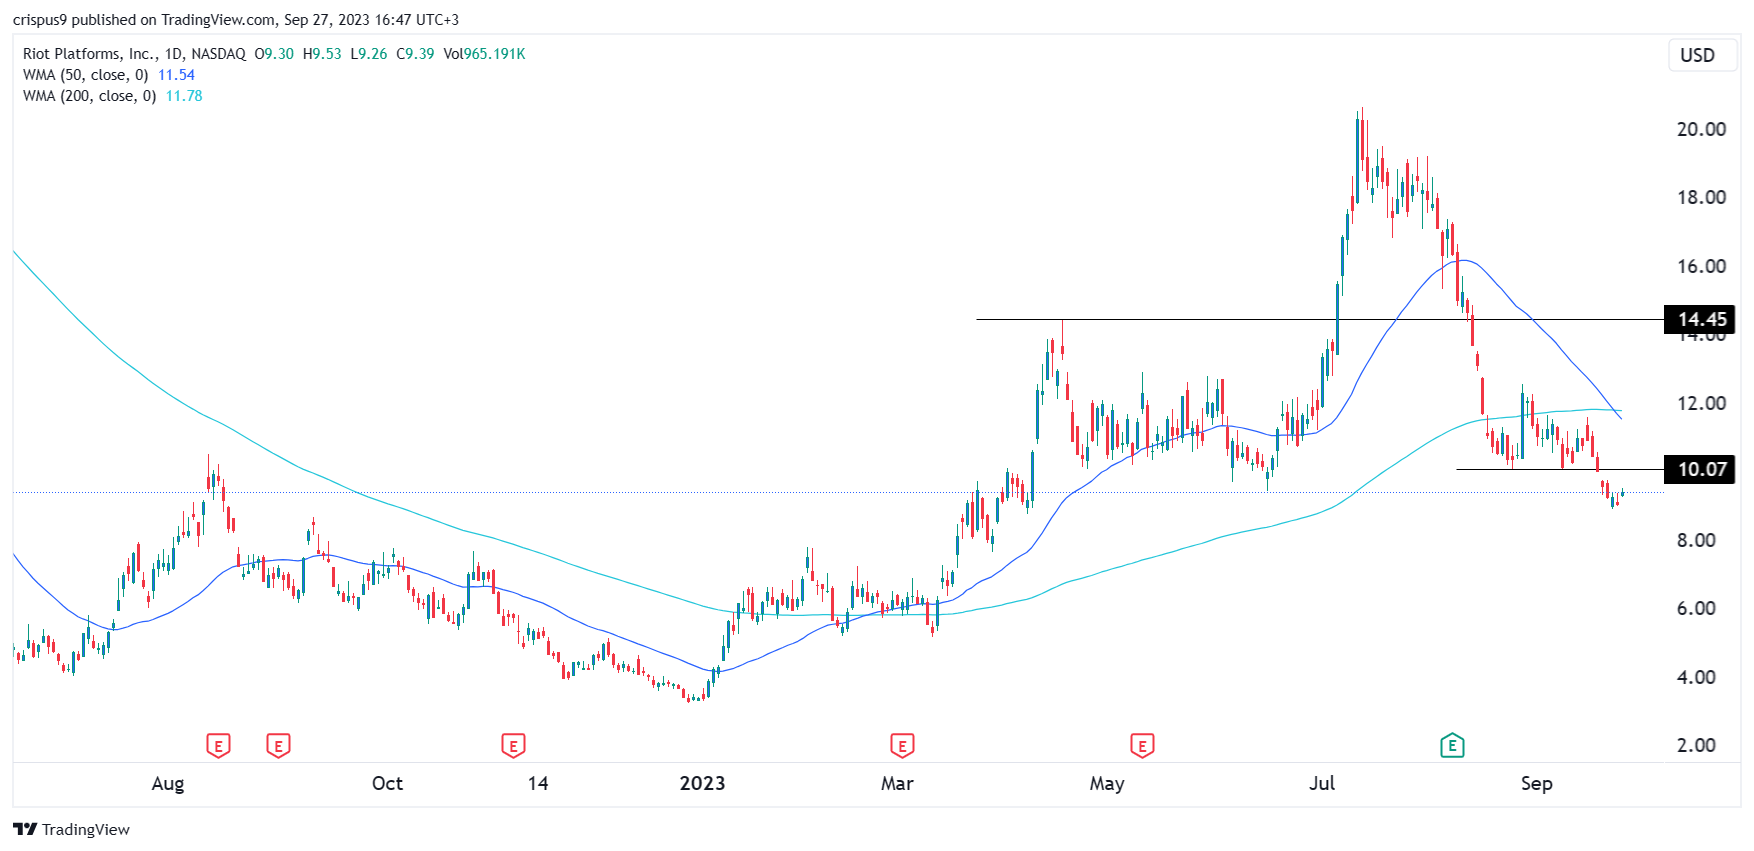
The daily chart shows that the RIOT share price has been in a strong bearish trend in the past few months. It recently crashed below the key support at $14.45, the highest point in April this year.  The stock has dropped below the key support at $10.07, the lowest point on August 25th. 

Most importantly, the 50-day and 200-day weighted moving averages (WMA) are about to form a death cross. Therefore, the stock will likely remain underwater for a while. If this happens, the next level to watch will be at $8.

The post Riot Platforms stock price analysis: Here comes the death cross appeared first on CoinJournal.

Binance Coin under severe pressure, tests the $200 support level

  • Binance Coin forms a descending triangle above important support area
  • 2023 gains are gone
  • A break below $200 should trigger more weakness

The US dollar is the month’s winner as it rallied against its peers and against major cryptocurrencies in September. Moreover, the strength appears to be more visible against cryptocurrencies.

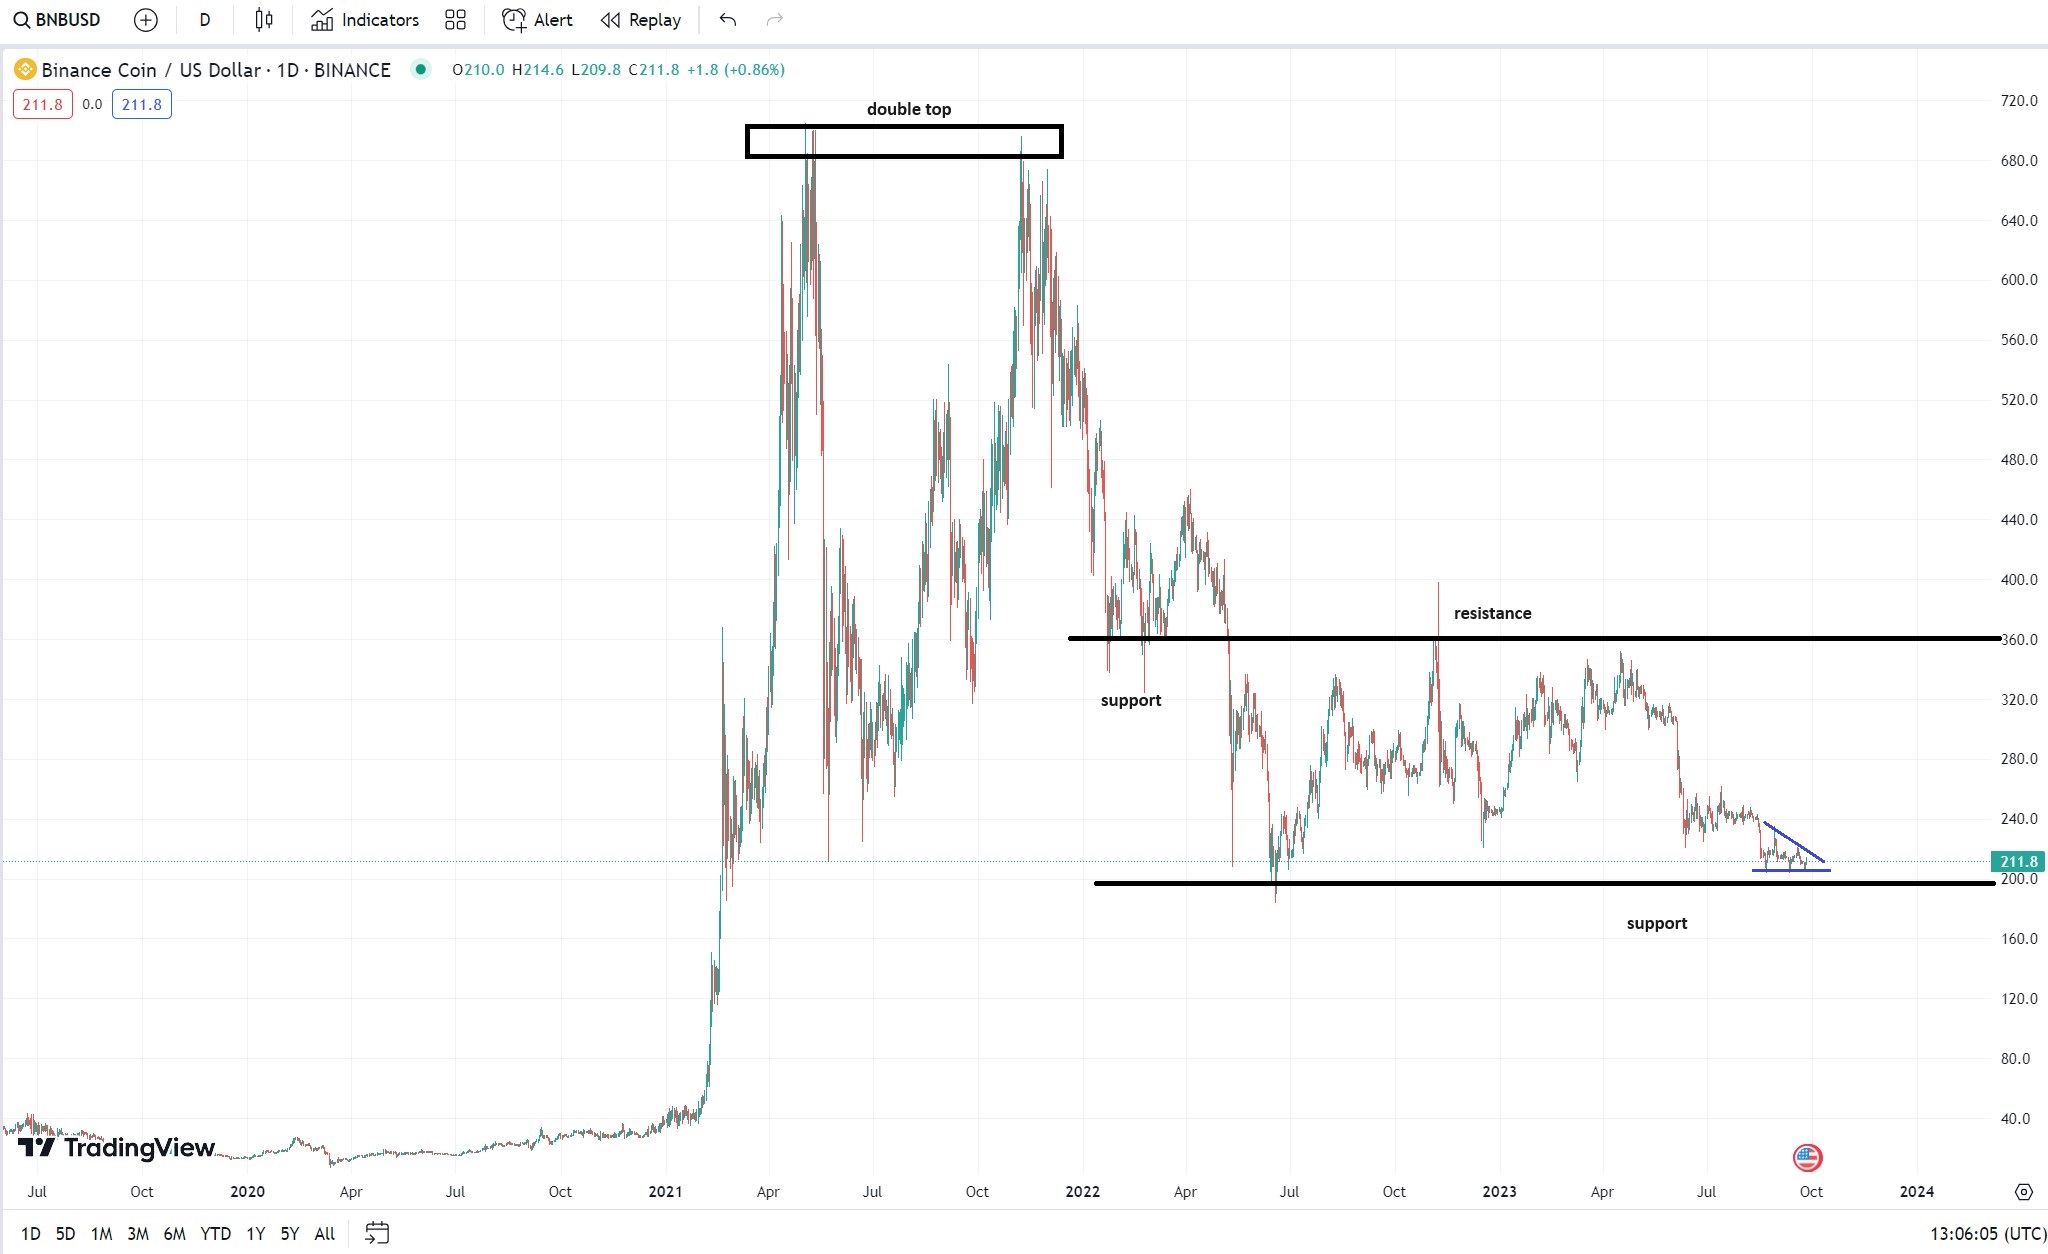
Take Binance Coin for example. It erased all its 2023 gains (and some more). It also formed a descending triangle right above horizontal support seen at $200. This is dangerous for bulls because, if broken, there is not much left to support the price until much lower.

Bearish technical picture for Binance Coin

Binance Coin made a double top pattern during the COVID-19 pandemic. Twice, it tried to break above $700, without success.

Since then, however, it was all downside. The scandals in the cryptocurrency industry surely did not help. After all, FTX went busted, trust was lost, and many chose to leave the industry altogether.

Binance Coin chart by TradingView

In the first quarter of 2022, the Binance Coin found support in the $350 area. It hovered above for a while until breaking lower to the next support level.

Once broken, support became resistance.

So powerful the resistance was that not even the 2023 rally, seen on all major currencies, was enough to break it. Instead, the market formed a reversal pattern (i.e., a triangle) and then erased all its gains for the year.

Currently, it sits right above horizontal support at $200. A break there could spell trouble because there is nothing else to hold the price action until much lower levels.

The US dollar’s strength is a cause of major disruption in the cryptocurrency industry. But so is the uncertainty in the industry, the ongoing scandals, that led to investors fleeing for good.

Bulls may want to see that descending triangle (in blue on the chart above) invalidated by the market. If not, more pain lies ahead.

The post Binance Coin under severe pressure, tests the $200 support level appeared first on CoinJournal.